Enriching Cysteine-Containing Peptides Using a Sulfhydryl-Reactive Alkylating Reagent with a Phosphonic Acid Group and Immobilized Metal Affinity Chromatography
- PMID: 36971515
- PMCID: PMC10311885
- DOI: 10.1021/acs.jproteome.2c00806
Enriching Cysteine-Containing Peptides Using a Sulfhydryl-Reactive Alkylating Reagent with a Phosphonic Acid Group and Immobilized Metal Affinity Chromatography
Abstract
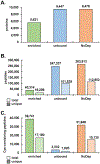
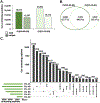
The reduction of disulfide bonds and their subsequent alkylation are commonplace in typical proteomics workflows. Here, we highlight a sulfhydryl-reactive alkylating reagent with a phosphonic acid group (iodoacetamido-LC-phosphonic acid, 6C-CysPAT) that facilitates the enrichment of cysteine-containing peptides for isobaric tag-based proteome abundance profiling. Specifically, we profile the proteome of the SH-SY5Y human cell line following 24 h treatments with two proteasome inhibitors (bortezomib and MG-132) in a tandem mass tag (TMT)pro9-plex experiment. We acquire three datasets─(1) Cys-peptide enriched, (2) the unbound complement, and (3) the non-depleted control─and compare the peptides and proteins quantified in each dataset, with emphasis on Cys-containing peptides. The data show that enrichment using 6C-Cys phosphonate adaptable tag (6C-CysPAT) can quantify over 38,000 Cys-containing peptides in 5 h with >90% specificity. In addition, our combined dataset provides the research community with a resource of over 9900 protein abundance profiles exhibiting the effects of two different proteasome inhibitors. Overall, the seamless incorporation of alkylation by 6C-CysPAT into a current TMT-based workflow permits the enrichment of a Cys-containing peptide subproteome. The acquisition of this "mini-Cys" dataset can be used to preview and assess the quality of a deep, fractionated dataset.
Keywords: 6C-CysPAT; FAIMS; Fe3+-NTA; Orbitrap Eclipse; TMTpro; isobaric tagging.
Figures


References
-
- Auten RL; Davis JM Oxygen toxicity and reactive oxygen species: the devil is in the details. Pediatr. Res 2009, 66, 121–127. - PubMed
-
- Gygi SP; Rist B; Gerber SA; Turecek F; Gelb MH; Aebersold R Quantitative analysis of complex protein mixtures using isotope-coded affinity tags. Nat. Biotechnol 1999, 17, 994–999. - PubMed
-
- Gygi SP; Rist B; Griffin TJ; Eng J; Aebersold R Proteome analysis of low-abundance proteins using multidimensional chromatography and isotope-coded affinity tags. J. Proteome Res 2002, 1, 47–54. - PubMed
-
- Li J; Steen H; Gygi SP Protein profiling with cleavable isotope-coded affinity tag (cICAT) reagents: the yeast salinity stress response. Mol. Cell. Proteomics 2003, 2, 1198–1204. - PubMed
Publication types
MeSH terms
Substances
Grants and funding
LinkOut - more resources
Full Text Sources
Other Literature Sources
Medical
Molecular Biology Databases

