. 2023 Apr 4;120(14):e2219086120.
doi: 10.1073/pnas.2219086120. Epub 2023 Mar 27.

Tonic-signaling chimeric antigen receptors drive human regulatory T cell exhaustion

Affiliations

Tonic-signaling chimeric antigen receptors drive human regulatory T cell exhaustion

Caroline Lamarche et al. Proc Natl Acad Sci U S A. .

Abstract

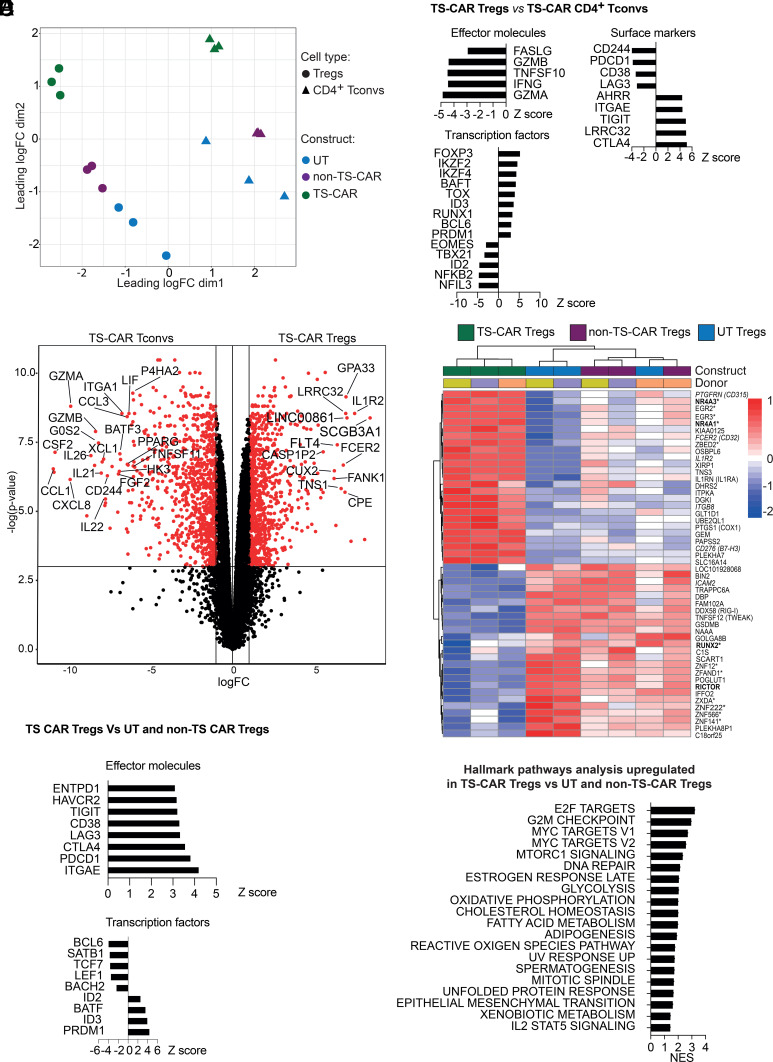
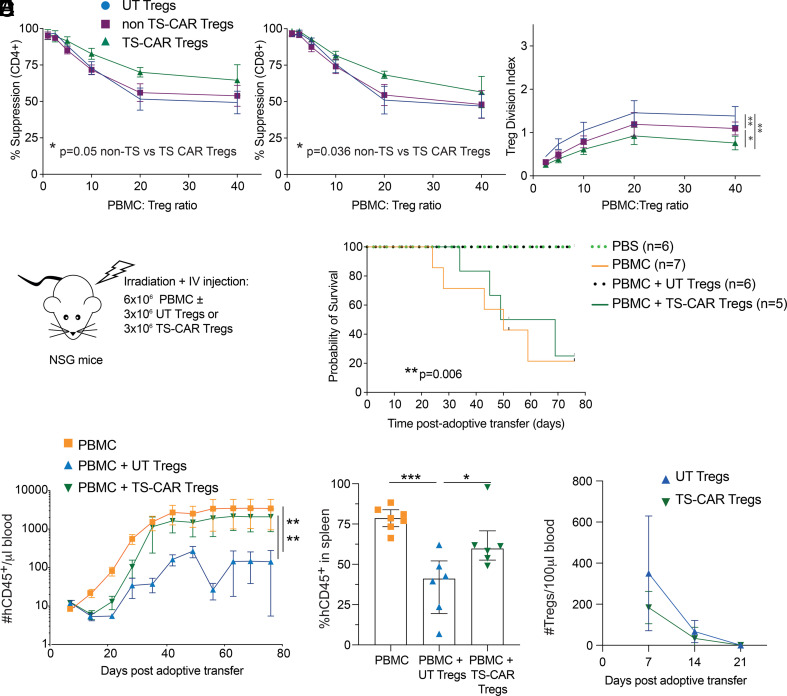
Regulatory T cell (Treg) therapy is a promising approach to improve outcomes in transplantation and autoimmunity. In conventional T cell therapy, chronic stimulation can result in poor in vivo function, a phenomenon termed exhaustion. Whether or not Tregs are also susceptible to exhaustion, and if so, if this would limit their therapeutic effect, was unknown. To "benchmark" exhaustion in human Tregs, we used a method known to induce exhaustion in conventional T cells: expression of a tonic-signaling chimeric antigen receptor (TS-CAR). We found that TS-CAR-expressing Tregs rapidly acquired a phenotype that resembled exhaustion and had major changes in their transcriptome, metabolism, and epigenome. Similar to conventional T cells, TS-CAR Tregs upregulated expression of inhibitory receptors and transcription factors such as PD-1, TIM3, TOX and BLIMP1, and displayed a global increase in chromatin accessibility-enriched AP-1 family transcription factor binding sites. However, they also displayed Treg-specific changes such as high expression of 4-1BB, LAP, and GARP. DNA methylation analysis and comparison to a CD8+ T cell-based multipotency index showed that Tregs naturally exist in a relatively differentiated state, with further TS-CAR-induced changes. Functionally, TS-CAR Tregs remained stable and suppressive in vitro but were nonfunctional in vivo, as tested in a model of xenogeneic graft-versus-host disease. These data are the first comprehensive investigation of exhaustion in Tregs and reveal key similarities and differences with exhausted conventional T cells. The finding that human Tregs are susceptible to chronic stimulation-driven dysfunction has important implications for the design of CAR Treg adoptive immunotherapy strategies.

Keywords: chimeric antigen receptor; epigenetics; exhaustion; regulatory T cells; tolerance.


Conflict of interest statement

The authors have organizational affiliations to disclose. E.W.W. consults for Lyell Immunopharma, C.L.M. consults for Lyell Immunopharma, E.W.W. holds equity in Lyell Immunopharma, C.L.M. holds equity in Lyell Immunopharma, M.K.L. has patent applications related to CAR based immunotherapy, C.L.M. holds several patent applications in the area of CAR based immunotherapy.

Figures

Fig. 1.
Fig. 1.
Expression of a tonic signaling CAR in Tregs induces phenotypic changes without lineage destabilization. Naive Tregs were left transduced (UT) or transduced with retrovirus encoding a non-tonic signaling (non-TS) or a tonic signaling (TS-) CAR. After 11 to 12 d of culture, cells were analyzed for expression of (A) LAG-3, TIM-3, PD-1, (B) GITR, 41BB, (C) CTLA4, LAP, GARP, and (D) Ki67. (E) Viability was assessed using an automated cell counter and apoptosis by flow cytometry and (F) FOXP3 expression by intracellular staining. (G) DNA was isolated, and pyrosequencing was used to measure methylation status of 7 CpGs in the Treg-specific demethylation region (TSDR) (male samples). Data are the average methylation of the 7 CpGs. For reference, the average amount of methylation in Tconv is indicated by the dotted line. (H) Intracellular cytokine production was assessed by flow cytometry 4 h after a PMA/Ionomycin stimulation. Each dot represents a unique donor. Error bars represent median ± interquartile range. (AH) One-way Anova with Turkey’s comparisons test. For AE (Left), n = 11 to 14 from 5 to 6 independent experiments, except for 41BB n = 3. For the apoptosis assay (E), Right, n = 5 to 6 from 3 to 4 independent experiments. For F, n = 11 to 17 from 5 to 7 independent experiments. For G, n = 3 to 6 from 3 to 4 independent experiments. For H, n = 3 to 6 from three independent experiments. ****P ≤ 0.0001, ***P ≤ 0.001, **P ≤ 0.01, *P ≤ 0.05.
Fig. 2.
Fig. 2.
Expression of a tonic signaling CAR results in differential effects on the transcriptome of Tregs and Tconvs. After 12 d of culture, RNA was extracted from Tregs or CD4+ Tconvs that were untransduced (UT) or transduced to express a non-tonic signaling (non-TS) or a tonic signaling (TS-) CAR, and subject to RNA sequencing. (A) Multidimensional scaling plots comparing the transcriptome of the indicated types of Tregs and Tconvs. (B) Z score of differentially expressed genes in TS-CAR Tregs compared to UT or non-TS-CAR Tregs. Threshold used was a logFC > 1 and adj. P value < 0.05 and logFC < −1 and adj. P value < 0.05. (C) Volcano plot comparing the gene expression profile of TS-CAR Tregs versus TS-CAR Tconvs after removal of genes differentially expressed (upregulated and downregulated) between UT Tconvs and UT Tregs (Fig. S5A). Genes in red are defined by a P value < 0.05. (D) Heatmap showing the top 50 differentially expressed genes between the different types of Tregs. Bold genes are associated with exhaustion in Tconvs, italicized genes are cell surface proteins and those marked with * are transcription factors. (E) Z score comparing genes that were significatively upregulated or downregulated in TS-CAR Tregs versus TS-CAR Tconvs. Threshold used was a logFC > 1 and adj. P value < 0.05, and logFC < −1 and adj. P value < 0.05. (F) Gene set enrichment analysis. Normalized enrichment score (NES) of hallmark pathways analysis overrepresented in TS-CAR Tregs compared to non-TS CAR or UT Tregs cells. Each dot represents a unique donor. n = 3 per group from two independent experiments.
Fig. 3.
Fig. 3.
Expression of a tonic signaling CAR signaling alters Treg metabolism. Tregs were untransduced (UT) or transduced to express a non-tonic signaling (non-TS) or a tonic signaling (TS-) CAR. After 11 to 12 d of culture, cells were plated in Cell-Tak coated wells and subject to the Agilent Seahorse XF Cell Mito Stress Test. (A) Extracellular acidification rate (ECAR) (Left) and normalized to baseline ECAR (Right) over time, (B) oxygen consumption rate (OCR) (Left) and normalized to baseline OCR (Right) over time. Oligomycin, FCCP, and a mix of Rotenone and antimycin A were added as indicated. (A&B) n = 3 to 5 donors from two independent experiments, using the average of technical replicates. Error bars represent mean ± SEM. (C) OCR/ECAR ratio at baseline. One-way Anova with Turkey’s comparisons test P = 0.0196. n = 4 to 6 from three independent experiments. (D) The spare respiratory capacity (SRC) was calculated by the average of the maximum OCR after FCCP injection minus the average basal respiration, divided by the average basal respiration, times 100 [(max-basal)/basal*100)]. One-way Anova with Turkey’s comparisons test P = 0.0054, n = 3 to 4 from two independent experiments. **P ≤ 0.01, *P ≤ 0.05.
Fig. 4.
Fig. 4.
Changes in chromatic accessibility in TS-CAR Tregs. Tonic signaling (TS) and non-TS CAR Tregs were subjected to transposase-accessible chromatin using sequencing (ATAC-seq) after 12 d of culture. (A) Differentially accessible regions (DAR)s between TS- and non-TS-CAR Tregs using a threshold of FC > 2 and adj. P value < 0 > 01. (B) Annotated genomic regions of DARs that are more accessible in TS-CAR Tregs (Left) or in non-TS-CAR Tregs (Right). (C) Heat map of 324 DAR between TS- and non-TS CAR Tregs using an absolute fold change > 3 and padj < 0.05, with known transcription factors indicated. (D) Transcription factor motifs enriched in TS-CAR Tregs were identified by HOMER. N = 3 to 4 donors tested in two independent experiments.
Fig. 5.
Fig. 5.
TS-CAR Tregs undergo DNA methylation reprogramming. Whole-genome bisulfite sequencing was performed in TS and non-TS-CAR Tregs and Tconvs. (A) Heat map of normalized methylation levels at 245 CpG methylation loci that are part of an established methylation-based multipotency index (MPI). (B) MPI values in relation to established values from naive (=1) and exhausted (=0) CD8+ T cells. (C) Gene Set Enrichment Analysis (GSEA) comparing the enrichment of an exhaustion program in Tregs vs Tconvs, comparing non-TS CARs on the left and TS-CARs on the right. (D) Representative differentially methylated regions (DMR) tracks for TCF7, TOX, and PRDM1 in TS and non-TS CAR Tregs and Tconv. Significant DMRs highlighted in the green boxes, with the significant comparison highlighted underneath in pink. TCF1/7, TOX and PRDM1 expression was assessed by flow cytometry, comparing TS or non-TS CAR to untransduced (UT) Tregs. N = 3 to 5 donors tested in two independent experiments. ****P ≤ 0.0001, ***P ≤ 0.001, **P ≤ 0.01, *P ≤ 0.05.
Fig. 6.
Fig. 6.
Tonic signaling CAR Tregs are functional in vitro but not in vivo. (A) Suppression of CPD-ef450-labeled PBMCs by untransduced (UT), non-tonic signaling (non-TS), or tonic signaling (TS-) CAR CPD-ef-670-labeled Tregs was determined after 4 d of coculture. n = 8 to 10 from four independent experiments (B) The Treg division index from cultures in (A) was determined. n = 6 to 7 from three independent experiments (A and B) Analysis were done using one-way ANOVA with Turkey’s multiple comparisons test. (CF) Irradiated NSG mice were injected with PBS or 6 × 106 PBMCs without or with 3 × 10⁶ UT or TS-CAR Tregs. Data from two independent experiments (C) Schematic diagram of the experiment set up. (D) Survival curve, log-rank (Mantel-Cox) test. (E) Absolute number of human CD45+ cells/µL of blood assessed weekly after adoptive transfer. One-way ANOVA with Dunnett’s multiple comparisons test (Left) and % Human CD45+ engraftment in the spleen upon experimental or humane endpoint (of live singlets) in the different groups (Right). (F) Absolute number of human Tregs/100 µL of blood assessed weekly after adoptive transfer. Tregs were gated as live human CD45+CD4+HLA-A2neg. Two-way ANOVA showed no differences between groups, mean ± 95% CIs are shown. ***P ≤ 0.001, **P ≤ 0.01, *P ≤ 0.05.

References

    1. Boardman D. A., Levings M. K., Emerging strategies for treating autoimmune disorders with genetically modified Treg cells. J. Allergy Clin. Immunol. 149, 1–11 (2022). - PubMed
    1. MacDonald K. N., Piret J. M., Levings M. K., Methods to manufacture regulatory T cells for cell therapy. Clin. Exp. Immunol. 197, 52–63 (2019). - PMC - PubMed
    1. Ou K., et al. , Strong expansion of human regulatory T cells for adoptive cell therapy results in epigenetic changes which may impact their survival and function. Front. Cell Dev. Biol. 9, 751590 (2021). - PMC - PubMed
    1. Wherry E. J., Kurachi M., Molecular and cellular insights into T cell exhaustion. Nat. Rev. Immunol. 15, 486–499 (2015). - PMC - PubMed
    1. Fribourg M., et al. , T-cell exhaustion correlates with improved outcomes in kidney transplant recipients. Kidney Int. 96, 436–449 (2019). - PMC - PubMed

Publication types

MeSH terms

Substances