. 2024 Feb;80(2):251-267.
doi: 10.1016/j.jhep.2023.02.040. Epub 2023 Mar 25.

Single-cell atlas of the liver myeloid compartment before and after cure of chronic viral hepatitis

Affiliations

Single-cell atlas of the liver myeloid compartment before and after cure of chronic viral hepatitis

Ang Cui et al. J Hepatol. 2024 Feb.

Abstract

Background & aims: Chronic viral infections present serious public health challenges; however, direct-acting antivirals (DAAs) are now able to cure nearly all patients infected with hepatitis C virus (HCV), representing the only cure of a human chronic viral infection to date. DAAs provide a valuable opportunity to study immune pathways in the reversal of chronic immune failures in an in vivo human system.

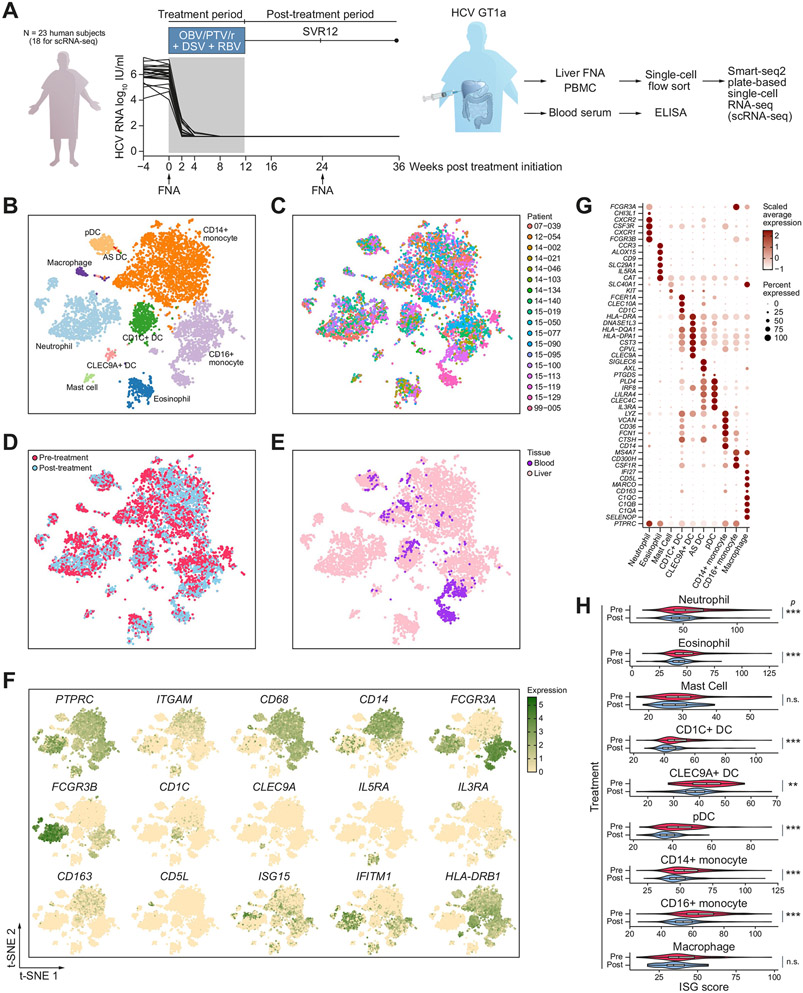
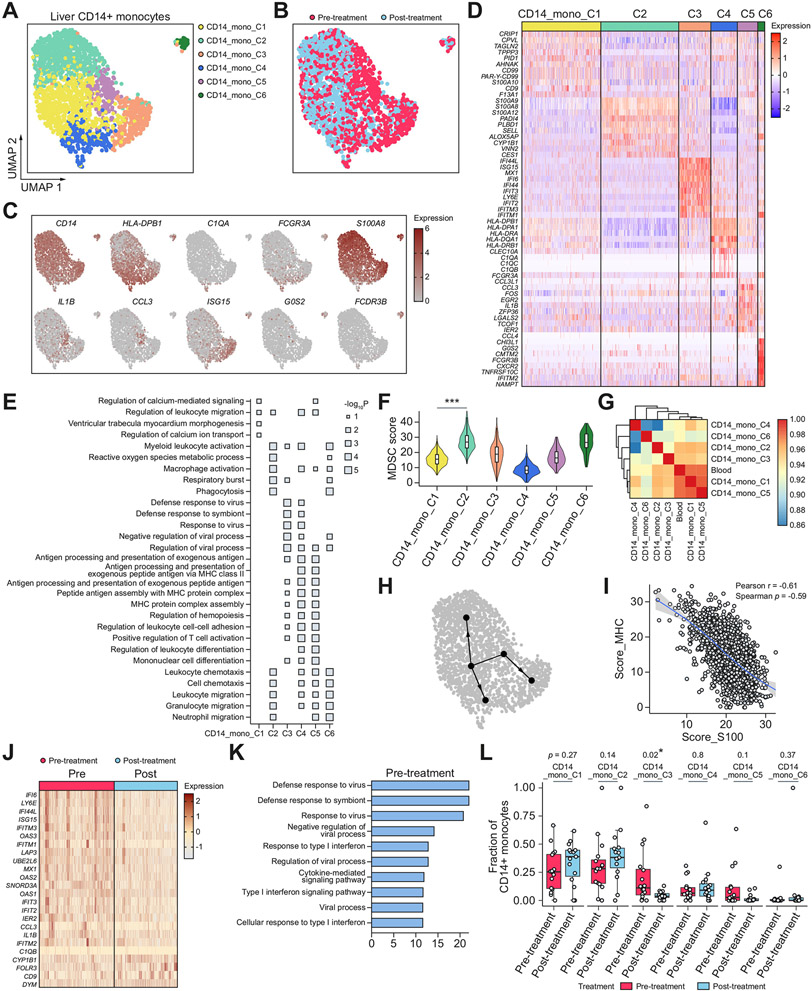
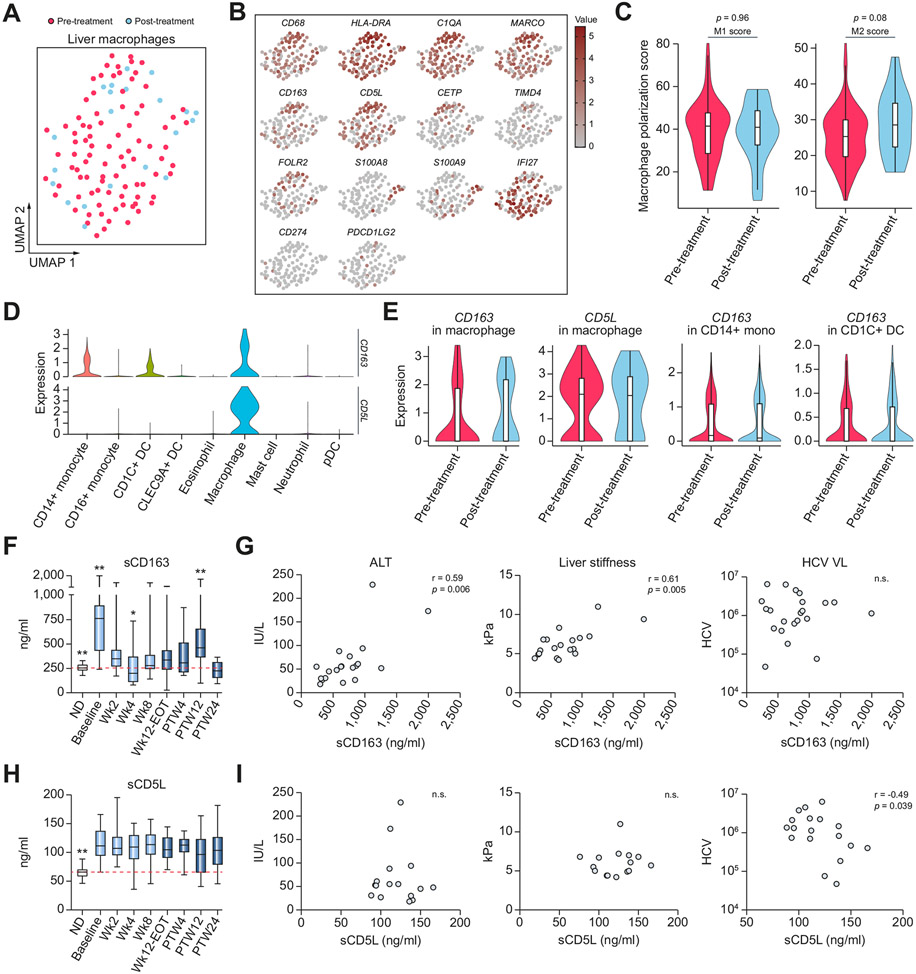
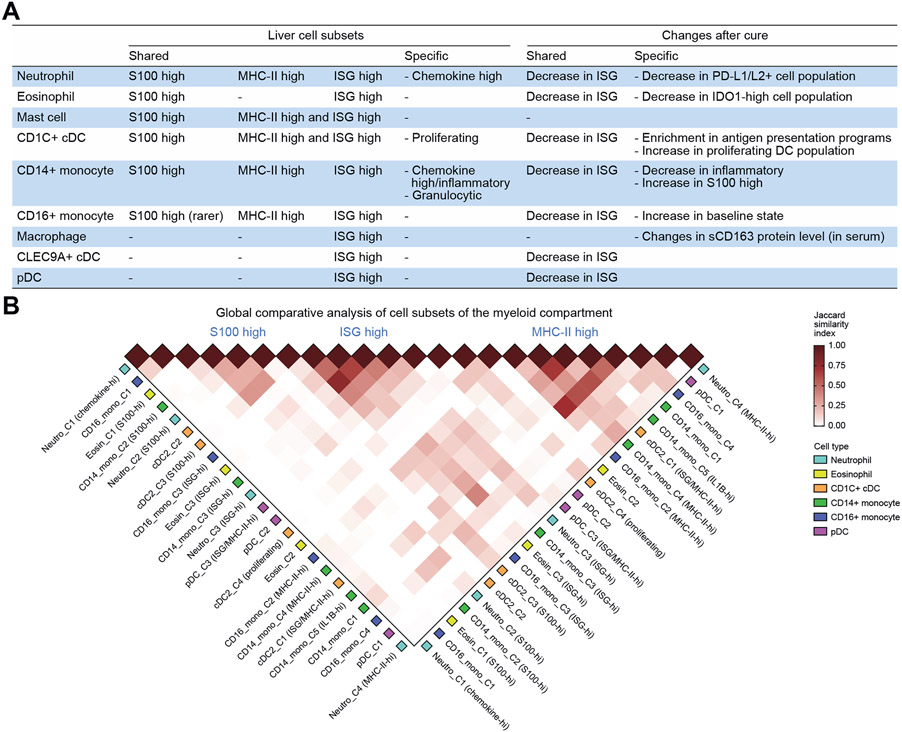
Methods: To leverage this opportunity, we used plate-based single-cell RNA-seq to deeply profile myeloid cells from liver fine needle aspirates in patients with HCV before and after DAA treatment. We comprehensively characterised liver neutrophils, eosinophils, mast cells, conventional dendritic cells, plasmacytoid dendritic cells, classical monocytes, non-classical monocytes, and macrophages, and defined fine-grained subpopulations of several cell types.

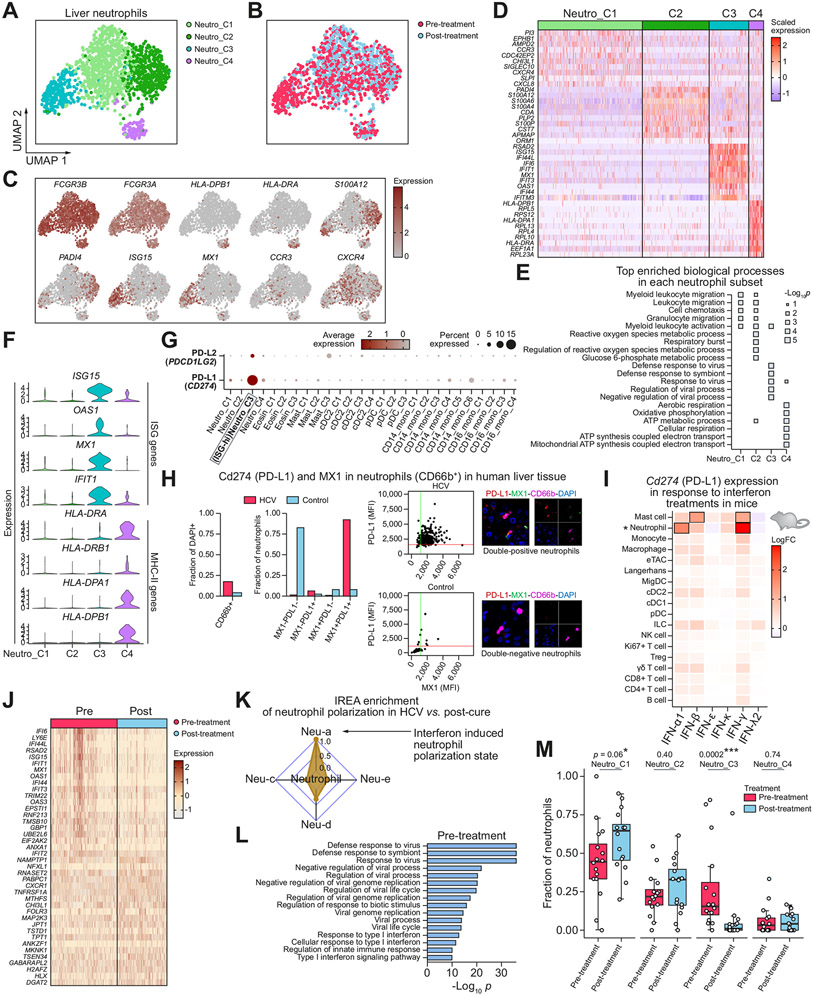
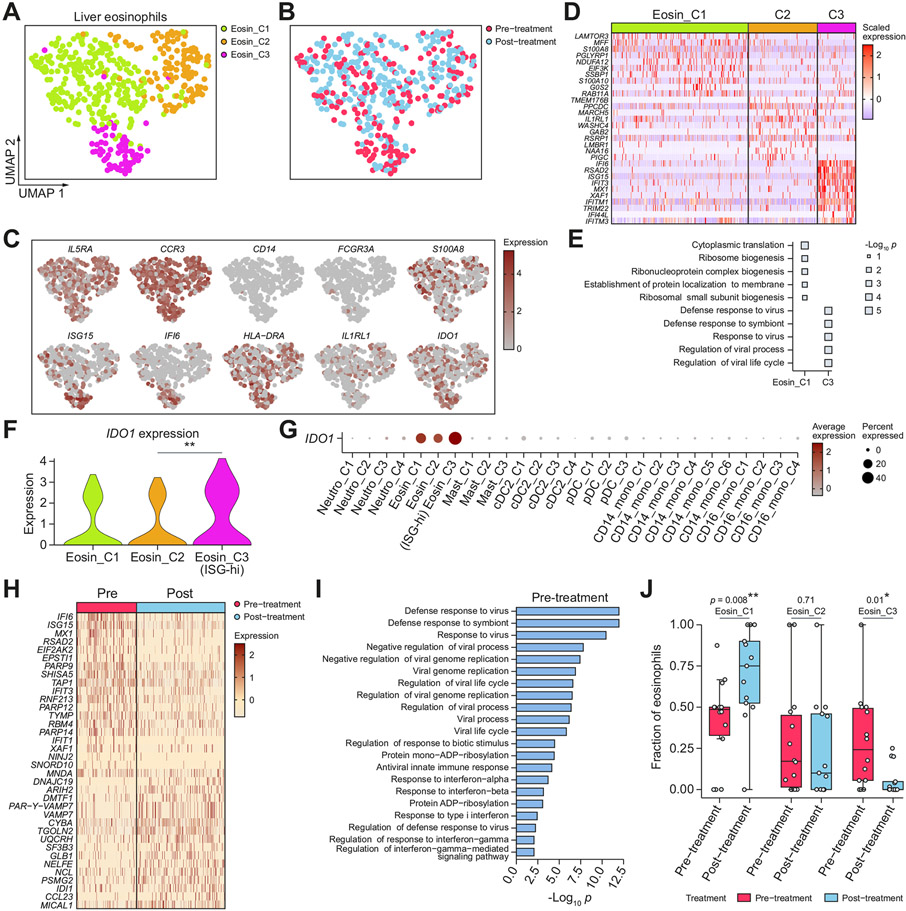
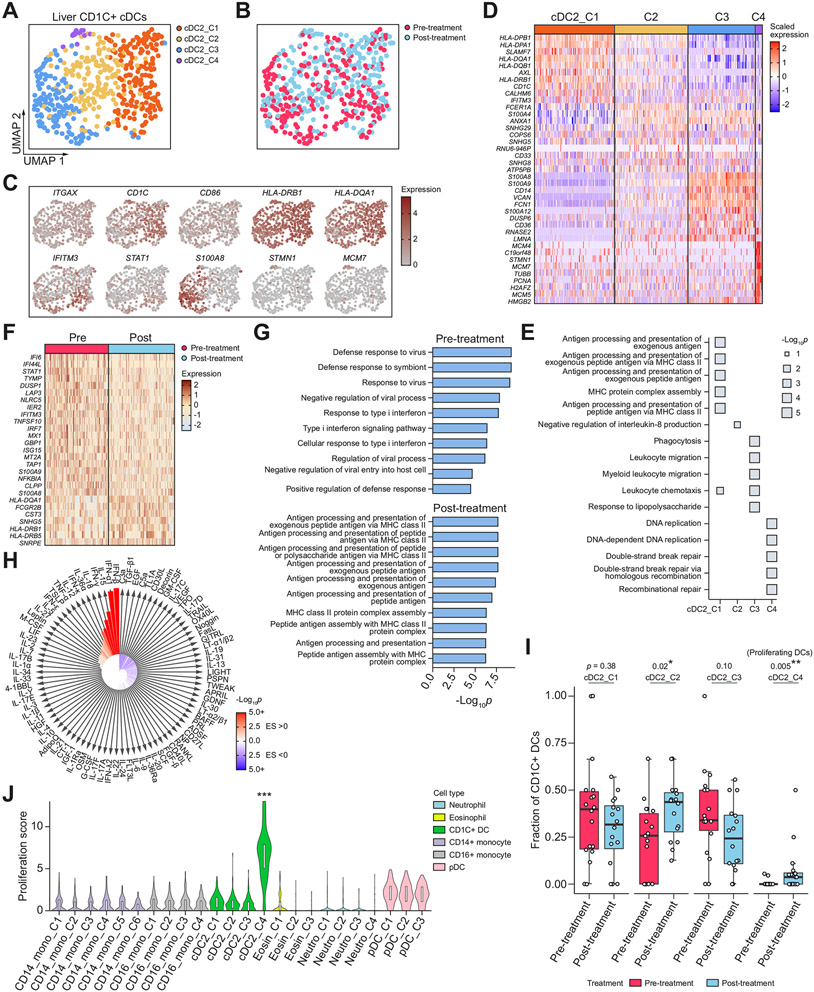
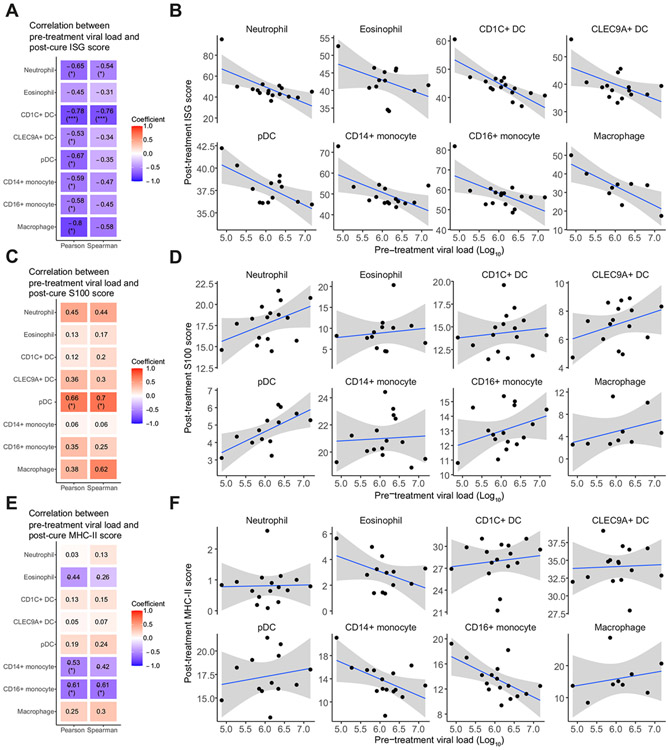
Results: We discovered cell type-specific changes post-cure, including an increase in MCM7+STMN1+ proliferating CD1C+ conventional dendritic cells, which may support restoration from chronic exhaustion. We observed an expected downregulation of interferon-stimulated genes (ISGs) post-cure as well as an unexpected inverse relationship between pre-treatment viral load and post-cure ISG expression in each cell type, revealing a link between viral loads and sustained modifications of the host's immune system. We found an upregulation of PD-L1/L2 gene expression in ISG-high neutrophils and IDO1 expression in eosinophils, pinpointing cell subpopulations crucial for immune regulation. We identified three recurring gene programmes shared by multiple cell types, distilling core functions of the myeloid compartment.

Conclusions: This comprehensive single-cell RNA-seq atlas of human liver myeloid cells in response to cure of chronic viral infections reveals principles of liver immunity and provides immunotherapeutic insights.

Clinical trial registration: This study is registered at ClinicalTrials.gov (NCT02476617).

Impact and implications: Chronic viral liver infections continue to be a major public health problem. Single-cell characterisation of liver immune cells during hepatitis C and post-cure provides unique insights into the architecture of liver immunity contributing to the resolution of the first curable chronic viral infection of humans. Multiple layers of innate immune regulation during chronic infections and persistent immune modifications after cure are revealed. Researchers and clinicians may leverage these findings to develop methods to optimise the post-cure environment for HCV and develop novel therapeutic approaches for other chronic viral infections.

Keywords: Chronic infections; Direct-acting antiviral; Eosinophils; Fine needle aspiration; Hepatitis C virus; Immune cells; Innate immunity; Liver; Myeloid cells; Neutrophils; PD-L1; Single-cell RNA-sequencing; Viral infections.


Conflict of interest statement

Conflicts of interest

AC was a consultant for Foresite Capital and Altimmune Inc. for unrelated work. NH holds equity in BioNTech and is an advisor for Related Sciences/Danger Bio, Repertoire Immune Medicines and CytoReason. RTC received research grants to the institution from Abbvie, Gilead Sciences, Merck, Boehringer, Janssen, and BMS. NA received a research grant to the institution from Boehringer for unrelated work. The remaining authors declare no conflicts of interest that pertain to this work. Please refer to the accompanying ICMJE disclosure forms for further details.

Figures

Fig. 1.
Fig. 1.. Experimental design and single-cell RNA-sequencing of myeloid cells in chronic viral hepatitis and post-DAA-cure.
(A) Experimental design and HCV patient viral load before, during, and after DAA treatment. Patients received 12 weeks of DAA treatment. Liver FNAs and blood were collected before and 24 weeks after the initiation of DAA (12 weeks after the last dose of DAA). Myeloid cells were sorted and scRNA-seq was performed using the plate-based Smart-seq2 scRNA-seqmethod. For comparison, PBMC samples from seven patients were also profiled by scRNA-seq. Key immune cell activation markers were measured longitudinally by ELISA from the 252 Journal patient serum. (B–E) t-SNE maps of single cells colour-coded for (B) cell type, (C) individual patients, (D) pre-vs. post-treatment samples, and (E) liver vs. blood. (F) t-SNE maps coloured by the expression level of cell type and activation markers. (G) Dot plot of expressions of marker genes in each cell type. Shade represents the average expression. Size represents the percentage of cells that express the gene. (H) Violin plot of ISG scores in pre- or post-treatment samples in each cell type. The Wilcoxon rank-sum test was used to determine statistical significance between pre-treatment and post-treatment ISG scores. *p <0.05, **p <0.01, ***p <0.001. n.s., non-significant; DAA, direct-acting antiviral; DC, dendritic cell; FNAs, fine needle aspirates; ISG, interferon-stimulated gene; PBMCs, peripheral blood mononuclear cells; scRNA-seq, single cell RNA sequencing; SVR12, sustained virologic response after 12 weeks post-treatment; t-SNE, t-distributed stochastic neighbour embedding.
Fig. 2.
Fig. 2.. Liver neutrophil subsets and phenotypic changes after DAA-cure.
(A,B) UMAPs of high-quality liver neutrophil cells, coloured by (A) neutrophil subcluster, and (B) treatment status. (C) UMAPs coloured by expression of marker genes. (D) Heatmap showing the overexpressed genes between each subcluster and all other neutrophil subclusters. (E) Pathways enriched for each subcluster. (F) Expressions levels of key ISG and MHC-II genes, showing segregation between ISG-high and MHC-II-high cells. (G) Dot plot showing expression levels of PD-L1 (CD274) and PD-L2 (PDCD1LG2) genes in each cell subcluster, some of which are defined later in the manuscript. (H) Immunofluorescent validation of PD-L1 expression in ISG+ (MX1+) neutrophils in human livers, HCV+ (top) and HCV− control (bottom). Shown as neutrophil fraction of cells, coexpression fraction of neutrophils, and as scatter plots of MFIs for PD-L1 and MX1, as well as composite and individual immunofluorescent channels. (I) Heatmap showing fold change in average expression of PD-L1 gene (CD274) in each immune cell type in response to interferon treatments in vivo in mice. Results are aggregated from three independent mice for each treatment condition. Boxes annotate most significant changes relative to PBS controls (log fold change >1 and FDR <0.01). Neutrophils are marked by *. (J) Heatmap showing the top differentially expressed genes between all pre- and post-treatment neutrophils. (K) IREA analysis shows an enrichment of interferon-mediated neutrophil polarisation state in pre-treatment neutrophils compared to post-treatment. (L) Pathway enrichment of genes overexpressed in pre-treatment neutrophils. (M) Box plot showing the distribution of the fraction of each neutrophil subset in pre- and post-treatment samples across patients. Each dot represents a patient. *p <0.05, **p <0.01, ***p <0.001 (Wilcoxon rank-sum test). DAA, direct-acting antiviral; FDR, false discovery rate; IREA, immune response enrichment analysis; ISG, interferon-stimulated gene; MFIs, mean fluorescent intensities; MHC-II, major histocompatibility complex II; UMAPs, uniform manifold approximation and projections.
Fig. 3.
Fig. 3.. Liver eosinophil subsets and phenotypic changes after DAA-cure.
(A,B) UMAPs of high-quality liver eosinophils cells, coloured by (A) eosinophil subcluster, and (B) treatment status. (C) UMAPs coloured by expression of marker genes. (D) Heatmap showing the overexpressed genes between each subcluster and all other eosinophil subclusters. (E) Pathways enriched for each subcluster. (F) Violin plot showing IDO1 expression across eosinophil subclusters. *p <0.05, **p <0.01, ***p <0.001 (Wilcoxon rank-sum test). (G) IDO1 expression across all myeloid cell subclusters, some of which are defined later in the manuscript. (H) Heatmap showing top differentially expressed genes between all pre- and post-treatment eosinophils. (I) Pathway enrichment of the top overexpressed genes in pre-treatment eosinophils. (J) Box plot showing the distribution of the fraction of each eosinophil cluster in pre- and post-treatment samples across patients. Each dot represents a patient. *p <0.05, **p <0.01, ***p <0.001 (Wilcoxon rank-sum test). DAA, direct-acting antiviral; DC, dendritic cell; pDC, plasmacytoid dendritic cell; UMAPs, uniform manifold approximation and projections.
Fig. 4.
Fig. 4.. Liver CD1C+ conventional dendritic cell subsets and phenotypic changes after DAA-cure.
(A,B) UMAPs of high-quality liver CD1C+ DCs, coloured by (A) CD1C+ DC subcluster, and (B) treatment status. (C) UMAPs coloured by expression of marker genes. (D) Heatmap showing the overexpressed genes between each subcluster and all other CD1C+ DC subclusters. (E) Pathways enriched for each subcluster. (F) Heatmap showing top differentially expressed genes between all preand post-treatment CD1C+ DCs. (G) Pathway enrichment of the top overexpressed genes in pre- and post-treatment CD1C+ DCs. (H) IREA cytokine analysis showing enrichment of cytokine signatures in pre-treatment relative to post-cure. Red indicates an enrichment in pre-treatment; blue indicates an enrichment in post-cure. (I) Box plot showing the distribution of the fraction of each CD1C+ DC subset in pre- and post-treatment samples across patients. Each dot represents a patient. *p <0.05, **p <0.01, ***p <0.001 (Wilcoxon rank-sum test). (J) Violin plot showing distribution of proliferation score of each cell subset across myeloid cell types. ***p <0.001 (Wilcoxon rank-sum test) relative to the reference group (CD14_Mono_C1). DAA, direct-acting antiviral; DCs, dendritic cells; IREA, immune response enrichment analysis; pDC, plasmacytoid dendritic cell; UMAPs, uniform manifold approximation and projections.
Fig. 5.
Fig. 5.. Liver CD14+ monocyte subsets and phenotypic changes after DAA-cure.
(A,B) UMAPs of high-quality liver CD14+ monocytes, coloured by (A) CD14+ monocyte subcluster, and (B) treatment status. (C) UMAPs coloured by expression of marker genes. (D) Heatmap showing the overexpressed genes between each subcluster and all other CD14+ monocyte subclusters. (E) Pathway enrichment of the top overexpressed genes in each subcluster. (F) Violin plot showing M-MDSC scores in each subcluster. ***p <0.001 (Wilcoxon rank-sum test) relative to the reference group (CD14_Mono_C1). (G) Heatmap showing correlation coefficients between transcriptomic profiles of blood CD14+ monocytes and each subcluster of liver CD14+ monocytes. (H) Inferred cell maturation trajectories. (I) Scatter plot showing the relationship between MHC-II score and S100 score. Each dot is an individual cell. Line of best fit and 95% CIs are shown. (J) Heatmap showing top differentially expressed genes between all pre- and post-treatment CD14+ monocytes. (K) Pathway enrichment of the top overexpressed genes in pre-treatment CD14+ monocytes. (L) Box plot showing the distribution of the fraction of each CD14+ monocyte subset in pre- and post-treatment samples across patients. Each dot represents a patient. *p <0.05, **p <0.01, ***p <0.001 (Wilcoxon rank-sum test). DAA, direct-acting antiviral; M-MDSC, monocytic myeloid-derived suppressor cells; UMAPs, uniform manifold approximation and projections.
Fig. 6.
Fig. 6.. Liver macrophage phenotypic changes upon DAA and serum macrophage activation marker dynamics during and after treatment.
(A) UMAP of high-quality liver macrophages, coloured by treatment status. (B) UMAPs coloured by expression of marker genes. (C) Violin plot showing scores of M1-like and M2-like macrophage signatures in pre- or post-treatment samples. Values of p were calculated using the Wilcoxon rank-sum test. (D) Violin plot showing gene expressions of CD163 and CD5L in each liver myeloid cell type. (E) Violin plot showing gene expressions of CD163 and CD5L in pre- or post-treatment samples in each cell type where they are expressed. (F) Box plots showing longitudinal protein expressions of serum sCD163. Baseline was significantly higher than all study timepoints (p <0.009). PTW12 was significantly higher than all study timepoints except baseline and Wk2 (p <0.002). Wk4 was significantly lower than all study timepoints except PTW24 (p <0.03). Normal donors were significantly lower than baseline, Wk2, and PTW12 (p <0.01). *p <0.05, **p <0.01 (Wilcoxon rank-sum test). (G) Scatter plots showing the relationship between sCD163 expression and ALT, liver stiffness, and HCV VL at the pre-treatment baseline. Values of p were obtained from Spearman correlation analysis. (H) Box plots showing longitudinal protein expressions of serum sCD5L. Normal donors were significantly lower than all other study time points (**p <0.01, Wilcoxon rank-sum test). (I) Scatter plots showing the relationship between sCD5L expression and ALT, liver stiffness, and HCV VL at the pre-treatment baseline. Values of p were obtained from Spearman correlation analysis. ALT, alanine transaminase; DAA, direct-acting antiviral; ND, normal donor; PTW12, post-treatment week 12; PTW24, post-treatment week 24; UMAPs, uniform manifold approximation and projections; VL, viral load.
Fig. 7.
Fig. 7.. A global view of cell subsets in the liver myeloid compartment and their changes post-DAA.
(A) A summary of myeloid cell subsets identified in the liver (left) and their changes in response to DAA-induced cure (right). (B) Jaccard similarity index between each pair of myeloid cell subsets across cell types. cDC, conventional dendritic cell; DAA, direct-acting antiviral; ISG, interferon-stimulated gene; MHC-II, major histocompatibility complex II; pDC, plasmacytoid dendritic cell.
Fig. 8.
Fig. 8.. Post-cure ISG expression is inversely related to pre-treatment viral load.
(A,C,E) Pearson and Spearman correlation coefficients between pre-treatment viral load and post-cure gene set scores for (A) ISG genes, (C) S100 genes, and (E) MHC-II genes for each cell type. Colours correspond to correlation coefficients. Statistically significant correlations are marked. *p <0.05, **p <0.01, ***p <0.001. (B,D,F) Scatter plots between pre-treatment viral load and post-cure gene set scores for (B) ISG genes, (D) S100 genes, and (F) MHC-II genes, for each cell type. Line of best fit and 95% confidence interval are shown. DC, dendritic cell; ISG, interferon-stimulated gene; MHC-II, major histocompatibility complex II; pDC, plasmacytoid dendritic cell.

References

    1. Polaris Observatory HCV Collaborators. Global prevalence and genotype distribution of hepatitis C virus infection in 2015: a modelling study. Lancet Gastroenterol Hepatol 2017;2:161–176. - PubMed
    1. Yuen M-F, Chen D-S, Dusheiko GM, Janssen HLA, Lau DTY, Locarnini SA, et al. Hepatitis B virus infection. Nat Rev Dis Primers 2018;4:18035. - PubMed
    1. Martínez I, Ryan P, Valencia J, Resino S. The challenging road to hepatitis C virus eradication. J Clin Med 2021;10:611. - PMC - PubMed
    1. Hill AM, Nath S, Simmons B. The road to elimination of hepatitis C: analysis of cures versus new infections in 91 countries. J Virus Erad 2017;3:117–123. - PMC - PubMed
    1. Zheng M, Tian Z. Liver-mediated adaptive immune tolerance. Front Immunol 2019;10:2525. - PMC - PubMed

Publication types

Substances

Associated data