Meta-Analysis
. 2023 May 16;100(20):e2114-e2124.
doi: 10.1212/WNL.0000000000207156. Epub 2023 Mar 27.

Accelerated Brain Volume Loss Caused by Anti-β-Amyloid Drugs: A Systematic Review and Meta-analysis

Affiliations
Meta-Analysis

Accelerated Brain Volume Loss Caused by Anti-β-Amyloid Drugs: A Systematic Review and Meta-analysis

Francesca Alves et al. Neurology. .

Abstract

Background and objectives: To evaluate brain volume changes caused by different subclasses of anti-β-amyloid (Aβ) drugs trailed in patients with Alzheimer disease.

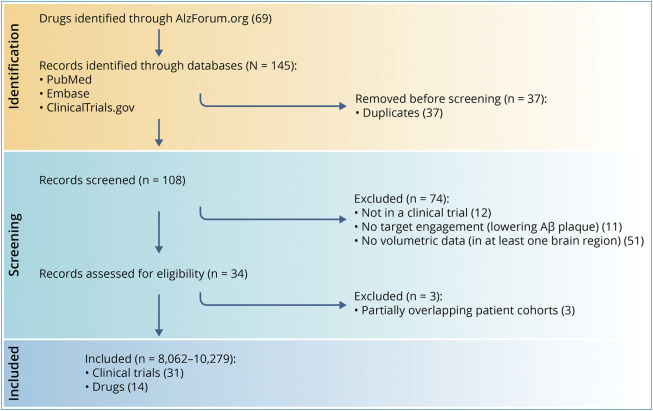
Methods: PubMed, Embase, and ClinicalTrials.gov databases were searched for clinical trials of anti-Aβ drugs. This systematic review and meta-analysis included adults enrolled in randomized controlled trials of anti-Aβ drugs (n = 8,062-10,279). The inclusion criteria were as follows: (1) randomized controlled trials of patients treated with anti-Aβ drugs that have demonstrated to favorably change at least one biomarker of pathologic Aβ and (2) detailed MRI data sufficient to assess the volumetric changes in at least one brain region. MRI brain volumes were used as the primary outcome measure; brain regions commonly reported include hippocampus, lateral ventricle, and whole brain. Amyloid-related imaging abnormalities (ARIAs) were investigated when reported in clinical trials. Of the 145 trials reviewed, 31 were included in the final analyses.

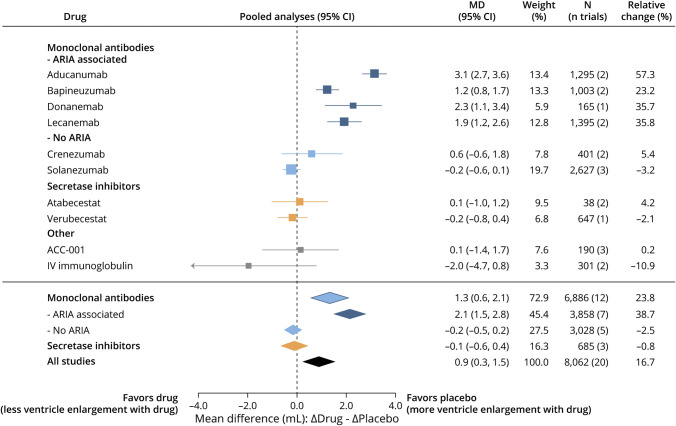
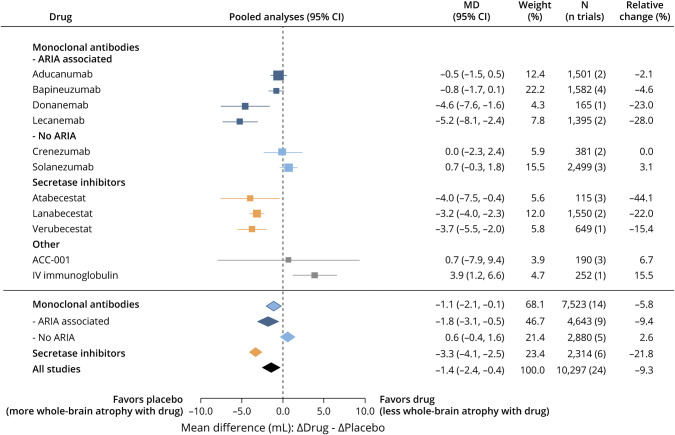
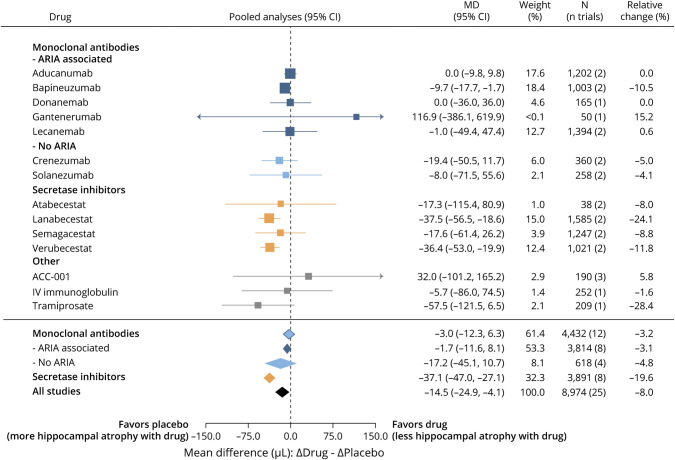
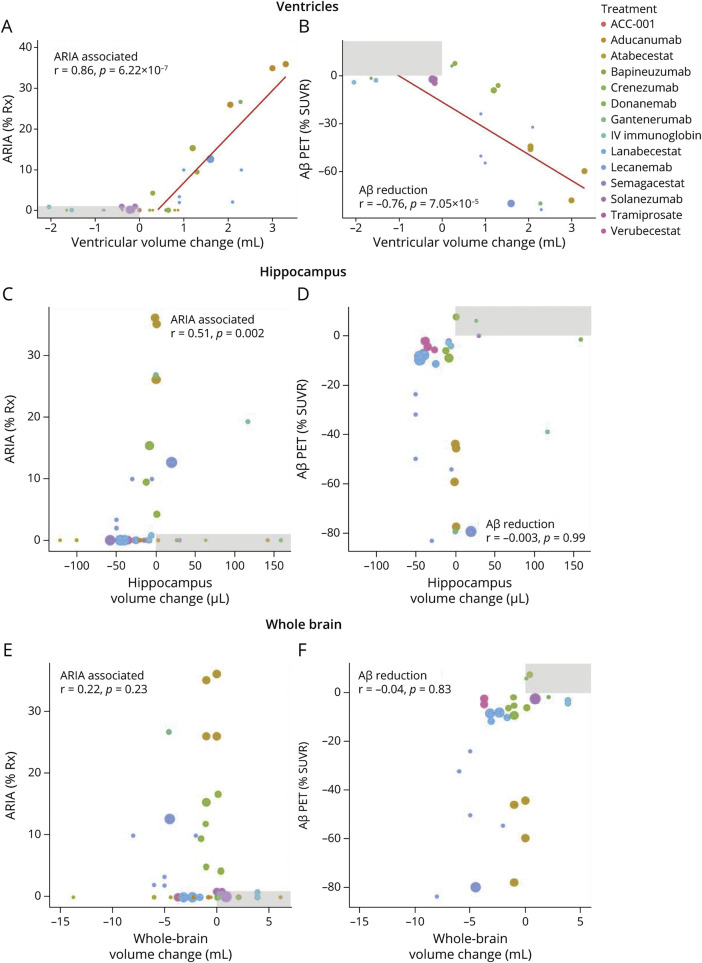
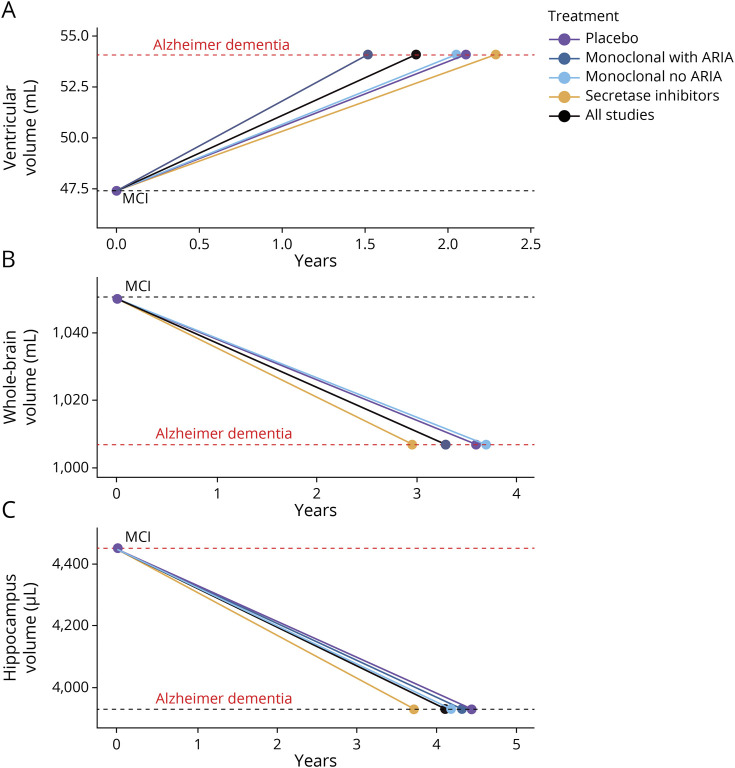
Results: A meta-analysis on the highest dose of each trial on hippocampus, ventricle, and whole brain revealed drug-induced acceleration of volume changes that varied by anti-Aβ drug class. Secretase inhibitors accelerated atrophy to the hippocampus (Δ placebo - Δ drug: -37.1 µL [19.6% more than placebo]; 95% CI -47.0 to -27.1) and whole brain (Δ placebo - Δ drug: -3.3 mL [21.8% more than placebo]; 95% CI -4.1 to 2.5). Conversely, ARIA-inducing monoclonal antibodies accelerated ventricular enlargement (Δ placebo - Δ drug: +2.1 mL [38.7% more than placebo]; 95% CI 1.5-2.8) where a striking correlation between ventricular volume and ARIA frequency was observed (r = 0.86, p = 6.22 × 10⁻⁷). Mild cognitively impaired participants treated with anti-Aβ drugs were projected to have a material regression toward brain volumes typical of Alzheimer dementia ∼8 months earlier than if they were untreated.

Discussion: These findings reveal the potential for anti-Aβ therapies to compromise long-term brain health by accelerating brain atrophy and provide new insight into the adverse impact of ARIA. Six recommendations emerge from these findings.


Conflict of interest statement

F. Alves and P. Kalinowski declare support from the NIH National Institute on Aging for the submitted work. S. Ayton declares support from the NIH National Institute on Aging for the submitted work and reports acting as a consultant for Eisai in the past 3 years; no other relationships or activities that could appear to have influenced the submitted work. Go to Neurology.org/N for full disclosures.

Figures

Figure 1
Figure 1. Flowchart of Trial Exclusions and Inclusions
Aβ = β-amyloid. Created with Biorender.com.
Figure 2
Figure 2. Effect of Anti-Aβ Drugs on Lateral Ventricular Enlargement
Summary data from the highest dose of all drug trials for each drug. N includes placebo and high-dose groups from each study. Aβ = β-amyloid; ARIA = amyloid-related imaging abnormality; CI: 95% confidence interval; MD = mean difference; Relative change (%): the mean difference between volume changes in drug and placebo as a ratio to the change in placebo.
Figure 3
Figure 3. Effect of Anti-Aβ Drugs on Whole-Brain Atrophy
Summary data from the highest dose of all drug trials for each drug. N includes placebo and high-dose groups from each study. Aβ = β-amyloid; ARIA = amyloid-related imaging abnormality; CI: 95% confidence interval; MD = mean difference; Relative change (%): the mean difference between volume changes in drug and placebo as a ratio to the change in placebo.
Figure 4
Figure 4. Effect of Anti-Aβ Drugs on Hippocampal Atrophy
Summary data from the highest dose of all drug trials for each drug. N includes placebo and high-dose groups from each study. Aβ = β-amyloid; ARIA = amyloid-related imaging abnormality; CI: 95% confidence interval; MD = mean difference; Relative change (%): the mean difference between volume changes in drug and placebo as a ratio to the change in placebo.
Figure 5
Figure 5. Association of Volume Change With ARIA and Amyloid Reduction
Data from all trials of anti-Aβ drugs and doses were used to investigate correlations between brain volumetric changes and ARIA frequency or Aβ reduction measured by PET (SUVR % change relative to baseline). For analysis focused on ARIA, we excluded trials (shaded in gray) where no acceleration of volume changes was observed and increased ARIA was also neither reported nor detected (since it is not possible that ARIA could decrease volume changes). For analysis focused on plaque, we excluded trials (shaded in gray) where no acceleration of volume changes was observed and decreased plaque was also observed (since it is not possible that decreased plaque could decrease volume changes). A series of Pearson regressions were performed between ventricular enlargement and ARIA (A), ventricular enlargement and Aβ plaque reduction (B), hippocampus atrophy and ARIA (C), hippocampus atrophy and Aβ plaque reduction (D), whole-brain atrophy and ARIA (E), and whole-brain atrophy and Aβ plaque reduction (F). Bubble size represents sample size of drug-treated arm. Aβ = β-amyloid; ARIA = amyloid-related imaging abnormality; SUVR = standardized uptake value ratio.
Figure 6
Figure 6. Modeling of Volume Changes
The projected influence of anti-Aβ drug classes on the volume changes of (A) ventricle, (B) hippocampus, and (C) whole-brain atrophy that occur between MCI and Alzheimer dementia (obtained from reference 20). The placebo (purple) is an average rate of volumetric change in participants with MCI. The projected rate of volume change induced by pooled monoclonal antibodies with ARIA (dark blue), monoclonal antibodies with no ARIA (light blue), secretase inhibitors (orange), and all drugs (black) used the percentage difference on placebo derived from forest plots (Figures 2–4). Aβ = β-amyloid; ARIA = amyloid-related imaging abnormality; MCI = mild cognitive impairment.

Comment in

References

    1. Ackley SF, Zimmerman SC, Brenowitz WD, et al. . Effect of reductions in amyloid levels on cognitive change in randomized trials: instrumental variable meta-analysis. BMJ. 2021;372:n156. - PMC - PubMed
    1. Haass C, Selkoe D. If amyloid drives Alzheimer disease, why have anti-amyloid therapies not yet slowed cognitive decline? PLoS Biol. 2022;20(7):e3001694. - PMC - PubMed
    1. van Dyck CH, Swanson CJ, Aisen P, et al. . Lecanemab in early Alzheimer's disease. N Engl J Med. 2023;388(1):9-21. - PubMed
    1. Salloway S, Chalkias S, Barkhof F, et al. . Amyloid-related imaging abnormalities in 2 phase 3 studies evaluating aducanumab in patients with early Alzheimer disease. JAMA Neurol. 2022;79(1):13-21. - PMC - PubMed
    1. Budd Haeberlein S, Aisen PS, Barkhof F, et al. . Two randomized phase 3 studies of aducanumab in early Alzheimer's disease. J Prev Alzheimers Dis. 2022;9(2):197-210. - PubMed

Substances