. 2023 Mar 27;14(1):1679.
doi: 10.1038/s41467-023-36960-9.

Deep learning-enabled segmentation of ambiguous bioimages with deepflash2

Affiliations

Deep learning-enabled segmentation of ambiguous bioimages with deepflash2

Matthias Griebel et al. Nat Commun. .

Abstract

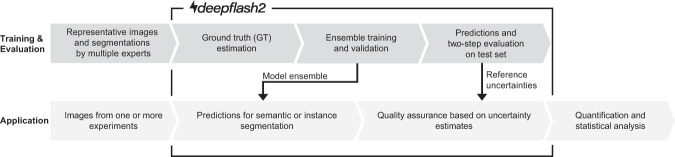
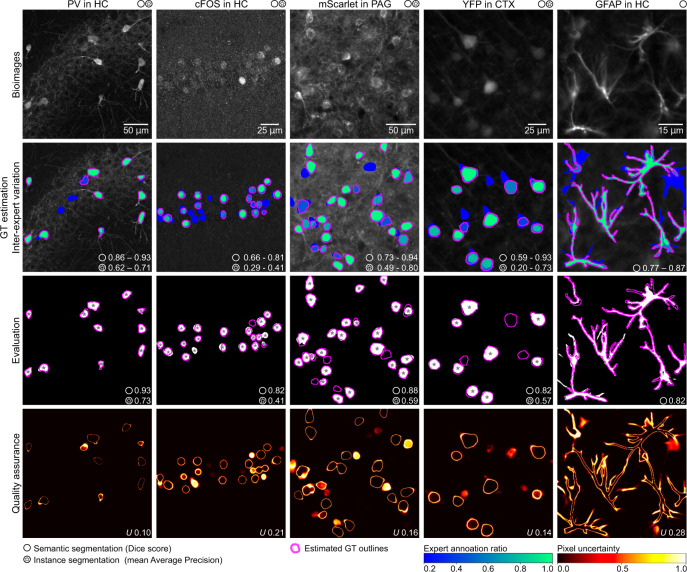
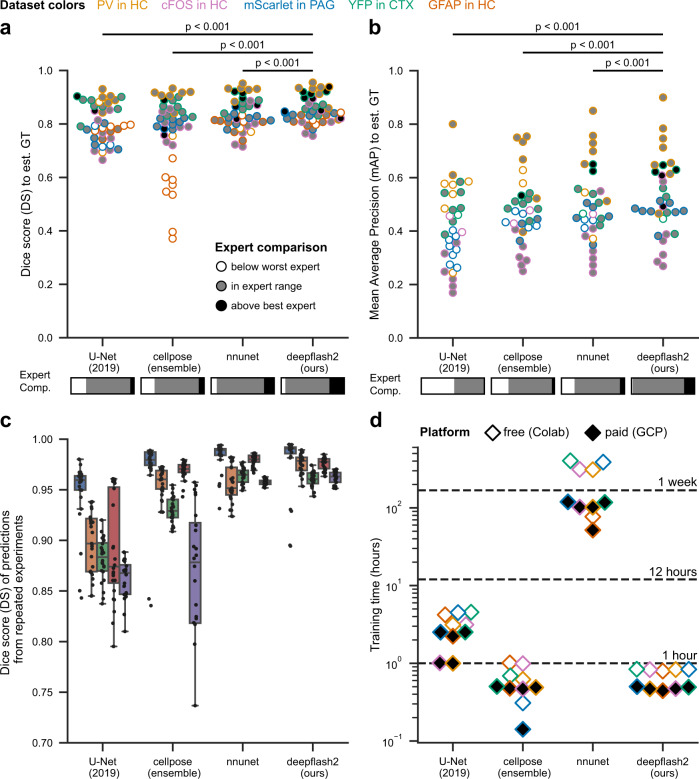
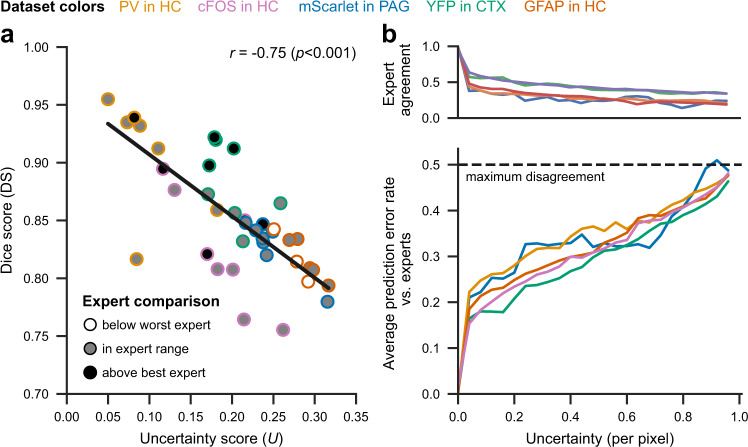
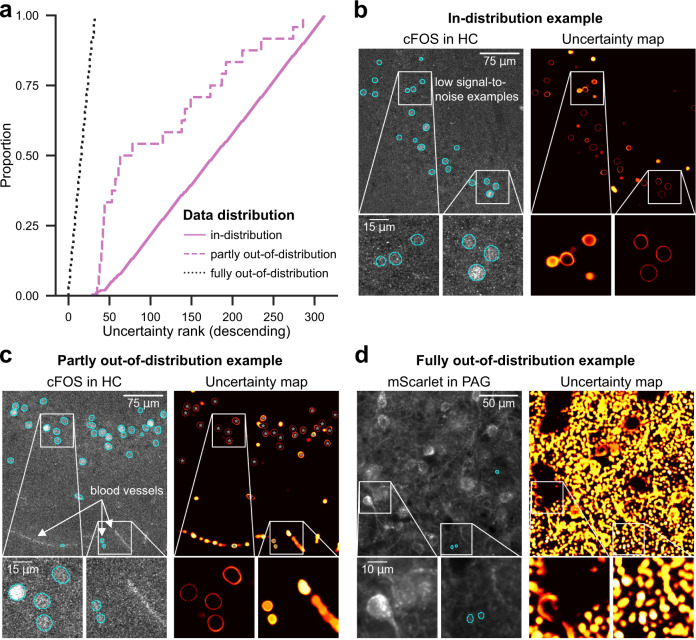
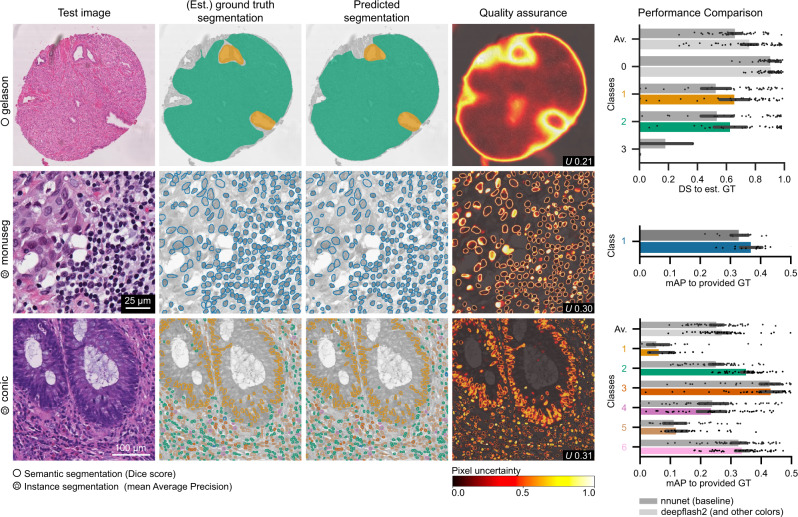
Bioimages frequently exhibit low signal-to-noise ratios due to experimental conditions, specimen characteristics, and imaging trade-offs. Reliable segmentation of such ambiguous images is difficult and laborious. Here we introduce deepflash2, a deep learning-enabled segmentation tool for bioimage analysis. The tool addresses typical challenges that may arise during the training, evaluation, and application of deep learning models on ambiguous data. The tool's training and evaluation pipeline uses multiple expert annotations and deep model ensembles to achieve accurate results. The application pipeline supports various use-cases for expert annotations and includes a quality assurance mechanism in the form of uncertainty measures. Benchmarked against other tools, deepflash2 offers both high predictive accuracy and efficient computational resource usage. The tool is built upon established deep learning libraries and enables sharing of trained model ensembles with the research community. deepflash2 aims to simplify the integration of deep learning into bioimage analysis projects while improving accuracy and reliability.


Conflict of interest statement

The authors declare no competing interests.

Figures

Fig. 1
Fig. 1. deepflash2 pipelines.
Proposed integration of deepflash2 into the bioimage analysis workflow. In contrast to traditional DL pipelines, deepflash2 integrates annotations from multiple experts and relies on model ensembles for training and evaluation. Additionally, the application pipeline facilitates quality monitoring and out-of-distribution detection for predictions on new data.
Fig. 2
Fig. 2. Exemplary results on different immunofluorescence images.
Representative image sections from the test sets of five immunofluorescence imaging datasets (first row) with corresponding expert annotations and ground truth (GT) estimation (second row). The inter-expert variation is indicated with ranges (lowest and highest expert similarity to the estimated GT) of the Dice score (DS) for semantic segmentation and mean Average Precision (mAP) for instance segmentation. The predicted segmentations and the similarity to the estimated GT are depicted in the third row, and the corresponding uncertainty maps and uncertainty scores U for quality assurance are in the fourth row. Areas with a low expert agreement (blue) or differences between the predicted segmentation and the estimated GT typically exhibit high uncertainties. deepflash2 also provides instance (e.g., somata or nuclei)-based uncertainty measures that are not depicted here. The maximum pixel uncertainty has a theoretical limit of 1.
Fig. 3
Fig. 3. Evaluation of predictive performance, relative performance, reliability, and speed on different immunofluorescence datasets.
a, b Predictive performance on the test sets for a semantic segmentation (N = 40, 8 images for each dataset) and b instance segmentation (N = 32, 8 images for each depicted dataset except GFAP in HC), measured by similarity to the estimated GT. The grayscale filling depicts the comparison against the expert annotation scores. The p-values result from a two-sided Wilcoxon signed-rank test (semantic segmentation: p = 0.000170298 for nnunet, p = 0.000001405 for cellpose, p = 0.000000001 for U-Net (2019); instance segmentation: p = 0.000090546 for nnunet, p = 0.000557802 for cellpose, p = 0.000000012 for U-Net (2019)). The expert comparison bars below the method names indicate the share of test instances that scored below the worst expert (white), in expert range (gray), or above the best expert (black). c Similarity of the predicted test segmentation masks for three repeated training runs with different training-validation splits (N = 40, 8 images for each dataset). Box plots are defined as follows: the box extends from the first quartile (lower bound of the box) to the third quartile (upper bound of the box) of the data, with a center line at the median. The whiskers extend from the box by at most 1.5x the interquartile range and are drawn down to the lowest and up to the highest data point that falls within this distance. d Training speed (duration) on different platforms: Google Colaboratory (Colab, gratuitous Nvidia Tesla T4 GPU) and Google Cloud Platform (GPC, costly Nvidia A100 GPU). Source data are provided as a Source Data file.
Fig. 4
Fig. 4. Relationship between expert annotations, uncertainty, and similarity scores.
a Correlation between Dice scores and uncertainties on the test set. We quantify the linear correlation using Pearson’s r and a two-tailed p-value (p = 0.00000002) for testing non-correlation. The grayscale filling depicts the comparison against the expert annotation scores. b Relationship between pixel-wise uncertainty and expert agreement (at least one expert with differing annotation; upper plot) and average prediction error rate (relative frequency of deviations between different expert segmentations and the predicted segmentation; lower plot) on the test set. Source data are provided as a Source Data file.
Fig. 5
Fig. 5. Out-of-distribution detection.
a Out-of-distribution (ood) detection performance using heuristic ranking via uncertainty score. Starting the manual verification of the predictions at the lowest rank, all images with deviant fluorescence labels (fully ood, N = 32 images) are detected first. The partly ood images with previously unseen structures (N = 24) are mostly located in the lower ranks, and the in-distribution images (similar to training data of cFOS in HC, N = 264) are in the upper ranks. bd Representative image crops of the three categories used in (a). Source data are provided as a Source Data file.
Fig. 6
Fig. 6. Demonstration on challenge datasets gleason, monuseg, conic.
Exemplary test image slices (first column), corresponding GT segmentations (second column), predicted segmentations (third column), and uncertainty maps (fourth column) with uncertainty scores U. GT segmentations for the gleason dataset were estimated via STAPLE. The bar plots in the last column summarize the results over the entire test sets by class for semantic segmentation (gleason, N = 49 test images) and instance segmentation (monuseg N = 15 test images, conic N = 48 test images). The color codes in the y-axis labels and bars of the bar charts indicate the different class numbers in the segmentation masks (first and second row). We additionally report the average score across all classes (Av.) in multiclass settings. The error bars depict the 95% confidence interval of the observations estimated via bootstrapping around the arithmetic mean (center). Source data are provided as a Source Data file.

References

    1. Meijering E. A bird’s-eye view of deep learning in bioimage analysis. Comput. Struct. Biotechnol. J. 2020;18:2312. doi: 10.1016/j.csbj.2020.08.003. - DOI - PMC - PubMed
    1. Falk T, et al. U-Net: deep learning for cell counting, detection, and morphometry. Nat. Methods. 2019;16:67–70. doi: 10.1038/s41592-018-0261-2. - DOI - PubMed
    1. Ronneberger, O., Fischer, P. & Brox, T. U-Net: convolutional networks for biomedical image segmentation. Med. Image Comput. Comput. Assist. Interv.9351, 234–241 (2015).
    1. Haberl MG, et al. Cdeep3m-plug-and-play cloud-based deep learning for image segmentation. Nat. Methods. 2018;15:677–680. doi: 10.1038/s41592-018-0106-z. - DOI - PMC - PubMed
    1. Berg S, et al. Ilastik: interactive machine learning for (bio) image analysis. Nat. Methods. 2019;16:1226–1232. doi: 10.1038/s41592-019-0582-9. - DOI - PubMed

Publication types

MeSH terms