. 2023 Mar 27;14(1):1680.
doi: 10.1038/s41467-023-37379-y.

Single cell analysis in head and neck cancer reveals potential immune evasion mechanisms during early metastasis

Affiliations

Single cell analysis in head and neck cancer reveals potential immune evasion mechanisms during early metastasis

Hong Sheng Quah et al. Nat Commun. .

Abstract

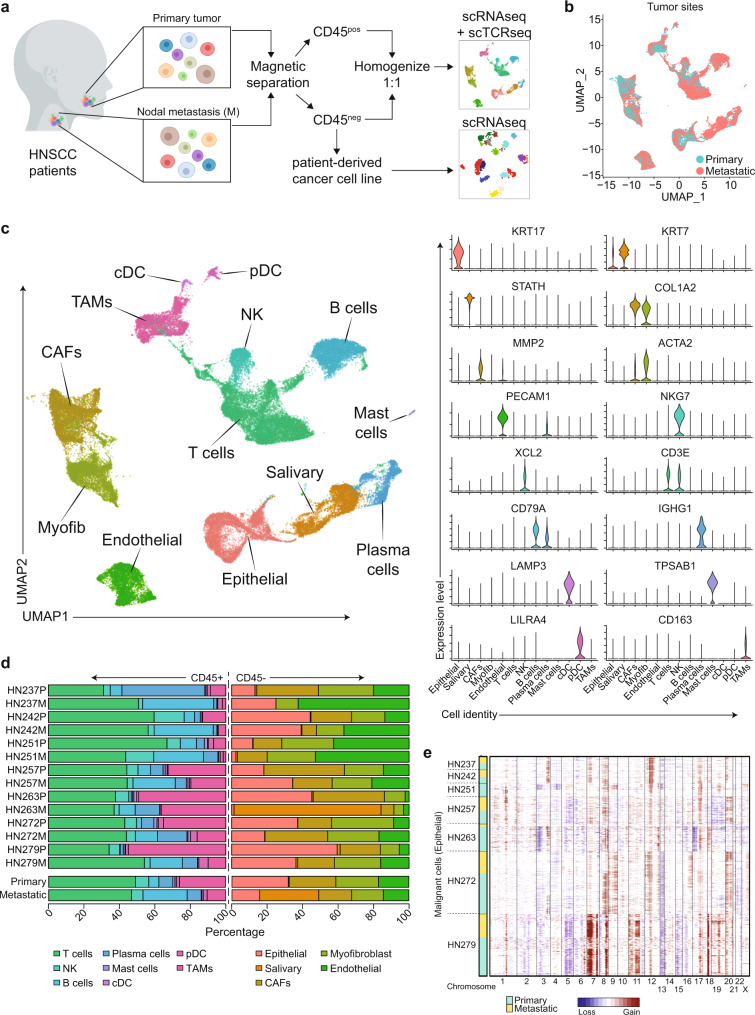
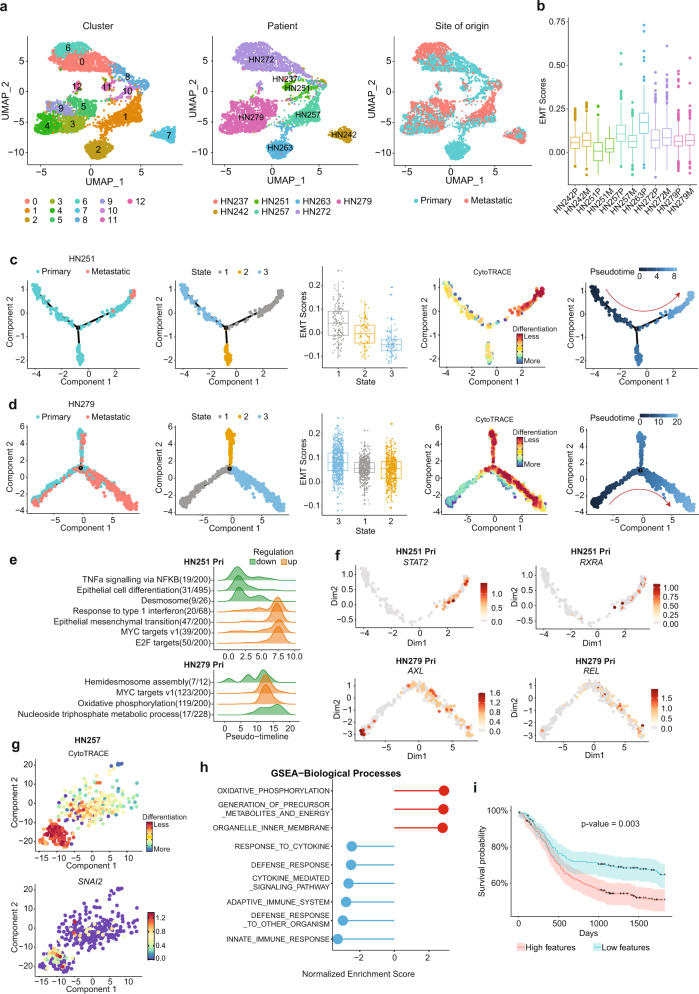
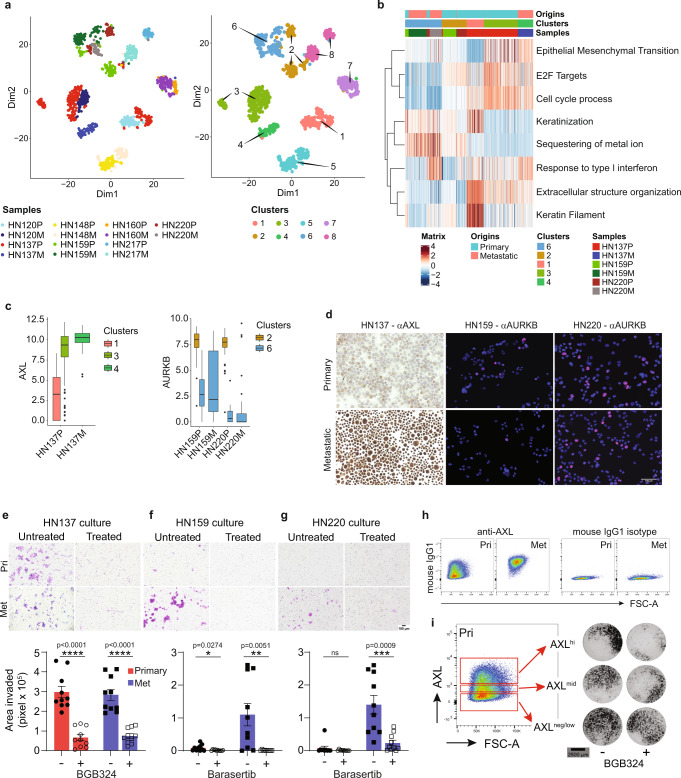
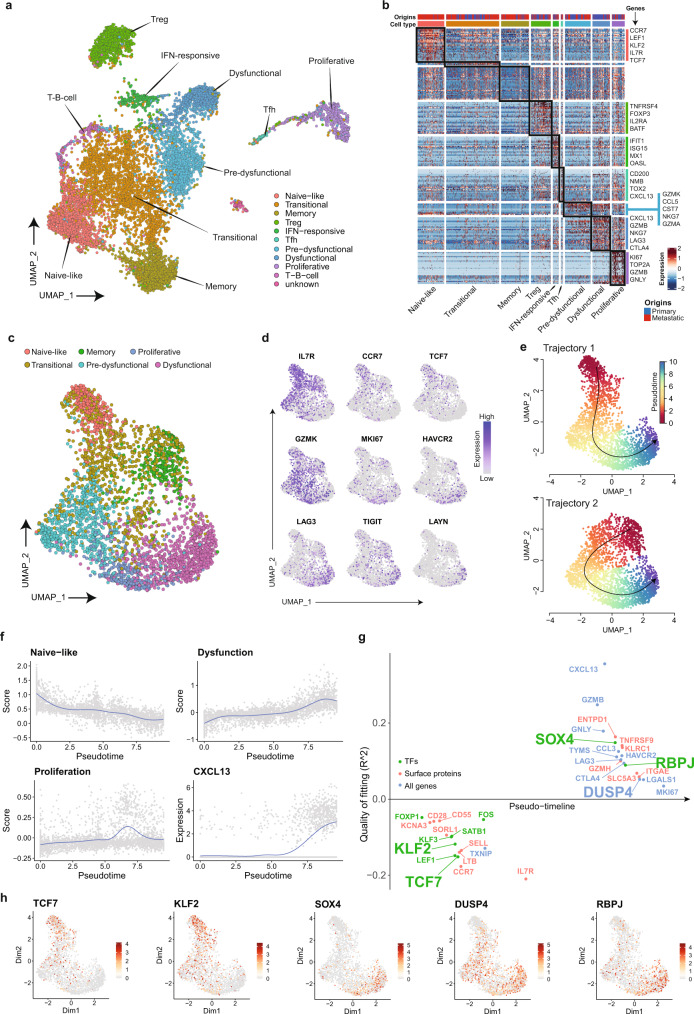
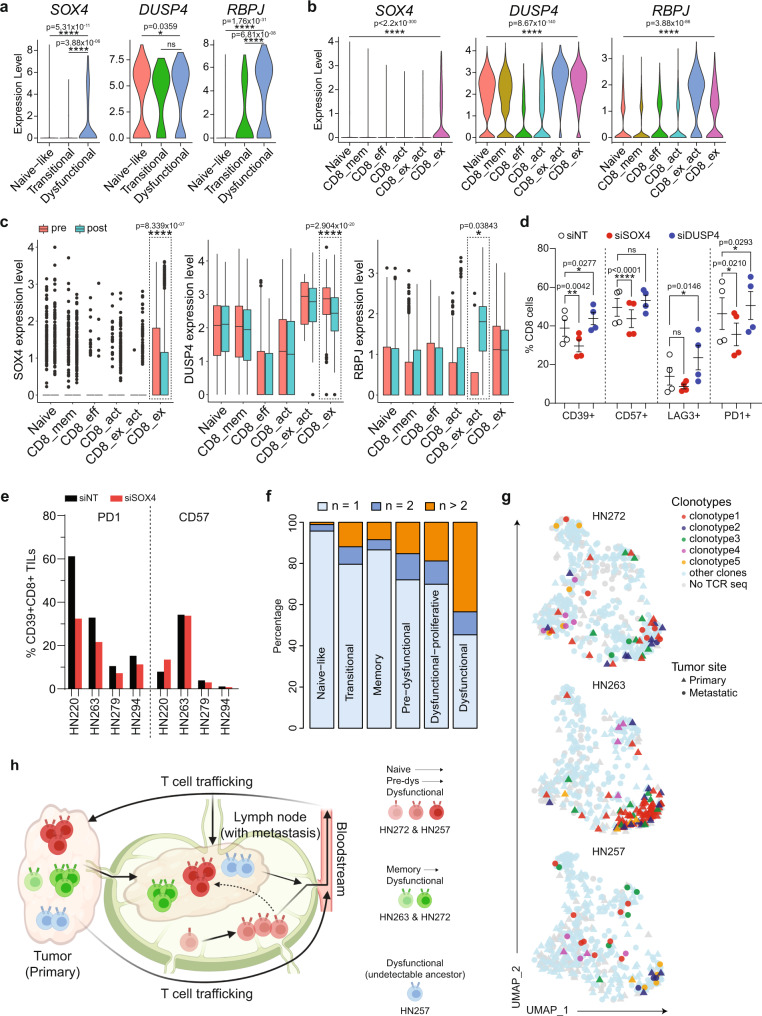
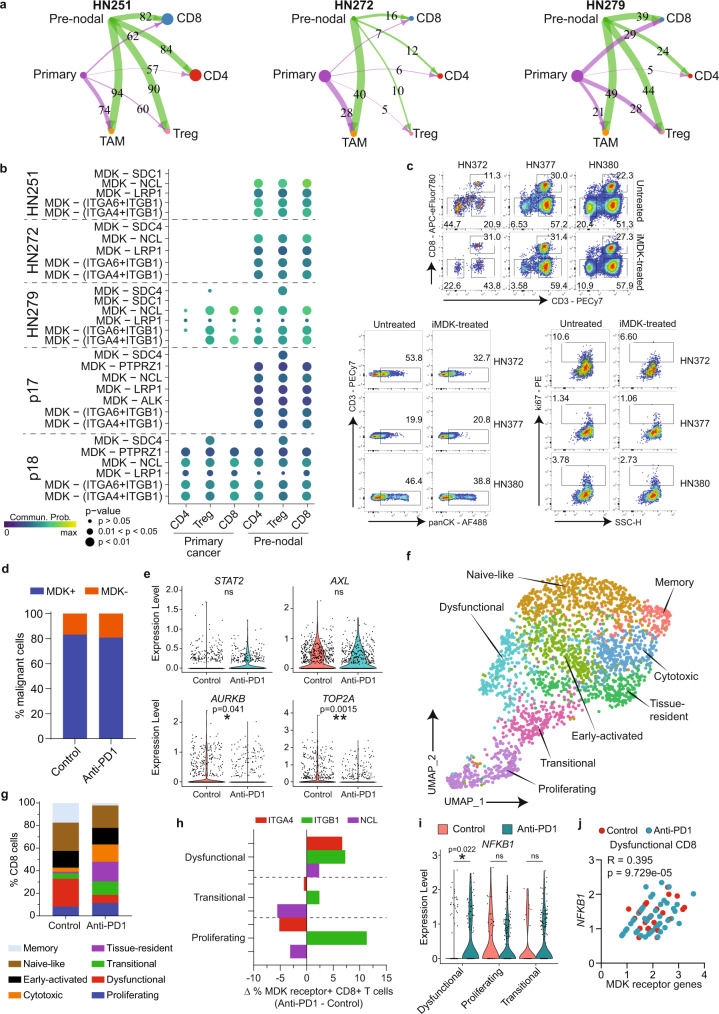
Profiling tumors at single-cell resolution provides an opportunity to understand complexities underpinning lymph-node metastases in head and neck squamous-cell carcinoma. Single-cell RNAseq (scRNAseq) analysis of cancer-cell trajectories identifies a subpopulation of pre-metastatic cells, driven by actionable pathways including AXL and AURK. Blocking these two proteins blunts tumor invasion in patient-derived cultures. Furthermore, scRNAseq analyses of tumor-infiltrating CD8 + T-lymphocytes show two distinct trajectories to T-cell dysfunction, corroborated by their clonal architecture based on single-cell T-cell receptor sequencing. By determining key modulators of these trajectories, followed by validation using external datasets and functional experiments, we uncover a role for SOX4 in mediating T-cell exhaustion. Finally, interactome analyses between pre-metastatic tumor cells and CD8 + T-lymphocytes uncover a putative role for the Midkine pathway in immune-modulation and this is confirmed by scRNAseq of tumors from humanized mice. Aside from specific findings, this study demonstrates the importance of tumor heterogeneity analyses in identifying key vulnerabilities during early metastasis.


Conflict of interest statement

NGI has/had a consulting or advisory role in PairX Therapeutics and Invitrocue PLC, and received honoraria from Kalbe Biotech and Agilent, all of which are outside this submitted work. DSWT received honoraria from Bristol-Myers Squibb, Takeda Pharmaceuticals, Novartis, Roche, and Pfizer; and has consulting or advisory role in Novartis, Merck, Loxo Oncology, AstraZeneca, Roche, and Pfizer. DSWT also received research funding from Novartis (Inst), GlaxoSmithKline (Inst), and AstraZeneca (Inst), outside this submitted work. None of the remaining authors have any other conflicts to report.

Figures

Fig. 1
Fig. 1. Tumor samples for single-cell RNAseq.
a Workflow of sample acquisition, processing, and analyses for single-cell transcriptome and TCR clonality of tumors (and patient-derived cultures) from primary and metastatic lymph nodes of HNSCC patients. Diagram was created with BioRender.com. b Uniform manifold approximation and projection (UMAP) of scRNAseq from all 53,459 cells separated by primary tumors and metastatic lymph nodes from 7 patients. c UMAP of scRNAseq data of all cells from 7 patients with clusters denoted by colors and labeled according to inferred cell types. Violin plots show the expression of selected genes used to define the inferred cell types. d Distribution of different cell types (color), categorized by CD45+ or CD45−, for each patient sample (upper) and comparing primary and metastatic samples (lower) as indicated on the y-axis. e Chromosomal gains and losses prediction for malignant epithelial cells by inferCNV using non-malignant cells from respective samples as controls. Cyan indicates primary malignant epithelial; yellow indicates lymph-node malignant epithelial; sample identities on the y-axis, chromosome numbers on the x-axis.
Fig. 2
Fig. 2. scRNAseq analysis of malignant epithelial cells and identification of pre-metastatic sub-population.
a UMAP of 6115 malignant epithelial cells only, clustered by Seurat clusters (left), patients (middle), and tissue origin (primary/metastatic) (right). b Turkey boxplot showing epithelial–mesenchymal transition (EMT) scores across patients and tissue origin (primary versus metastasis). N = 6115 cells. c, d Monocle plots demonstrating the derivation of pre-metastatic populations in HN251 (n = 304 cells) and HN279 (n = 1764 cells), (c, d) respectively, based on (from left to right) tissue origin, monocle clusters, EMT scores, CytoTRACE scores to derive trajectory. e Gene ontology pathways that are significantly altered across pseudotime derived in (c, d). f Potentially actionable genes identified to be increased in pre-metastatic population in primary tumors cells of HN251 (upper, n = 228 cells) and HN279 (lower, n = 659 cells). g t-SNE plot of tumor cells in HN257 showing a highly aggressive sub-population in the primary tumor with high CytoTRACE scores and expression of SNAI2. N = 403 cells. h Geneset enrichment analysis (GSEA) showing normalized enrichment scores, and (i) Kaplan-Meier plot of TCGA data showing survival probability (%) over days in patients with high (red) versus low (blue) scores or features based on genes expressed by the specific subpopulation in (g). Shaded area shows 95% confidence interval of the centered median survival time and p value as indicated based on log-rank test. Boxplots in (b, c, d) centered at the median with hinges at 1st and 3rd quartiles and whiskers drawn from hinges to the lowest and highest points within 1.5 interquartile range.
Fig. 3
Fig. 3. Functional analysis of actionable genes enriched in pre-metastatic population in patient-derived cultures (PDCs).
a Dimension reduction plots based on PAGODA for PDCs derived from matched primary and metastatic lymph nodes (nodal metastatic; M). Clusters are denoted by patient identity and site of origin (left), and Seurat clusters (right). N = 1317 cells. b Heatmap of differentially expressed pathways (rows) across samples and tumor origin (columns), showing selected Hallmark and Gene Ontology (GO) gene sets. Bars on the top of the heat map indicate the site of sample origins, clusters and patient samples corresponding to those of (a). c Boxplot showing the gene expression level of AXL (left, n = 353 cells) and AURKB (right, n = 318 cells) of malignant cells from primary and metastatic PDCs for the indicated patients. Boxplots centered at the median with hinges at 1st and 3rd quartiles and whiskers drawn from hinges to the lowest and highest points within 1.5 interquartile range; colors and cluster numbers of the bars correspond to (a). d Representative micrographs of immunocytochemistry of AXL in HN137 (n = 4) and AURKB in HN159 (n = 14) and HN220 (n = 12) of primary and metastatic PDCs from at least 2 independent experiment. Scale bar indicates 100 μm. e–g Representative micrographs from Boyden chamber assays of invaded cells (purple) (top), and quantification of invaded cells (bottom) from primary (n = 10 each; red) and metastatic (n = 10 each; blue) cell cultures treated with/without BGB324 or barasertib. At least 3 independent experiments were performed for each culture. Data are represented as mean ± SEM. **p ≤ 0.01; ***p ≤ 0.001; ****p ≤ 0.0001 indicate significant difference using unpaired two-tailed t test compared with untreated at corresponding site of origin, not corrected for multiple comparison. Scale bar indicates 100 μm. Source data are provided as a Source Data file. h Flow cytometry dot plots representing anti-AXL (left) and mouse IgG1 isotype control (right) staining of primary and metastatic PDCs of HN137. i Gating used for identification and isolation of AXLhi, AXLmid and AXLneg/low from HN137 primary PDC by FACS sorting (left). Micrographs representing isolated AXL-based subpopulations treated with/without BGB324 and their respective invasive potential in Boyden chamber assays (right) from 2 independent experiment. Scale bar indicates 2500 μm.
Fig. 4
Fig. 4. scRNAseq analysis of tumor-infiltrating T cells and establishing a trajectory for tumor-targeting CD8+ lymphocytes.
a UMAP of tumor-infiltrating T cells from primary and metastatic tumors with clusters denoted by colors and labeled with inferred cell identities. N = 10,168 cells. b Heatmap of differentially expressed genes (rows) between cells classified into inferred T-cell subsets. Bars on the top of the heatmap indicate the site of origin and cell type corresponding to those of (a) with selected genes indicated. c UMAP of all 3387 CD8 T cells from primary and metastatic tumors. Clusters are denoted by colors and labeled with inferred cell identities based on (d) expression of selected genes used for CD8 T-cell subset annotation for. e Slingshot analysis of CD8 T cells showing two potential trajectories giving rise to tumor-targeting CD8+ cells: Trajectory 1 (top, n = 2904 cells)—from naïve to dysfunctional and Trajectory 2 (bottom, n = 2863 cells)- memory to dysfunctional. f Graphs showing the estimate scores of curated genes related to naïve-like (IL7R, TXNIP, SELL, CCR7, TCF7), proliferative (MKI67, HMGB2, TYMS), dysfunctional (GZMB, GNYL, CTLA4, LAYN, LAG3, TIGIT) populations, and expression of CXCL13 during the development of CD8 T-cell along the naïve-proliferation-dysfunction axis in Trajectory 1. N = 2904 cells. g Geneswitches output showing ordering of the top switching genes along the naïve to dysfunctional (Trajectory 1) CD8 T-cell axis using. Key genes are highlighted with enlarged font size. h UMAP projections of expression levels for genes highlighted in (g). N = 2904 cells.
Fig. 5
Fig. 5. Functional analysis of genes involved in CD8 dysfunction and T-cell receptor sequencing analysis.
Violin plots showing expression of SOX4, DUSP4 and RBPJ in CD8 T-cell subpopulations derived from published cohorts of scRNAseq meta-dataset from (a) HNSCC (n = 542 cells from 11 patients) and (b) skin squamous-cell cancer (n = 17,561 cells from 11 patients), . P values are calculated by one-sided unpaired Wilcoxon test. c Boxplots showing expression of SOX4, DUSP4 and RBPJ in CD8 T-cell subpopulations from (b), grouped by pre- (n = 6986 cells) and post-pembrolizumab (n = 10,575 cells) treatment. Boxplot represents median ± upper/lower quartile; whiskers represent 1.5 interquartile range; p values are calculated by two-sided unpaired Wilcoxon test, where *p ≤ 0.05; ****p ≤ 0.0001, ns not significant. Boxplots indicate quartiles with median at middle, and the whiskers drawn at the lowest and highest points within 1.5 interquartile range of the lower and upper quartiles, respectively. b, c X-axis labels: CD8_mem = CD8 memory; CD8_eff = CD8 effector; CD8_act = CD8 activated; CD8_ex_act = CD8 exhausted/activated; CD8_ex = CD8 exhausted. d Bar graph showing percentage of CD8 T cells expressing CD39, CD57, LAG3 or PD1 from PBMCs that were activated and cultured with siNT, siSOX4 or siDUSP4 for 5 days (n = 4). Black lines and error bars represent mean ± SEM. *p ≤ 0.05; **p ≤ 0.01; ****p ≤ 0.0001 indicate significant difference by paired two-tailed t-test compared with siNT of respective markers, ns not significant. e Frequency of CD39+CD8+ TILs expressing PD1 or CD57 that were activated and cultured with siNT or siSOX4 for 5 days (n = 4). d, e Source data are provided as a Source Data file. f Barplots of the percentage of TCR clone(s) detected once (n = 1399 cells), twice (n = 182 cells) or more than two times (n = 405 cells) across the CD8 T-cell subpopulations of all patients with HNSCC subjected to scRNAseq. g UMAP projection of CD8 T cells from HN272 (n = 377 cells), HN263 (n = 340 cells) and HN257 (n = 347 cells) colored by selected TCR clonotypes. h Schematic diagram summarizing the development and trafficking of CD8 T-cell clones between primary tumor, lymph-node and metastasis, and bloodstream of HN272, HN263 and HN257 based on the clonotype data from (f). Diagram was created with BioRender.com.
Fig. 6
Fig. 6. Determining interactions between pre-metastatic malignant cells and CD8+ T-lymphocytes.
a Hierarchical plot from Cellchat analyses showing ligand-receptor interactions between tumor subpopulations (primary/pre-nodal) with T-cell subsets and TAMs. Circle sizes are proportional to number of cells in each cell group, and edge width represents communication probability with putative ligand-receptor pairs as indicated. b Dot plots showing significant MDK ligand-receptor pairs contributing to signaling. Dot color and size represent the calculated communication probability, and p values determined from one-sided permutation test. c Flow cytometry of cancer cells isolated from HN372, HN377 and HN380 tumors treated with/without MDK-inhibitors (iMDK). (Top) Percentage of live CD3−CD8−, CD3+CD8− and CD3+CD8+ Tcells gated on CD45+ cells, (bottom left) panCK+CD3- cancer cells gated on CD45- cells and (bottom right) ki67+ cancer cells gated on CD45-panCK+ cells. Numbers within each plot indicate percentage. PatientID and treatment conditions (untreated/iMDK-treated) are indicated on top or adjacent to the plots. d Frequency of MDK + (blue; n = 969 cells) and MDK- (orange; n = 210 cells) malignant cells in control or anti-PD1-treated mice (n = 4 mice each). e Expression level of selected genes involved in tumor-cell proliferation from control or anti-PD1-treated mice (n = 4 mice each, 1179 cells). f UMAP of tumor-infiltrating CD8 T cells extracted from humanized NOG-EXL mice treated with/without anti-PD1 (n = 4 mice each; 2342 cells) (see Supplementary Fig. 6i). Clusters denoted by colors labeled with inferred cell identities. g Distribution of CD8 T-cell subpopulations in control vs anti-PD1-treated mice (n = 4 each). h Delta (∆) percentage of CD8 T cells expressing the specific MDK-receptors ITGA4, ITGB1 or NCL in dysfunctional, transitional and proliferating subpopulations, comparing untreated versus anti-PD1-treated mice (n = 4 each). Delta percentage is determined by the percentage of MDK receptor+ CD8+ T cells from anti-PD1-treated mice minus control mice (n = 4 each). i NFKB1 expression in the three CD8 subpopulations in controls and anti-PD1-treated mice (n = 4 mice each, 760 cells). j Scatterplot showing the correlation of expression between NFKB1 with the following MDK receptor(s): ITGA4, ITGB1 and/or NCL in dysfunctional CD8 T cells subpopulations. Each dot represents one dysfunctional CD8 T-cell from control (red; n = 35 cells) or anti-PD1-treated (blue; n = 58 cells) mice. R and two-sided p values determined using Pearson correlation statistical analysis. *p ≤ 0.05; **p ≤ 0.01 indicate significant difference, ns not significant. d, i Data analyzed by unpaired two-tailed t test (d, g, h, j) Source data provided as a Source Data file.

References

    1. Steeg PS. Targeting metastasis. Nat. Rev. Cancer. 2016;16:201–218. doi: 10.1038/nrc.2016.25. - DOI - PMC - PubMed
    1. Chaffer CL, Weinberg RA. A perspective on cancer cell metastasis. Science. 2011;331:1559–1564. doi: 10.1126/science.1203543. - DOI - PubMed
    1. Gupta GP, Massague J. Cancer metastasis: building a framework. Cell. 2006;127:679–695. doi: 10.1016/j.cell.2006.11.001. - DOI - PubMed
    1. Chow LQM. Head and Neck Cancer. N. Engl. J. Med. 2020;382:60–72. doi: 10.1056/NEJMra1715715. - DOI - PubMed
    1. Iyer NG, et al. Randomized trial comparing surgery and adjuvant radiotherapy versus concurrent chemoradiotherapy in patients with advanced, nonmetastatic squamous cell carcinoma of the head and neck: 10-year update and subset analysis. Cancer. 2015;121:1599–1607. doi: 10.1002/cncr.29251. - DOI - PubMed

Publication types

MeSH terms