. 2023 Mar 27;9(1):44.
doi: 10.1038/s41531-023-00484-2.

The small GTPase Rit2 modulates LRRK2 kinase activity, is required for lysosomal function and protects against alpha-synuclein neuropathology

Affiliations

The small GTPase Rit2 modulates LRRK2 kinase activity, is required for lysosomal function and protects against alpha-synuclein neuropathology

Julia Obergasteiger et al. NPJ Parkinsons Dis. .

Abstract

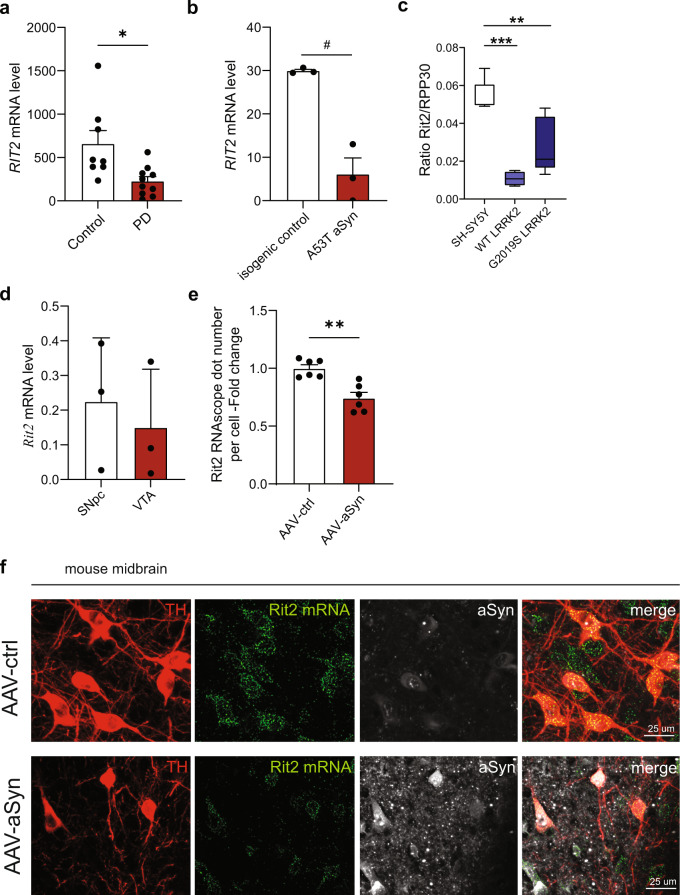
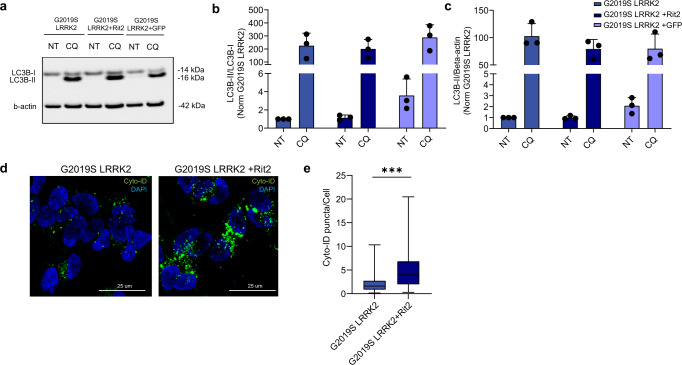
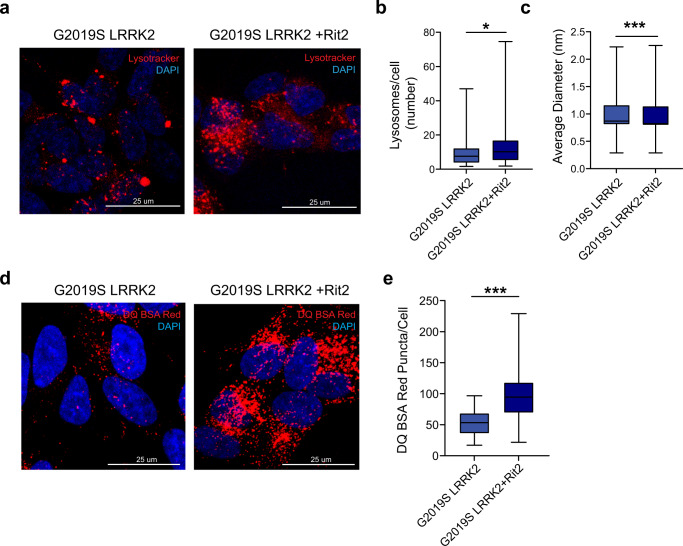
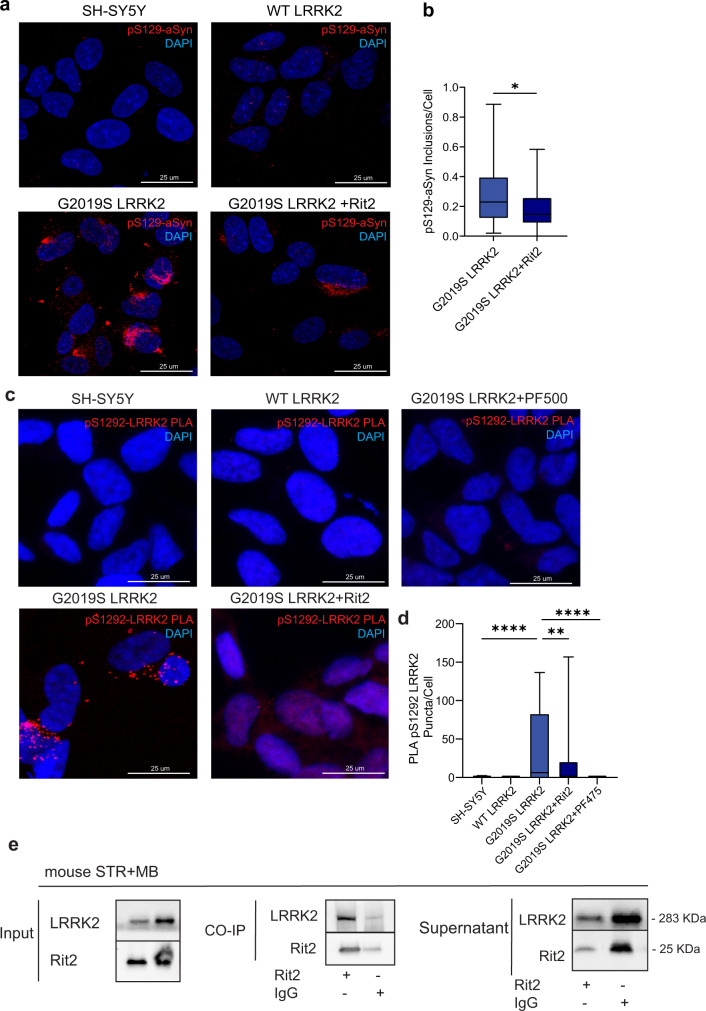
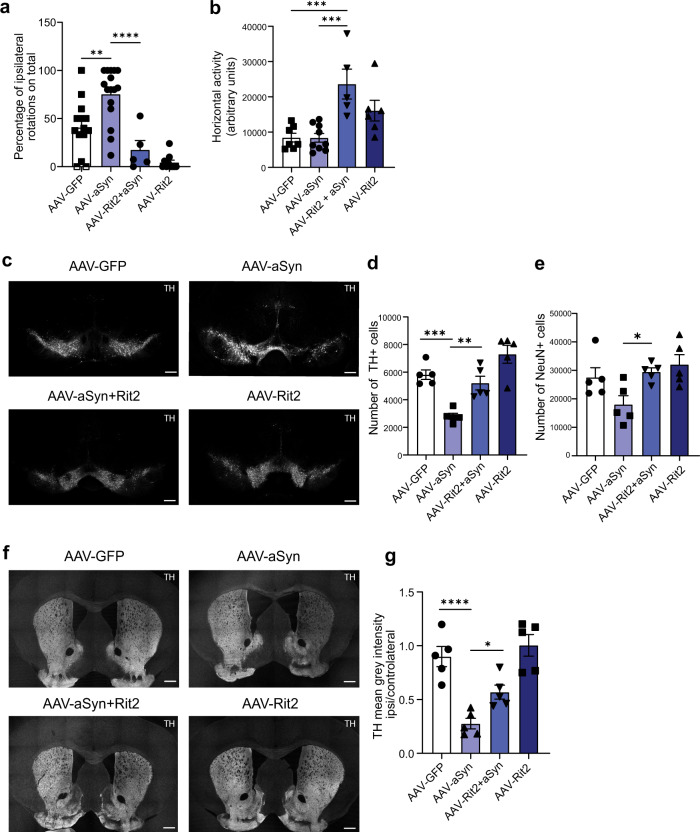
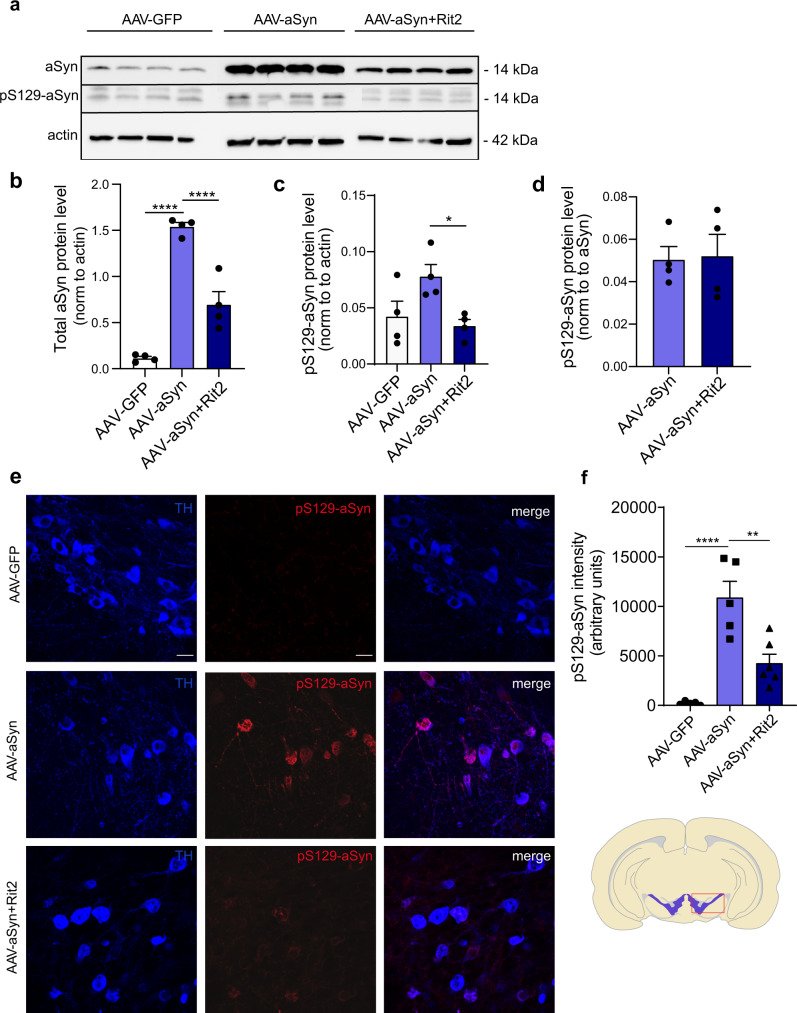
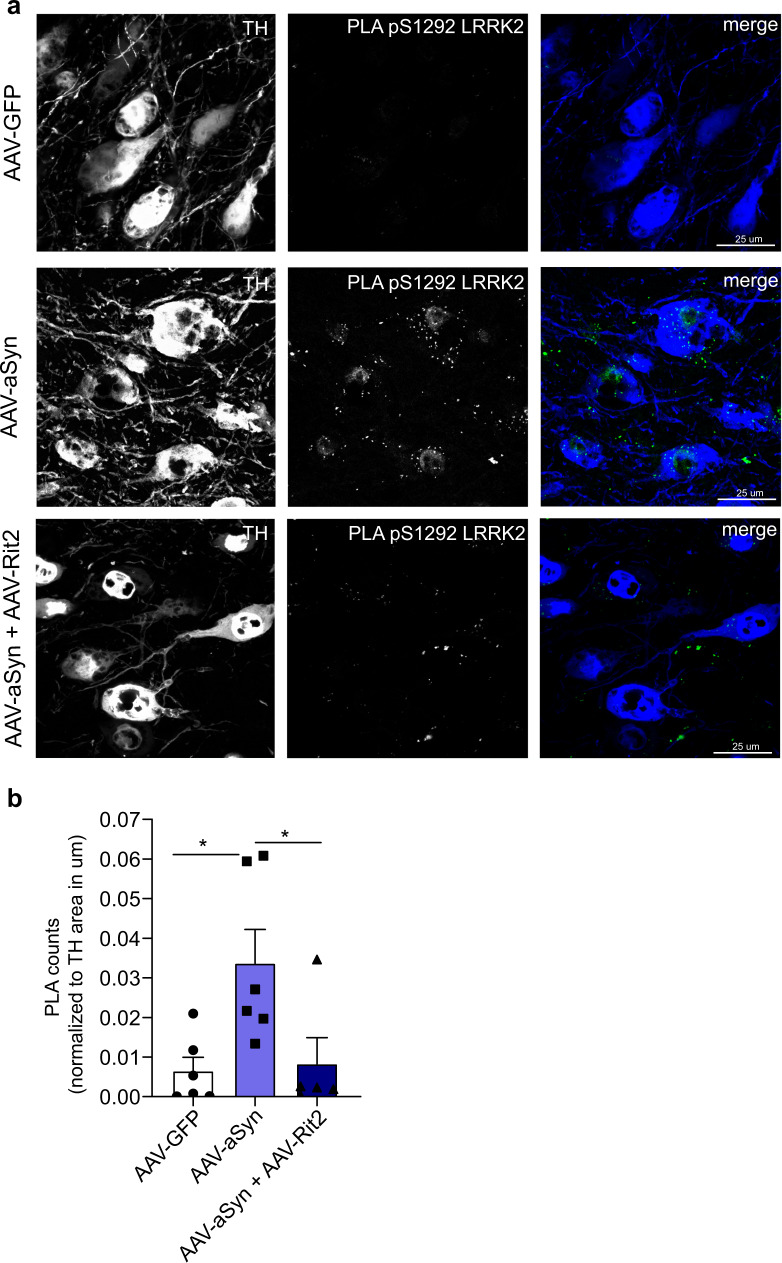
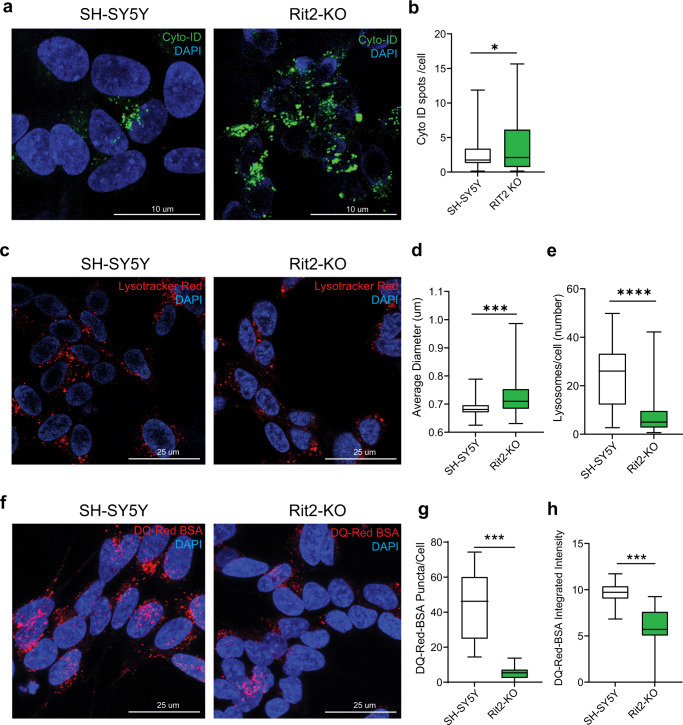
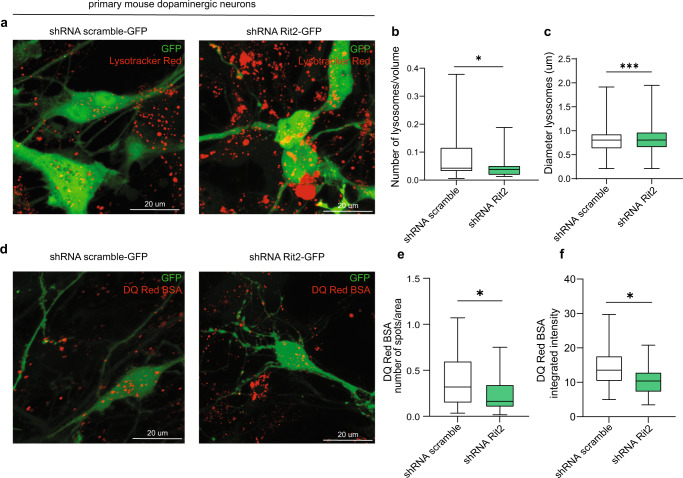
In Parkinson's disease (PD) misfolded alpha-synuclein (aSyn) accumulates in the substantia nigra, where dopaminergic neurons are progressively lost. The mechanisms underlying aSyn pathology are still unclear, but they are hypothesized to involve the autophagy-lysosome pathway (ALP). LRRK2 mutations are a major cause of familial and sporadic PD, and LRRK2 kinase activity has been shown to be involved in pS129-aSyn inclusion modulation. We observed selective downregulation of the novel PD risk factor RIT2 in vitro and in vivo. Rit2 overexpression in G2019S-LRRK2 cells rescued ALP abnormalities and diminished aSyn inclusions. In vivo, viral mediated overexpression of Rit2 operated neuroprotection against AAV-A53T-aSyn. Furthermore, Rit2 overexpression prevented the A53T-aSyn-dependent increase of LRRK2 kinase activity in vivo. On the other hand, reduction of Rit2 levels leads to defects in the ALP, similar to those induced by the G2019S-LRRK2 mutation. Our data indicate that Rit2 is required for correct lysosome function, inhibits overactive LRRK2 to ameliorate ALP impairment, and counteracts aSyn aggregation and related deficits. Targeting Rit2 could represent an effective strategy to combat neuropathology in familial and idiopathic PD.


Conflict of interest statement

The authors declare no competing interests.

Figures

Fig. 1
Fig. 1. Rit2 is expressed in human and mouse brain, and is reduced in both sporadic PD patients and in cells overexpressing LRRK2.
a Geo dataset comparing RIT2 expression levels in DA neurons of the SNc isolated by laser capture microdissection. mRNA levels were reduced by 2.2-fold in DA neurons from sporadic PD patients, when compared to healthy controls (GSE20141, controls = 8, PD = 10). b Geo dataset (GSE46798) comparing Rit2 expression in iPSC-derived DA neurons with A53T-aSyn mutation to control mutation-corrected neurons (n = 3). c Droplet Digital PCR was carried out to assess RIT2 mRNA levels in recombinant neuroblastoma cell lines. Ratio of RIT2 mRNA, normalized to RPP30, is reduced in WT and G2019S-LRRK2 cells (n = 3). d Geo dataset (GSE17542) comparing Rit2 expression in SNc and VTA from TH-GFP mice (n = 3). e Quantification of Rit2 mRNA levels in dopaminergic neurons in the midbrain. Viral aSyn expression decreases Rit2 mRNA levels (n = 6). f Fluorescent in situ hybridization (RNAscope®) was employed to show Rit2 mRNA expression in DA neurons of the mouse SNc and TH and aSyn staining were visualized using immunostaining. Data are represented as median, boxes show the IQ and whiskers show min–max or means ± SEM. *p < 0.05, **p < 0.01 two-tailed Student’s t test. #p < 0.05 unpaired t-test with Welch’s correction after D’Agostino-Pearson test for normal distribution. **p < 0.01, ***p < 0.001, one-way ANOVA followed by Bonferroni’s post hoc test.
Fig. 2
Fig. 2. Overexpression of Rit2 does not affect overall autophagic flux.
a The autophagic flux was assessed in G2019S-LRRK2, G2019S-LRRK2 + Rit2 and G2019S-LRRK2 + GFP cells upon treatment with CQ (100 µM, 3 h) and WB for LC3B. b The ratio between LC3B-II and LC3B-I was not different, suggesting no differences in autophagic flux (n = 3). c Quantification of LC3B levels (normalized to β-actin) indicated no differences upon Rit2 overexpression or CQ-treatment (n = 3). d CytoID assay was employed to visualize autophagosome and autolysosome distribution. e Quantification of CytoID-positive puncta revealed a significant increase in G2019S-LRRK2 cells, when Rit2 was overexpressed (n = 4). Data are represented as median, boxes show the IQ and whiskers show min–max or means ± SEM. In imaging experiments, analysis was conducted on 700–1000 cells per group in each experiment. ***p < 0.01, unpaired two-tailed Student’s t test.
Fig. 3
Fig. 3. Rit2 overexpression rescues lysosomal morphology and proteolytic activity in G2019S-LRRK2 cells.
a Cell processing with the Lysotracker Red dye was performed to visualize lysosomes in G2019S-LRRK2 and G2019S-LRRK2 + Rit2 cells. b The number of lysosomes per cell was quantified and revealed an increase, when Rit2 was transfected in G2019S-LRRK2 cells (n = 3). c The average size of lysosomes was assessed, and a significant decrease of the diameter was measured when Rit2 was transfected to G2019S-LRRK2 cells (n = 3). d The DQ-Red-BSA assay was employed to assess the proteolytic activity of lysosomes. e Quantification of DQ-Red-BSA fluorescent spots revealed a significant increase in G2019S-LRRK2 cells, with Rit2 overexpression (n = 3). Data are represented as median, boxes show the IQ and whiskers show min–max. In imaging experiments, analysis was conducted on 700–1000 cells per group in each experiment. *p < 0.05, ***p < 0.001, unpaired two-tailed Student’s t test.
Fig. 4
Fig. 4. Rit2 overexpression reduces pS129-aSyn positive inclusions, reduces pS1292-LRRK2 and Rit2 and LRRK2 interact directly.
a Representative images showing pS129-aSyn immunostaining in SH-SY5Y, WT-LRRK2 and G2019S-LRRK2 cells with or without Rit2 overexpression. b Quantification pS129-aSyn in cell overexpressing either G2019S-LRRK2 alone or G2019S-LRRK2 with Rit2 (n = 4). c PLA was used to quantify phosphorylation of Serine 1292 of LRRK2 in neuroblastoma cell lines. d The G2019S-LRRK2 mutation increases Serine 1292 phosphorylation, which is reduced by Rit2 overexpression or treatment with PF-475 LRRK2 kinase inhibitor (n = 4). e CO-immunoprecipitation of LRRK2 using Rit2 antibody in mouse brain lysates. LRRK2 can be precipitated while bound to Rit2 and therefore, the two proteins are physically interacting with each other also at endogenous protein levels in the mouse brain (n = 3). Data are represented as median, boxes show the IQ and whiskers show min–max. In imaging experiments, analysis was conducted on 700–1000 cells per group in each experiment. *p < 0.05, **p < 0.01, ****p < 0.0001 two-tailed Student’s t test.
Fig. 5
Fig. 5. Enhanced Rit2 expression in the mouse midbrain counteracts aSyn-dependent deficits and DA neuron loss.
a Overexpression of A53T-aSyn increases the number of ipsilateral rotations and co-injection with AAV-Rit2 or injection of AAV-Rit2 alone increases the number of contralateral rotations. b Overexpression of Rit2 alone or with aSyn significantly increases horizontal activity in the open field (nGFP = 7, naSyn = 9, naSyn + RIT2 = 8, nRIT2 = 6 for behavioral tests). c IHC for TH was used to count dopaminergic neurons in the midbrain. d Overexpression of A53T-aSyn alone induces a significant loss of DA neurons, which is attenuated by co-injection of AAV-Rit2. e A53T-aSyn overexpression tends to reduce the number of NeuN+ cells in the ipsilateral SNc and concomitant overexpression of Rit2 significantly preserves NeuN+ cells (5 animals/group). f IHC for TH was used to measure the density of DA projections in the striatum. g Overexpression of A53T-aSyn decreases the number of TH+ axons in the striatum, which is attenuated by the co-injection of AAV-Rit2 (n = 5/group for IHC experiments). Data represented as mean ± SEM, *p < 0.05, **p < 0.01, ***p < 0.001, ****p < 0.0001, one-way ANOVA followed by Bonferroni’s post hoc test. Scale bar = 500 um.
Fig. 6
Fig. 6. Enhanced Rit2 expression reduces total aSyn and pS129-aSyn levels.
a Total aSyn levels in mice injected with AAV-A53T-aSyn alone or in combination with AAV-Rit2 were assessed by blotting for total and phosphorylated aSyn and β-actin. b Quantification of total aSyn levels, normalized on β-actin (n = 4). Co-injection of AAV-Rit2 significantly reduces aSyn levels in the ipsilateral side. c Quantification of pS129-aSyn levels, normalized on β-actin (5 animals/group). Co-injection of AAV-Rit2 significantly reduces pS129-aSyn levels in the ipsilateral side. d Quantification of pS129-aSyn levels, normalized on total aSyn. Co-injection of AAV-Rit2 does not alter pS129-aSyn/aSyn ratio. e IHC staining of pS129-aSyn and TH in the midbrain of AAV-GFP, AAV-A53T-aSyn and AAV-A53T-aSyn + AAV-Rit2 injected mice. f Quantification of pS129-aSyn intensity. AAV-A53T-aSyn injection significantly increases the intensity of pS129-aSyn signal, which is reduced by the co-injection of AAV-Rit2 (5 animals/group). Scale bar = 20 um. Data represented as mean ± SEM. *p < 0.05, **p < 0.01, ***p < 0.001, ****p < 0.0001, one-way ANOVA followed by the Bonferroni’s post hoc test.
Fig. 7
Fig. 7. In vivo aSyn overexpression increases endogenous LRRK2 activity, which is prevented by Rit2 co-expression.
a PLA analysis of AAV-GFP, AAV-A53T-aSyn and AAV-A53T-aSyn + AAV-Rit2 injected mice in TH-positive neurons in the SNc. b Quantification of PLA counts in TH-positive neurons shows a significant increase of endogenous LRRK2 kinase activity with AAV-A53T-aSyn injection. The increase is completely prevented by co-injection of AAV-Rit2 with AAV-A53T-aSyn (AAV-GFP = 6 animals, AAV-A53T-aSyn = 6 animals, AAV-A53T-aSyn + AAV-Rit2 = 5 animals). Data represented as mean ± SEM. *p < 0.05, one-way ANOVA followed by Bonferroni’s post hoc test.
Fig. 8
Fig. 8. Lysosomal morphology and proteolytic activity are altered in Rit2 KO neuroblastoma cells.
a CytoID assay was employed to visualize autophagosome and autolysosome distribution. b Quantification of CytoID-positive puncta revealed a significant increase in Rit2-KO cells (n = 3). c Cell processing with the Lysotracker Red dye was performed to visualize number and size of lysosomes. d The number of lysosomes per cell was quantified and revealed a decrease, with Rit2 KO (n = 6). e The average size of lysosomes was assessed, and a significant increase of the diameter was measured in Rit2-KO cells (n = 6). f The DQ-Red-BSA assay was employed to assess the proteolytic activity of lysosomes. g, h Quantification of DQ-Red-BSA fluorescent spots revealed a significant decrease of number and intensity in Rit2-KO cells (n = 3). Data are represented as median, boxes show the IQ and whiskers show min–max. In imaging experiments, analysis was conducted on 700–1000 cells per group in each experiment. *p < 0.05, ***p < 0.001, ****p < 0.0001 unpaired two-tailed Student’s t test.
Fig. 9
Fig. 9. Rit2 KD leads to abnormal lysosomal morphology and proteolytic activity in primary dopaminergic neurons.
a Lysosomes were visualized with the Lysotracker Red dye in neurons. b The number of lysosomes per cell was quantified and revealed a decrease when Rit2 levels were reduced (n = 3). c The average size of lysosomes was assessed, and a significant increase of the diameter was measured upon Rit2 KD (n = 3). d The DQ-Red-BSA assay was employed to assess the proteolytic activity of lysosomes. e, f Quantification of DQ-Red-BSA fluorescent spots revealed a significant decrease of number and intensity in Rit2 KD neurons (n = 3). Data are represented as median, boxes show the IQ and whiskers show min–max. *p < 0.05, ***p < 0.001, unpaired two-tailed Student’s t test.

References

    1. Tysnes O-B, Storstein A. Epidemiology of Parkinson’s disease. J. Neural Transm. 2017;124:901–905. doi: 10.1007/s00702-017-1686-y. - DOI - PubMed
    1. Poewe W, et al. Parkinson disease. Nat. Rev. Dis. Primers. 2017;3:17013. doi: 10.1038/nrdp.2017.13. - DOI - PubMed
    1. Lesage S, Brice A. Parkinson’s disease: from monogenic forms to genetic susceptibility factors. Hum. Mol. Genet. 2009;18:R48–R59. doi: 10.1093/hmg/ddp012. - DOI - PubMed
    1. Dauer W, Przedborski S. Parkinson’s disease: mechanisms and models. Neuron. 2003;39:889–909. doi: 10.1016/S0896-6273(03)00568-3. - DOI - PubMed
    1. Deng H, Wang P, Jankovic J. The genetics of Parkinson disease. Ageing Res. Rev. 2018;42:72–85. doi: 10.1016/j.arr.2017.12.007. - DOI - PubMed