. 2023 Mar 27;14(1):1684.
doi: 10.1038/s41467-023-37432-w.

A comprehensive platform for analyzing longitudinal multi-omics data

Affiliations

A comprehensive platform for analyzing longitudinal multi-omics data

Suhas V Vasaikar et al. Nat Commun. .

Abstract

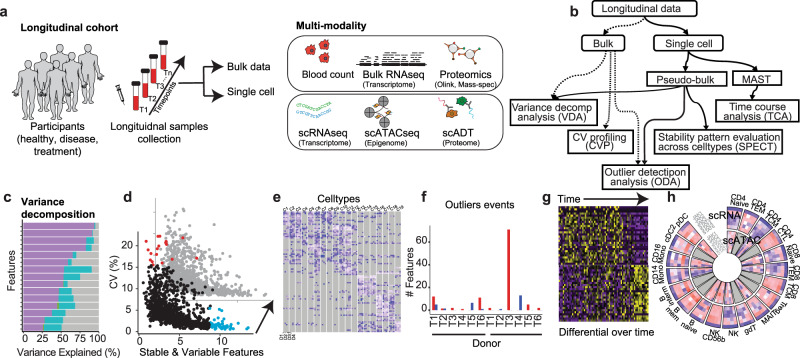
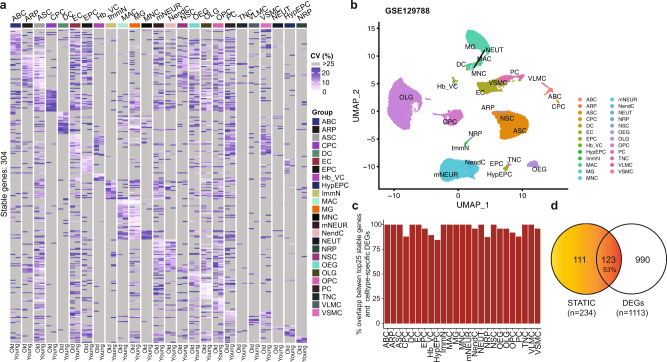
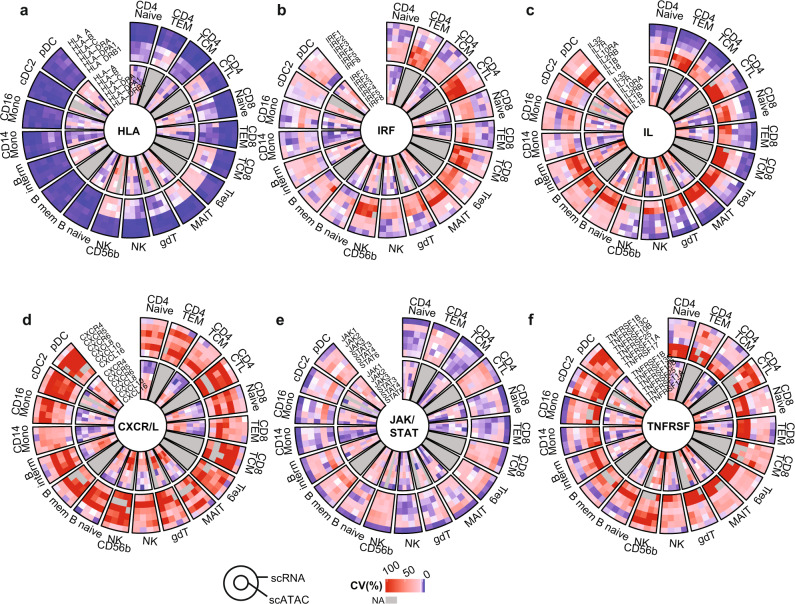
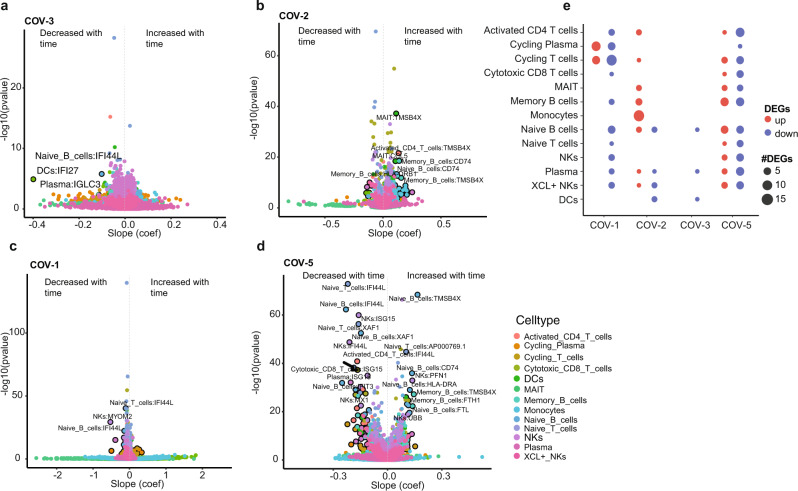
Longitudinal bulk and single-cell omics data is increasingly generated for biological and clinical research but is challenging to analyze due to its many intrinsic types of variations. We present PALMO ( https://github.com/aifimmunology/PALMO ), a platform that contains five analytical modules to examine longitudinal bulk and single-cell multi-omics data from multiple perspectives, including decomposition of sources of variations within the data, collection of stable or variable features across timepoints and participants, identification of up- or down-regulated markers across timepoints of individual participants, and investigation on samples of same participants for possible outlier events. We have tested PALMO performance on a complex longitudinal multi-omics dataset of five data modalities on the same samples and six external datasets of diverse background. Both PALMO and our longitudinal multi-omics dataset can be valuable resources to the scientific community.


Conflict of interest statement

S.V.V., A.S., T.T., P.S., T.F.B., and X.L. are listed as inventors in a US patent application “Molecular Signatures For Cell Typing And Monitoring Immune Health” (application No. 63/291,234) based on this work. C.L. is currently an employee of GlaxoSmithKline. The remaining authors declare no competing interests.

Figures

Fig. 1
Fig. 1. General workflow and analysis schema of PALMO.
a PALMO can work with complex longitudinal data, including clinical data, bulk omics data, and single-cell omics data. b Overview of five analytical modules implemented in PALMO. c Variance decomposition analysis (VDA) applies generalized linear mixed model to assess contributions of factors of interest (such as disease status, sex, individual participant, cell type, experimental batch, etc.) to the total variance of individual features in the data. d Coefficient of variation (CV) profiling (CVP) is designed for bulk longitudinal data, calculates CV of repeated measurements on the same participant to assess the corresponding longitudinal stability, and compares CVs of different participants to identify consistently stable or variable features. e Stability pattern evaluation across cell types (SPECT) is the CVP counterpart for single-cell omics data, analyzes stability patterns of features across different cell types and different participants, classifies features based on how often they are stable or variable in cell type-donor combinations, and identifies features that are unique to individual cell types and consistent among participants. f Outlier detection analysis (ODA) evaluates how many features in a sample are outliers when compared with the corresponding features in other samples of same participant, assesses whether the number of outlier features in the sample is significantly higher than expectation, and identifies possible abnormal events occurred during a longitudinal study. g Time course analysis (TCA) uses the hurdle model to evaluate transcriptomic changes over time based on longitudinal scRNA-seq data of same participants, models time as a continuous variable for data with at least three timepoints, and identifies up- or down-regulated genes over time. h PALMO uses circos plots to display CVs of features of interest and reveal stability patterns across features, participants, cell types, and data modalities. Adobe Illustrator (version 27.1.1; https://www.adobe.com/products/illustrator.html) was used to draw (a), arrange panels, and edit text. PowerPoint (version 16.69; https://www.microsoft.com/en-us/microsoft-365/powerpoint) was used to draw (b).
Fig. 2
Fig. 2. Variance decomposition on longitudinal single-cell omics data.
a Overall distributions of variance explained by inter-donor variations (Donor), longitudinal intra-donor variations (Week), variations among cell types (Celltype), or residual variations (Residual) based on scRNA-seq data. The scRNA-seq data was collected on 24 independent peripheral blood mononuclear cell (PBMC) samples from n = 4 healthy participants with each participant contributing one sample a week for 6 weeks. The distributions were evaluated based on pseudo-bulk intensities of n = 11,191 genes in 19 cell types. b, c Examples of genes whose total expression variance was most explained by inter-cell-type variations (b) or inter-donor variations (c). d Examples of genes that had the most but still minuscular intra-donor variations in expression. bd Pseudo-bulk intensities of the corresponding genes in 19 cell types were displayed in boxplots. e Same as (a) but based on scATAC-seq data from n = 18 out of the 24 PBMC samples with 2 participants contributing 6 samples while other 2 participants contributing 3 samples. The distributions were evaluated based on gene scores of n = 24,769 genes in 14 cell types. f, g The top list of genes whose inter-cell-type (f) or inter-donor (g) variations contributed most to the total variance in scATAC-seq data. h The top list of genes that had the most intra-donor variations in scATAC-seq data. ae Each boxplot displays the median (centerline), the first and third quartiles (the lower and upper bound of the box), and the 1.5x interquartile range (whiskers) of the data. ICC: intra-class correlation. Adobe Illustrator (version 27.1.1; https://www.adobe.com/products/illustrator.html) was used to arrange panels and edit text. Source data are provided as a Source Data file.
Fig. 3
Fig. 3. Longitudinal stability of plasma proteome.
a Scatter plots of coefficient of variation (CV) versus mean of normalized protein expression (NPX) over 10 timepoints in n = 6 participants. One plasma sample per week was collected from n = 6 participants over 10 weeks. The evaluation for each participant was based on measurements on 1042 proteins in the corresponding 10 plasma samples. The longitudinal stable and variable proteins are represented in blue and red, respectively. b, c Heatmap of CV of top 50 longitudinally variable (b CV > 5%) or stable (c CV < 5%) plasma proteins. d Top panel: Number of proteins with z>2.5 (red) or z<2.5 (blue) in individual samples, where z=(NPXNPX¯)/SD with NPX¯ and SD being the mean and the standard deviation, respectively, of NPX across samples of the same participant. Bottom panel: log10(p) for individual samples being possible outliers, where p is calculated based on a binomial test (two-sided). e Protein examples clearly demonstrate that Week 6 of participant PTID3 was an outlier. b, c, e Each boxplot displays the median (centerline), the first and third quartiles (the lower and upper bound of the box), and the 1.5x interquartile range (whiskers) of the data. Adobe Illustrator (version 27.1.1; https://www.adobe.com/products/illustrator.html) was used to arrange panels and edit text. Source data are provided as a Source Data file.
Fig. 4
Fig. 4. Properties of 220 STATIC genes of PBMC.
a Heatmap of coefficient of variation (CV) evaluated on 93 out of the 220 stable across time in cell-types (STATIC) genes that were identified from 19 cell types in the longitudinal scRNA-seq data of n = 4 healthy participants. The CVs for each of the n = 4 participants were evaluated based on pseudo-bulk intensities in the corresponding 6 independent peripheral blood mononuclear cell (PBMC) samples. The 93 STATIC genes include up to ten top STATIC genes from individual cell types. b Circos plots displaying CV of five example STATIC genes identified from each of five major cell types: T cells, B cells, natural killer (NK) cells, monocytes (Mono), and dendritic cells (DCs). c Uniform Manifold Approximation and Projection (UMAP) using only the 220 STATIC genes as input features (sUMAP) on the same longitudinal scRNA-seq data. df sUMAP using the same 220 STATIC genes on three external PBMC datasets ((d) CNP0001102, (e) GSE149689, (f) GSE164378), where cells are labeled as in the original studies. g Distributions of Pearson correlation coefficient between gene expression (pseudo-bulk intensity) in scRNA-seq data and gene score in scATAC-seq data, one for the 220 STATIC genes (median correlation 0.70), one for the top 500 highly variable genes (HVGs, median correlation 0.40), one for the 10,608 reliable genes (average expression ≥0.1, median correlation 0.21), and one for random gene pairs (95% upper confidence bound at 0.399). The correlations were calculated across 14 cell types in 18 PBMC samples (n = 252 data points). h, i Venn diagrams showing the overlaps between the 220 STATIC genes and biomarkers distinguishing either healthy controls (Normal) versus participants infected with influenza (FLU, left panel) or Normal versus participants infected with SARS-CoV-2 (COVID19, right panel). The biomarkers were identified from either (h) CNP0001102 or (i) GSE149689. Adobe Illustrator (version 27.1.1; https://www.adobe.com/products/illustrator.html) was used to arrange panels and edit text. Source data are provided as a Source Data file.
Fig. 5
Fig. 5. Properties of 304 STATIC genes of mouse brain tissue.
a Heatmap of coefficient of variation (CV) of the 304 stable across time in cell-types (STATIC) genes that were identified from 25 cell types in the scRNA-seq data of a mouse brain study (GSE129788). The CVs were evaluated based on pseudo-bulk intensities in brain tissues from either n = 8 young or n = 8 old mice. b Uniform Manifold Approximation and Projection (UMAP) using only the 304 STATIC genes as input features (sUMAP) on the same scRNA-seq data. Cells are labeled as in the original study. c Percentage of top STATIC genes that overlap with cell-type marker genes identified in the original study. Up to 25 top STATIC genes from each cell type are compared with the corresponding marker genes of the same cell type. d Venn diagram showing the overlap between the 234 STATIC genes identified from 15 out of the 25 cell types and biomarkers distinguishing young versus old mice that were identified in the original study from the same 15 cell types. Adobe Illustrator (version 27.1.1; https://www.adobe.com/products/illustrator.html) was used to arrange panels and edit text. Source data are provided as a Source Data file.
Fig. 6
Fig. 6. Circos plots showing stability patterns of five protein families.
a Circos plot displaying stability patterns of gene expression (outer circles) and gene score (inner circles) of human leukocyte antigen (HLA) protein family (member: HLA-A, HLA-B, HLA-C, HLA-DRA, HLA-DPA1, and HLA-DRB1). Samples with missing data or cell types with low cell counts are shown in grey. bf Same as (a) but for (b) interferon regulatory factors (IRFs; member: IRF1, IRF2, IRF3, IRF4, IRF5, and IRF8), (c) interleukins (ILs; member: IL32, IL7R, IL10RA, IL2RB, IL1B and IL18), (d) chemokine (C-X-C motif) receptor/ligand (CXCR/L) protein family (member: CXCR4, CXCR5, CXCR6, CXCL8, CXCL10, and CXCL16), (e) Janus kinase (JAK) and signal transducer and activator of transcription (STAT) protein family (member: JAK1, JAK2, JAK3, STAT3, STAT4, and STAT6), and (f) tumor necrosis factor receptor superfamily (TNFRSF; member: TNFRSF1B, TNFRSF13C, TNFRSF10B, TNFRSF25, TNFRSF11A, and TNFRSF17). The CV of gene expression for each of n = 4 participants was calculated from pseudo-bulk intensities in the corresponding 6 independent peripheral blood mononuclear cell (PBMC) samples. The CV of gene score for each participant was based on either 6 (for n = 2 participants) or 3 (for other n = 2 participants) PBMC samples. Adobe Illustrator (version 27.1.1; https://www.adobe.com/products/illustrator.html) was used to arrange panels and edit text. Source data are provided as a Source Data file.
Fig. 7
Fig. 7. Heterogeneous immune responses by COVID19 patients during recovery.
a Volcano plot showing temporal expression changes of individual genes in different cell types during the recovery of patient COV-3 (female, 41 years old, mild symptoms, data on day D1/D4/D16), based on longitudinal scRNA-seq data in CNP0001102. The x-axis shows the slope (coefficient) of gene expression change as a linear function of time. The y-axis shows the corresponding adjusted p value of the slope. bd Same as (a) but for patients (b) COV-2 (male, 45 years old, mild symptoms, data on D1/D4/D7/D10/D16), (c) COV-1 (male, 15 years old, mild symptoms, data on D1/D4/D16), and (d) COV−5 (female, 85 years old, severe symptoms, data on D1/D7/D13). ad Each plot contains results on up to 18,824 genes in 13 cell types (up to 244,712 data points). e Counts of significantly upregulated (adjusted p<0.05 and slope>0.1, red) and significantly downregulated (adjusted p<0.05 and slope<0.1, blue) genes during the recovery of the four COVID-19 patients in individual cell types. ad The p-value for slope was calculated based on two-sided likelihood-ratio test and adjusted by Benjamini and Hochberg procedure for testing many genes. Adobe Illustrator (version 27.1.1; https://www.adobe.com/products/illustrator.html) was used to arrange panels and edit text. Source data are provided as a Source Data file.

References

    1. Bernardes JP, et al. Longitudinal multi-omics analyses identify responses of megakaryocytes, erythroid cells, and plasmablasts as hallmarks of severe COVID-19. Immunity. 2020;53:1296–1314.e9. doi: 10.1016/j.immuni.2020.11.017. - DOI - PMC - PubMed
    1. Lee, J. S. et al. Immunophenotyping of COVID-19 and influenza highlights the role of type I interferons in development of severe COVID-19. Sci. Immunol.5, eabd1554 (2020). - PMC - PubMed
    1. Zhu L, et al. Single-cell sequencing of peripheral mononuclear cells reveals distinct immune response landscapes of COVID-19 and influenza patients. Immunity. 2020;53:685–696.e3. doi: 10.1016/j.immuni.2020.07.009. - DOI - PMC - PubMed
    1. Zhou W, et al. Longitudinal multi-omics of host-microbe dynamics in prediabetes. Nature. 2019;569:663–671. doi: 10.1038/s41586-019-1236-x. - DOI - PMC - PubMed
    1. Zhang S, et al. Longitudinal single-cell profiling reveals molecular heterogeneity and tumor-immune evolution in refractory mantle cell lymphoma. Nat. Commun. 2021;12:2877. doi: 10.1038/s41467-021-22872-z. - DOI - PMC - PubMed