. 2023 Mar 27;14(1):1694.
doi: 10.1038/s41467-023-37398-9.

Rewired m6A epitranscriptomic networks link mutant p53 to neoplastic transformation

Affiliations

Rewired m6A epitranscriptomic networks link mutant p53 to neoplastic transformation

An Xu et al. Nat Commun. .

Abstract

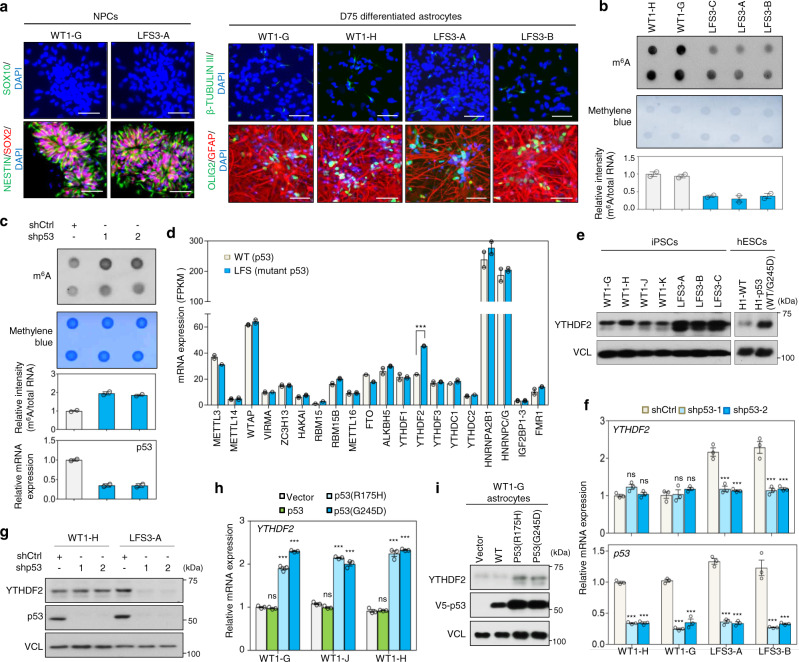
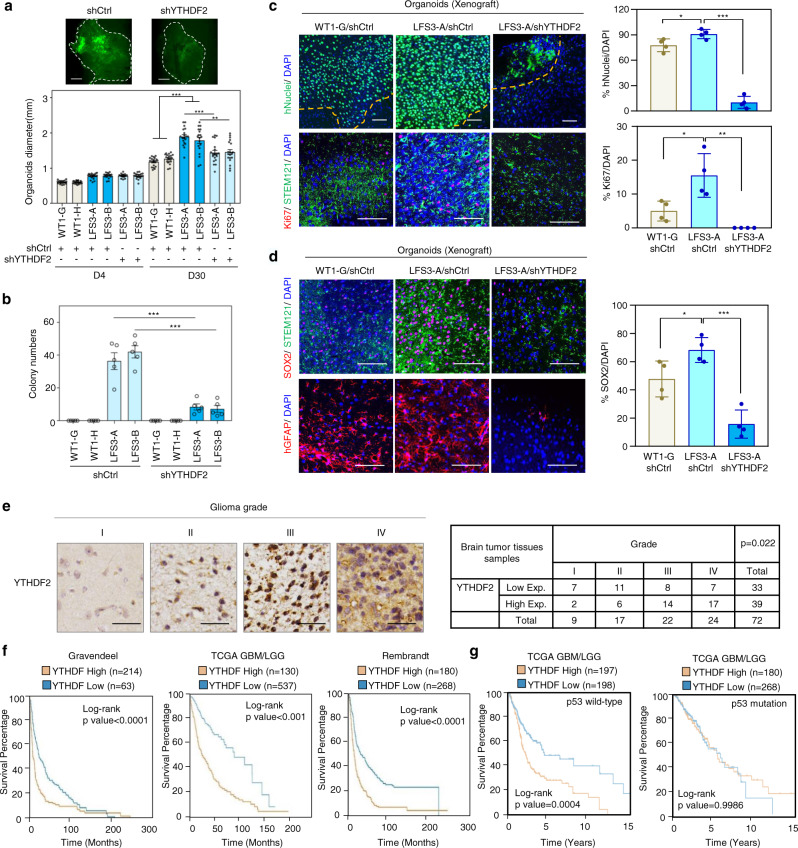
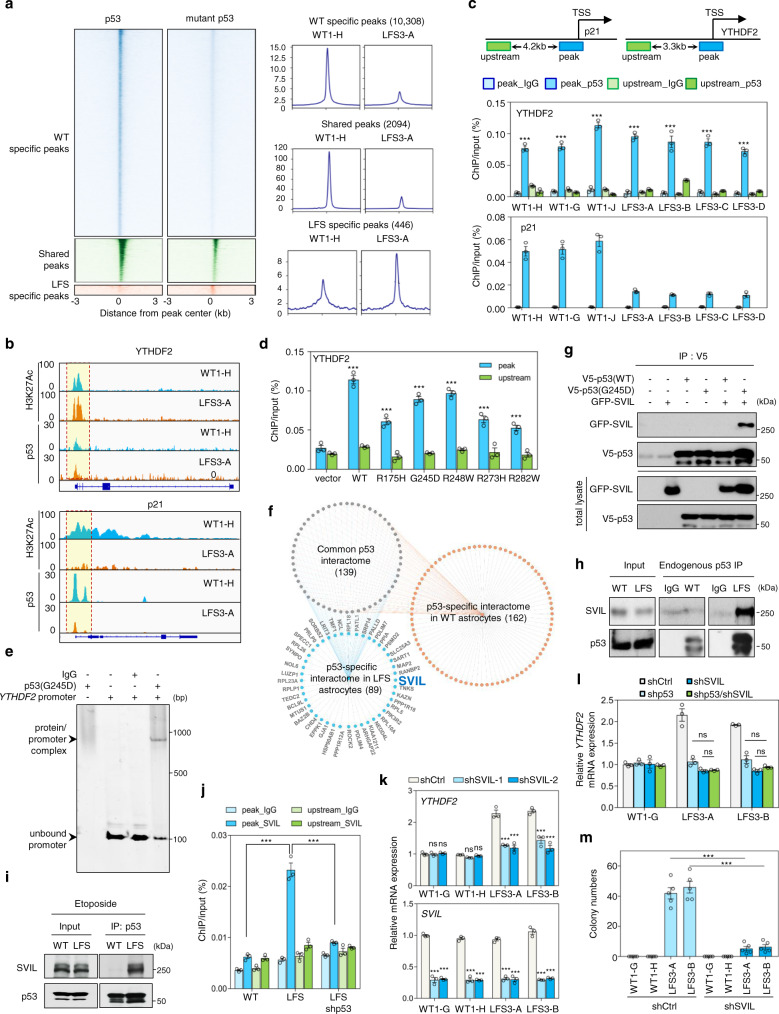
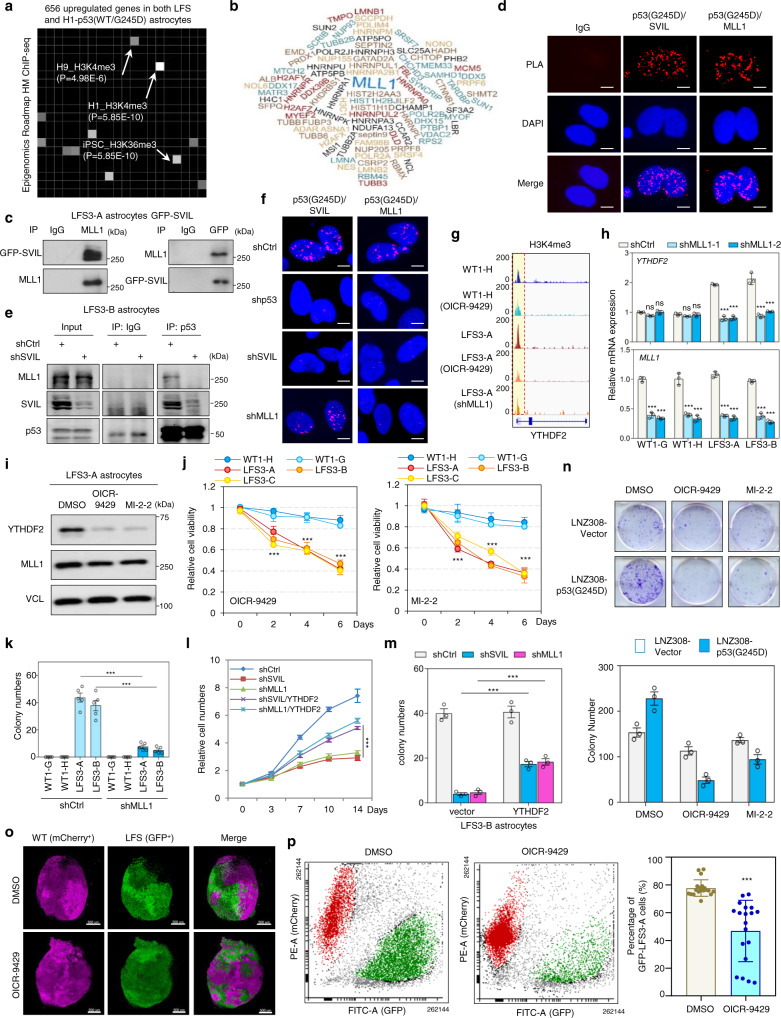
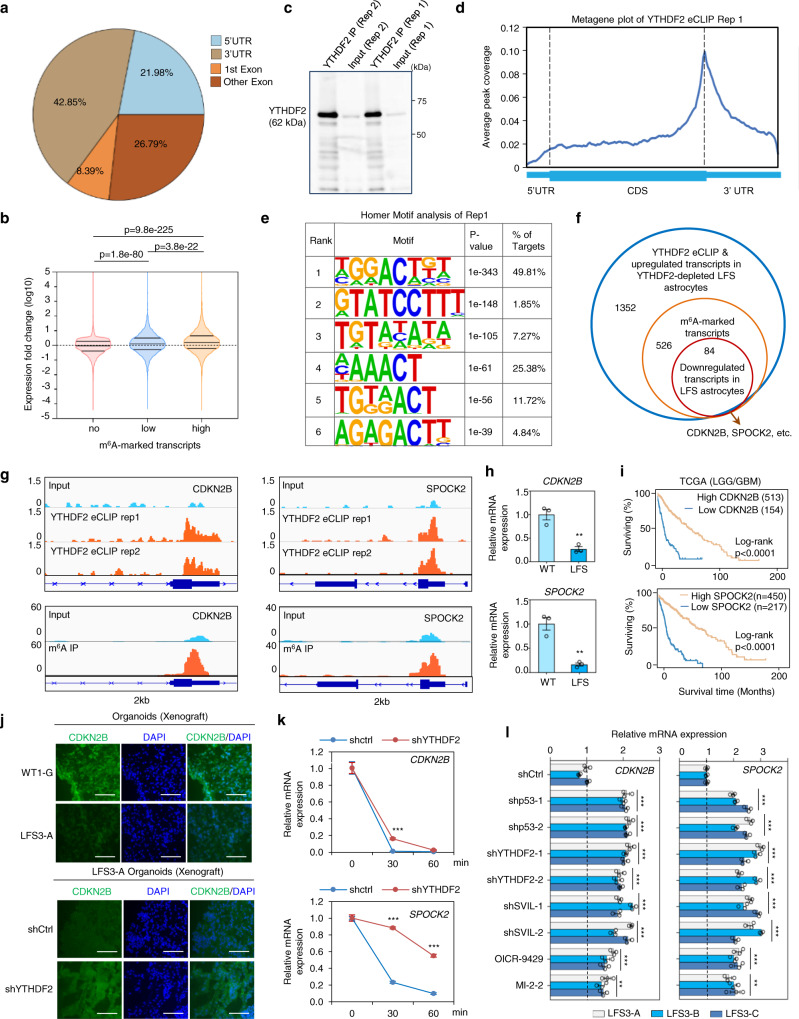
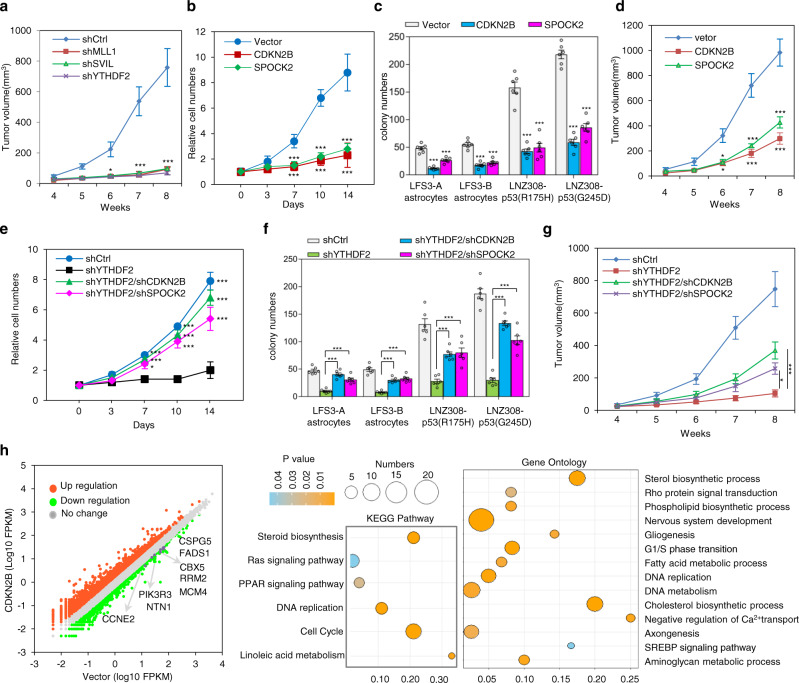
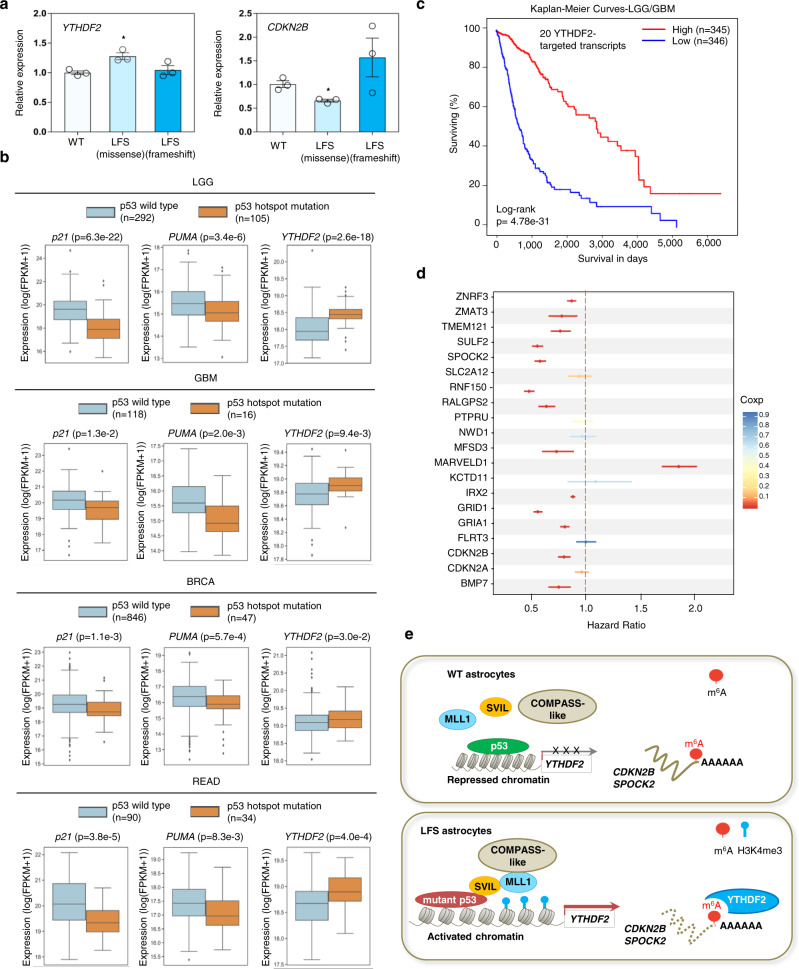
N6-methyladenosine (m6A), one of the most prevalent mRNA modifications in eukaryotes, plays a critical role in modulating both biological and pathological processes. However, it is unknown whether mutant p53 neomorphic oncogenic functions exploit dysregulation of m6A epitranscriptomic networks. Here, we investigate Li-Fraumeni syndrome (LFS)-associated neoplastic transformation driven by mutant p53 in iPSC-derived astrocytes, the cell-of-origin of gliomas. We find that mutant p53 but not wild-type (WT) p53 physically interacts with SVIL to recruit the H3K4me3 methyltransferase MLL1 to activate the expression of m6A reader YTHDF2, culminating in an oncogenic phenotype. Aberrant YTHDF2 upregulation markedly hampers expression of multiple m6A-marked tumor-suppressing transcripts, including CDKN2B and SPOCK2, and induces oncogenic reprogramming. Mutant p53 neoplastic behaviors are significantly impaired by genetic depletion of YTHDF2 or by pharmacological inhibition using MLL1 complex inhibitors. Our study reveals how mutant p53 hijacks epigenetic and epitranscriptomic machinery to initiate gliomagenesis and suggests potential treatment strategies for LFS gliomas.


Conflict of interest statement

E.L.V.N. is a co-founder, member of the Board of Directors, on the SAB, equity holder, and paid consultant for Eclipse BioInnovations. E.L.V.N.’s interests have been reviewed and approved by the Baylor College of Medicine in accordance with its conflict of interest policies. The remaining authors declare no competing interests.

Figures

Fig. 1
Fig. 1. Mutant p53 upregulates m6A reader YTHDF2 expression in LFS astrocytes and glioma cells.
a Immunostaining indicates iPSC-derived NPCs and astrocytes expressing their corresponding cell markers (SOX2 and NESTIN for NPCs, GFAP for astrocytes, OLIG2 for oligodendrocytes, and β-TUBULIN III for neurons). Scale bar, 50 µm. b m6A methylation dot blotting shows decreased m6A methylation in LFS astrocytes. Dot blotting is performed to identify polyadenylated mRNAs immunoblotted with anti-m6A antibodies (upper panel). Methylene blue staining of total mRNA is used as a loading control (lower panel). Dot density is measured by ImageJ. The blotting images represent the results of at least three independent experiments, while the bar charts depict technical replicates within a single experiment. c m6A methylation dot blotting indicates increased m6A methylation upon depletion of mutant p53 in LFS astrocytes. Dot blotting identifies polyadenylated mRNA isolated from shCtrl and shp53 transduced LFS astrocytes and immunoblotted with anti-m6A antibodies (upper panel). Methylene blue staining of total mRNA is used as a loading control (lower panel). Dot density is measured by ImageJ. The blotting images represent the results of at least three independent experiments, while the bar charts depict technical replicates within a single experiment. d Transcriptome analysis of the mRNA expression of known m6A regulators in WT and LFS astrocytes. Among 20 m6A regulators examined in this study, m6A reader YTHDF2 is significantly upregulated in LFS astrocytes compared with WT astrocytes (n = 2 biologically independent samples). e Immunoblotting indicates elevated YTHDF2 protein in multiple LFS and H1-p53(WT/G245D) astrocytes compared with WT and H1-WT astrocytes. f RT-qPCR analysis shows a decrease of YTHDF2 expression upon p53/mutant p53 knockdown in LFS astrocytes but not WT astrocytes (n = 3 biologically independent samples). g Depletion of p53/mutant p53 by p53 shRNAs leads to downregulated YTHDF2 protein expression in LFS astrocytes but not WT astrocytes. h RT-qPCR shows mutant p53s (p53(R175H) and p53(G245D)) upregulate YTHDF2 mRNA expression in WT astrocytes (n = 3 biologically independent samples). i Immunoblotting indicates upregulation of YTHDF2 protein following transduction of distinct mutant p53s (p53(R175H) and p53(G245D)) but not p53 into WT iPSC-derived astrocytes. The results are representative of at least three independent experiments (ac, e, g, i). The data are presented as the mean ± SEM; two-way ANOVA with Bonferroni’s multiple comparison test (h, f); multiple t test (d). ***P < 0.001. ns not significant. Source data and exact P values are provided in the Source Data file.
Fig. 2
Fig. 2. YTHDF2 is associated with mutant p53-induced neomorphic oncogenic function and its expression is correlated with poor prognosis in glioma patients.
a Knockdown of YTHDF2 leads to decreased LFS cerebral organoid development. The average diameters of shCtrl- and shYTHDF2-transduced LFS organoids and WT organoids are quantified at 4 and 30 days (n = 19 biologically independent samples). Scale bar, 500 µm. b In vitro AIG assay demonstrates decreased colony numbers upon YTHDF2 depletion in LFS astrocytes (n = 5 biologically independent samples). All colonies are counted and measured after 2-month culture. c Immunofluorescence staining of engrafted cerebral organoids in mouse cortices is used to determine organoid size and cell proliferation. Upper panel: Organoid engraftment is determined by the presence of human nuclear antigen (hNuclei) in mouse cortex and quantified by the percentage of stained (mouse or human) nuclei (DAPI) in the microscopic field staining for hNuclei. Lower panel: The proliferative human cells (STEM121+ cells) in engrafted organoids are determined by quantifying the percentage of Ki67 over DAPI (n = 4 biologically independent samples). Bar plots display the hNuclei+/DAPI+ and Ki67+/DAPI+ ratios. The boundary between organoids and mouse brain is shown as a dashed line. Scale bar, 100 µm. d SOX2 immunofluorescence staining indicates LFS cerebral organoids maintain progenitor characteristics in vivo (n = 4 biologically independent samples). Bar chart indicates the SOX2/DAPI ratio for each experimental condition. Scale bar, 100 µm. e IHC studies indicate elevated YTHDF2 expression in higher-grade gliomas. YTHDF2 expression is analyzed by IHC (n = 72 primary human glioma specimens). Representative specimens of different glioma grades are shown in the top panels. Scale bar, 25 µm. f Multiple glioma datasets suggest that high YTHDF2 expression is correlated with poor overall survival of glioma patients. Log-rank (Mantel–Cox) test is performed to compute significance. g Overall survival in p53 WT and mutant glioma patients with high or low YTHDF2 gene expression in TCGA GBM/LGG dataset. The data are presented as the mean ± SEM; one-way ANOVA with Tukey’s multiple comparison test (b); two-way ANOVA with Bonferroni’s multiple comparison test (a); unpaired two-tailed Student’s t test (c, d); *P < 0.05, **P < 0.01, ***P < 0.001. Source data and exact P values are provided in the Source Data file.
Fig. 3
Fig. 3. Genome occupancy and interactome studies reveal that mutant p53 cooperates with SVIL in regulating YTHDF2 expression.
a Heatmaps (left panels) depict the p53/mutant p53 genomic occupancies of p53-specific, mutant p53-specific, and shared peaks within 3 kb of peak centers according to p53 ChIP-seq. Composite plots (right panels) show normalized p53 and mutant p53 density distribution at promoters of genes within p53-specific, mutant p53-specific, and shared peaks. b Integrative Genomics Viewer (IGV) track views of H3K27ac, p53, and mutant p53 genome occupancy over p21 and YTHDF2 promoter regions in multiple WT and LFS astrocytes. c ChIP-qPCR validation of p53 and p53(G245D) binding peaks at the identified YTHDF2 promoter. p53/mutant p53 binding peak (blue) and upstream non-p53/mutant p53 binding regions (green) used for ChIP-qPCR validation (n = 3 biologically independent samples). d ChIP-qPCR indicates that p53 and various p53 mutants bind to the YTHDF2 promoter but not the upstream non-p53/mutant p53 binding region (n = 3 biologically independent samples). e EMSA demonstrates direct p53(G245D) binding to the YTHDF2 promoter. f Snapshot of p53 and mutant p53 interaction network. Connectivity map between p53 and mutant p53 interactomes in WT and LFS astrocytes. g p53(G245D) but not p53 interacts with SVIL exogenously. h Endogenous interaction between p53(G245D) and SVIL in LFS astrocytes. i Etoposide-induced WT p53 activation does not alter the interaction of p53(G245D) and SVIL in LFS astrocytes. j ChIP-qPCR indicates that knockdown of p53(G245D) hampers SVIL binding on the YTHDF2 promoter in LFS astrocytes (n = 3 biologically independent samples). k RT-qPCR analysis shows decreased YTHDF2 mRNA expression upon SVIL knockdown in LFS astrocytes but not WT astrocytes (n = 3 biologically independent samples). l RT-qPCR analysis demonstrates comparable YTHDF2 mRNA expression upon depletion of mutant p53, SVIL, and mutant p53/SVIL in LFS astrocytes (n = 3 biologically independent samples). m In vitro AIG assay demonstrates decreased colony numbers upon SVIL depletion in LFS astrocytes (n = 5 biologically independent samples). The results are representative of at least three independent experiments (e, gi). The data are presented as the mean ± SEM; two-way ANOVA with Bonferroni’s multiple comparison test (c, d, jm). ***P < 0.001. ns not significant. Source data and exact P values are provided in the Source Data file.
Fig. 4
Fig. 4. MLL1 is recruited by mutant p53/SVIL to activate YTHDF2 expression.
a Epigenomics Roadmap indicates that genes with H3K4me3 peaks in their promoter regions are enriched in LFS astrocytes. b Word clouds represent proteins inferred with high confidence to interact with SVIL in LFS astrocytes. c Endogenous interaction between SVIL and MLL1 in LFS-GFP-SVIL astrocytes. d PLA analysis indicates that endogenous mutant p53 forms a complex with SVIL and MLL1 in LFS astrocytes. Scale bar, 10 µm. e Depletion of SVIL impairs p53(G245D)/SVIL/MLL1 complex formation in LFS astrocytes. f Depletion of SVIL impairs mutant p53/SVIL/MLL1 complex formation. Scale bar, 10 µm. g H3K4me3 peaks on the YTHDF2 promoter are reduced upon MLL1 depletion or MLL1 inhibition by OICR-9429 in LFS astrocytes. h RT-qPCR analysis demonstrates decreased YTHDF2 mRNA expression upon MLL1 knockdown in LFS astrocytes but not WT astrocytes (n = 3 biologically independent samples). i Immunoblotting indicates reduced YTHDF2 protein upon the treatment with MLL1 inhibitors OICR-9429 and MI-2-2 in LFS astrocytes. j OICR-9429 and MI-2-2 selectively inhibit cell proliferation of LFS astrocytes (n = 5 biologically independent samples). k In vitro AIG assay demonstrates decreased colony numbers upon MLL1 depletion in LFS astrocytes (n = 5 biologically independent samples). l Ectopic YTHDF2 expression rescues SVIL or MLL1 knockdown-induced growth inhibition in LFS astrocytes (n = 6 biologically independent samples). m In vitro AIG assay demonstrates decreased colony numbers upon SVIL or MLL1 knockdown that are rescued by YTHDF2 expression (n = 3 biologically independent samples)). n Colony-forming assay demonstrates that OICR-9429 and MI-2-2 cause more severe growth inhibition of LNZ308-p53(G245D) cells than LNZ308-Vector cells (n = 3 biologically independent samples). o Images of WT (mCherry+) and LFS (GFP+) co-cultured cerebral organoids examined by light sheet fluorescence microscopy. Scale bar, 500 µm. p OICR-9429 selectively inhibits proliferation of the LFS-derived population of WT/LFS co-cultured cerebral organoids (n = 19 biologically independent samples). The results are representative of at least three independent experiments (cf, i, o). The data are presented as the mean ± SEM; two-way ANOVA with Bonferroni’s multiple comparison test (h, jn); unpaired two-tailed Student’s t test (p); ***P < 0.001. ns not significant. Source data and exact P values are provided in the Source Data file.
Fig. 5
Fig. 5. Identification of YTHDF2 targets via m6A MeRIP-seq, eCLIP-seq, and RNA-seq in LFS astrocytes.
a m6A MeRIP-seq indicates distribution of m6A peaks in different regions (5’UTR, first exon, other exon, and 3’UTR) of transcripts. Pie chart shows the percentage of m6A peaks within distinct regions of transcripts in LFS astrocytes. b Violin plot demonstrates significant elevation of highly m6A-marked transcripts upon YTHDF2 depletion. c Examination of YTHDF2 IP enrichment by eCLIP-seq. d Metagene plot of YTHDF2 eCLIP-seq indicates enrichment of YTHDF2-interacting mRNA peaks in the 3’UTR clustered around stop codons. e Motif analysis demonstrates that YTHDF2 binding motifs are similar to the consensus m6A motif RRACH. f Venn diagram identifying 84 YTHDF2-targeted m6A transcripts validated by a combination of m6A MeRIP-seq, YTHDF2 eCLIP-seq, and RNA-seq in LFS astrocytes. These transcripts include CDKN2B and SPOCK2 mRNAs. g IGV track views of m6A peaks located on CDKN2B and SPOCK2 transcripts in LFS astrocytes. h RT-qPCR indicates decreased expression of YTHDF2-targeted CDKN2B and SPOCK2 transcripts in LFS astrocytes (n = 3 biologically independent samples). i Low expression of YTHDF2-targeted CDKN2B and SPOCK2 is correlated with poor overall survival of LGG/GBM patients. Log-rank (Mantel–Cox) test is performed to compute significance. j Immunostaining demonstrates lower CDKN2B in engrafted LFS cerebral organoids (upper panel) and increased CDKN2B in YTHDF2-depleted engrafted LFS cerebral organoids (lower panel), Scale bar, 100 µm. Anti-CDKN2B antibodies only recognize human but not mouse CDKN2B proteins. k mRNA stability assay demonstrates that YTHDF2 knockdown leads to an increased half-life of CDKN2B and SPOCK2 mRNAs. shCtrl-LFS and shYTHDF2-LFS astrocytes are treated with actinomycin D and total RNAs are isolated at 0, 30, and 60 min. (n = 3 biologically independent samples). l RT-qPCR demonstrates elevated expression of YTHDF2 targets CDKN2B and SPOCK2 upon depletion of p53, YTHDF2, or SVIL as well as inhibition of MLL1 function by OICR-9429 or MI-2-2 in LFS astrocytes (n = 3 biologically independent samples). The results are representative of at least three independent experiments (c, j). The data are presented as the mean ± SEM); two-way ANOVA with Bonferroni’s multiple comparison test (l); unpaired two-tailed Student’s t test (h); multiple t test (k); **P < 0.01, ***P < 0.001. Source data and exact P values are provided in the Source Data file.
Fig. 6
Fig. 6. YTHDF2-mediated CDKN2B and SPOCK2 mRNA degradation contributes to mutant p53-associated malignancy.
a In vivo mouse xenograft study demonstrates that knockdown of YTHDF2, SVIL, or MLL1 hampers LNZ308-p53(G245D) tumor growth (n = 4 biologically independent mice). The sizes of the tumors were measured at the indicated time. b Expression of CDKN2B or SPOCK2 inhibits cell proliferation of LFS astrocytes (n = 6 biologically independent samples). c In vitro AIG assay demonstrates ectopic expression of CDKN2B or SPOCK2 leading to decreased colony numbers of LFS astrocytes. All colonies are counted and measured after 2-month culture (n = 6 biologically independent samples). d In vivo mouse xenograft study shows ectopic expression of CDKN2B or SPOCK2 abrogating LNZ308-p53(G245D) tumor growth (n = 3 biologically independent mice). The sizes of the tumors were measured at the indicated time. e Knockdown of CDKN2B or SPOCK2 rescues YTHDF2 depletion-induced growth inhibition in LFS astrocytes (n = 6 biologically independent samples). f In vitro AIG assay demonstrates knockdown of CDKN2B or SPOCK2 rescuing in vitro colony formation of YTHDF2-depleted LFS astrocytes. All colonies are counted and measured after 2-month culture (n = 6 biologically independent samples). g Xenograft study indicates that knockdown of CDKN2B or SPOCK2 rescues YTHDF2 knockdown-induced LNZ308-p53(G245D) tumor growth inhibition in nude mice (n = 4 biologically independent mice). The sizes of the tumors were measured at the indicated time. h Transcriptome analysis of CDKN2B-restored LFS astrocytes. Bubble plot for visualizing enriched GO and KEGG pathway analyses of differentially upregulated genes in CDKN2B-restored LFS astrocytes. X axis label represents the enrichment factor (number of differentially expressed genes enriched in the pathway/total number of genes in the pathway) and Y axis label represents GO annotation and KEGG pathway. Size and color of the bubble represent number of differentially expressed genes enriched in the GO or KEGG pathways and enrichment significance (P value), respectively. The data are presented as the mean ± SEM; two-way ANOVA with Bonferroni’s multiple comparison test (ag). *P < 0.05, ***P < 0.001. Source data and exact P values are provided in the Source Data file.
Fig. 7
Fig. 7. Clinical relevance of mutant p53 in regulating YTHDF2 expression and the prognostic value of YTHDF2 targets in glioma patients.
a Elevated YTHDF2 expression is observed in LFS stromal cells with a heterozygous M133T mutation but not LFS stromal cells with a heterozygous 12141delG frameshift mutation compared with WT stroma (n = 3 biologically independent samples). The data are presented as the mean ± SEM; unpaired two-tailed Student’s t test. *P < 0.05. b Box plots of TCGA RNA expression profiles (log2) in TCGA tumors with p53 WT or p53 hotspot missense mutations in LGG, GBM, BRCA, and READ specimens. Two-sided Mann Whitney Wilcoxon test is performed to compute significance. Tumors with a p53 hotspot missense mutation demonstrate decreased p21 and PUMA mRNA expression but elevated YTHDF2 mRNA expression. Box edges delineate lower and upper quartiles, the center line represents the median, and whiskers extend to 1.5 times the interquartile range. c Kaplan–Meier curves compare survival in LGG and GBM specimens with high or low levels of YTHDF2-targeted transcripts. Log-rank (Mantel–Cox) test is performed to compute significance. d Estimated hazard ratios and 95% confidence intervals for TCGA LGG and GBM patients expressing high levels of 20 YTHDF2-targeted genes. High expression of 13 of these 20 genes is positively associated with lower hazard ratios and increased survival with FDR q-value less than 5%. e A model linking the mutant p53/SVIL/MLL1 transcriptional regulatory complex to epitranscriptomic changes driving gliomagenesis. In our proposed model, mutant p53 interacts with SVIL, recruits MLL1 to the YTHDF2 promoter, and then induces YTHDF2 transcription. Elevated YTHDF2 downregulates numerous m6A-marked transcripts, including CDKN2B and SPOCK2, promotes neoplastic transformation and initiates gliomagenesis. MLL1 inhibitors selectively suppress YTHDF2 expression, LFS and mutant p53 cell survival, and neoplastic transformation. Source data and exact P values are provided in the Source Data file.

References

    1. Zhou R, et al. Li-Fraumeni syndrome disease model: a platform to develop precision cancer therapy targeting oncogenic p53. Trends Pharm. Sci. 2017;38:908–p927. doi: 10.1016/j.tips.2017.07.004. - DOI - PMC - PubMed
    1. Olive KP, et al. Mutant p53 gain of function in two mouse models of Li-Fraumeni syndrome. Cell. 2004;119:847–860. doi: 10.1016/j.cell.2004.11.004. - DOI - PubMed
    1. Lang GA, et al. Gain of function of a p53 hot spot mutation in a mouse model of Li-Fraumeni syndrome. Cell. 2004;119:861–872. doi: 10.1016/j.cell.2004.11.006. - DOI - PubMed
    1. Ostrom QT, et al. CBTRUS statistical report: primary brain and other central nervous system tumors diagnosed in the United States in 2012-2016. Neuro Oncol. 2019;21:v1–v100. doi: 10.1093/neuonc/noz150. - DOI - PMC - PubMed
    1. Zhang, Y. et al. The p53 pathway in glioblastoma. Cancers10, 297 (2018). - PMC - PubMed

Publication types

MeSH terms