. 2023 Mar 27;14(1):1709.
doi: 10.1038/s41467-023-37256-8.

Conserved transcription factors promote cell fate stability and restrict reprogramming potential in differentiated cells

Affiliations

Conserved transcription factors promote cell fate stability and restrict reprogramming potential in differentiated cells

Maria A Missinato et al. Nat Commun. .

Abstract

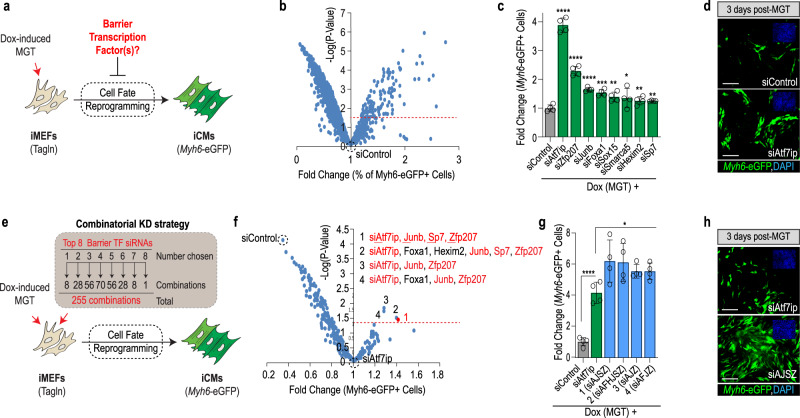
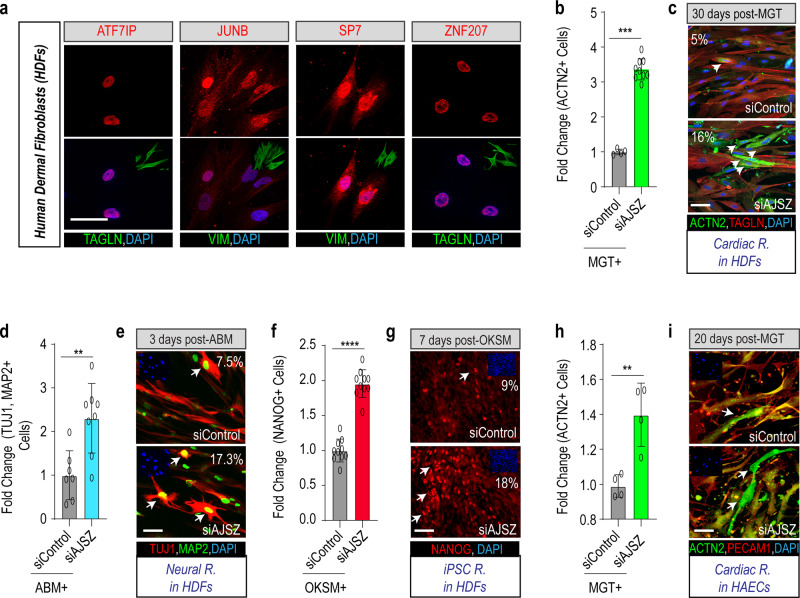
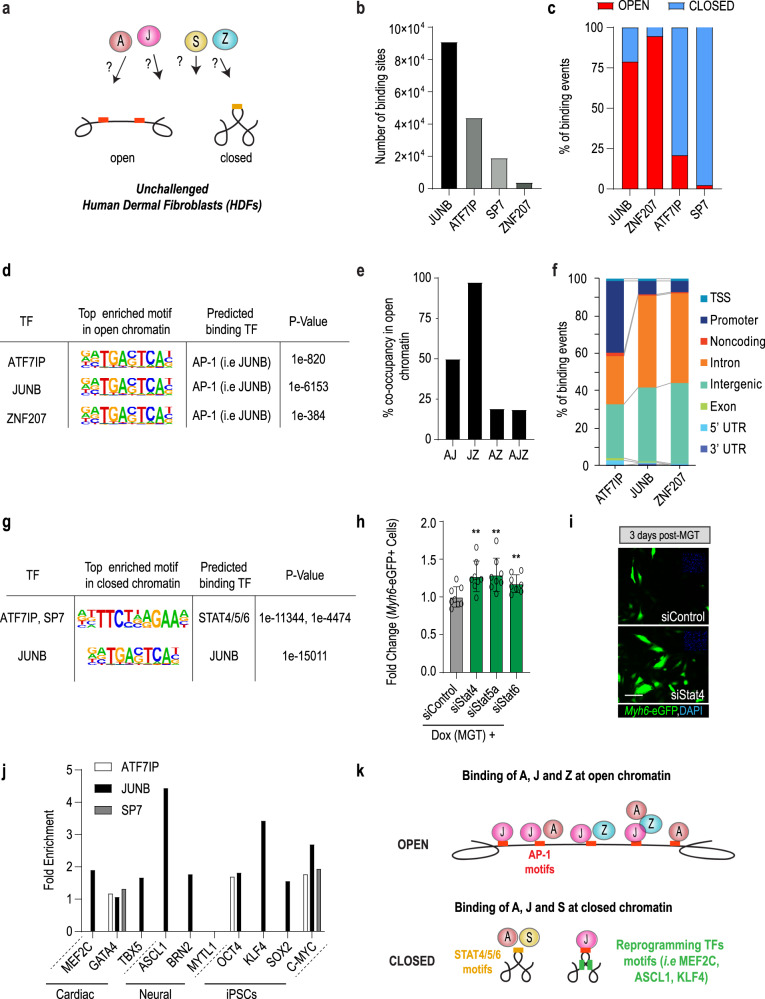
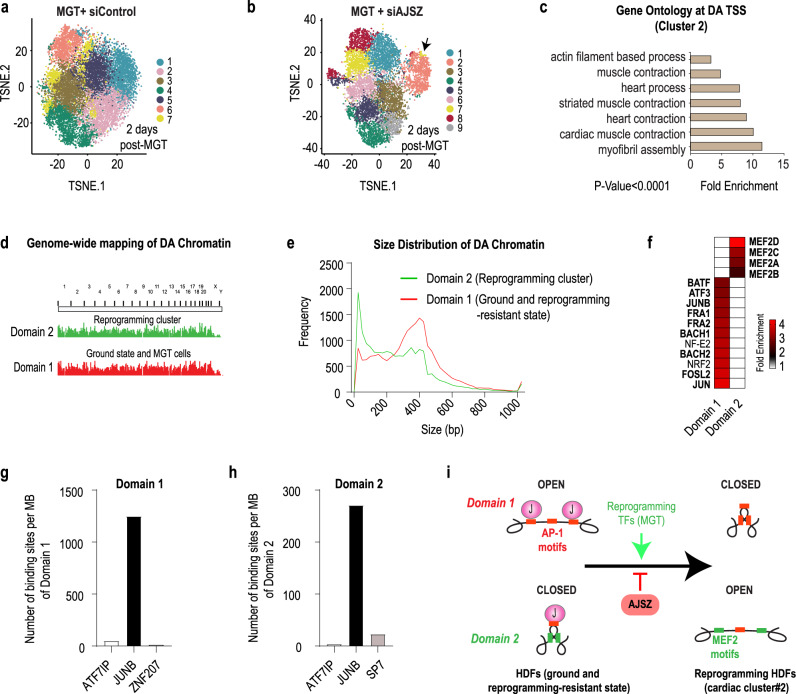
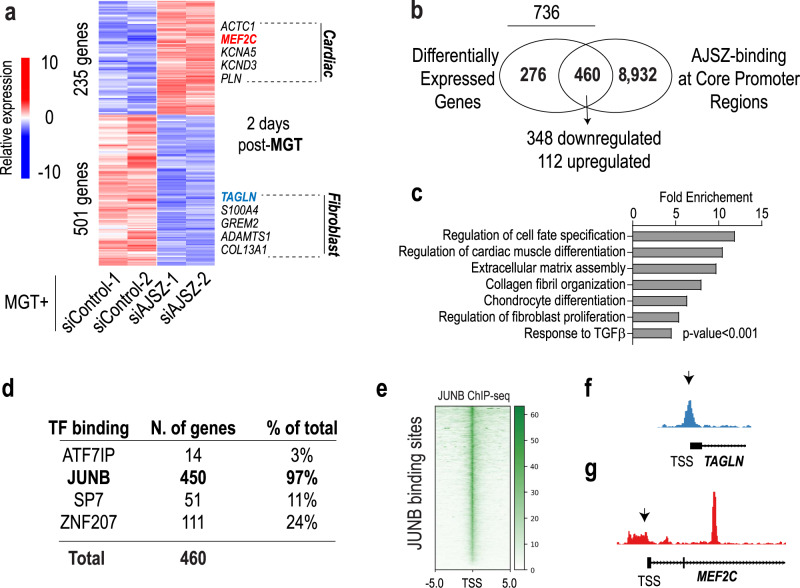
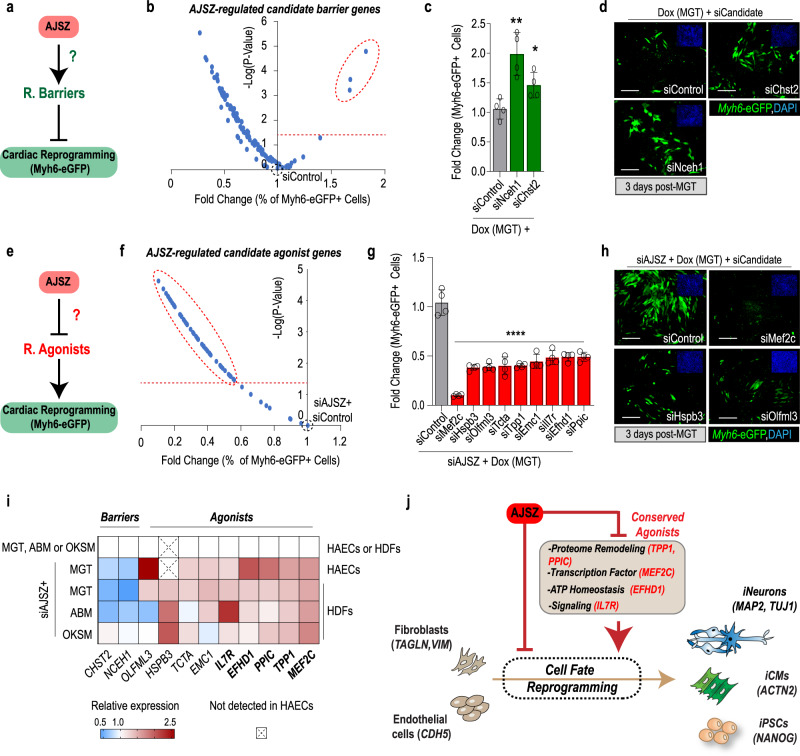
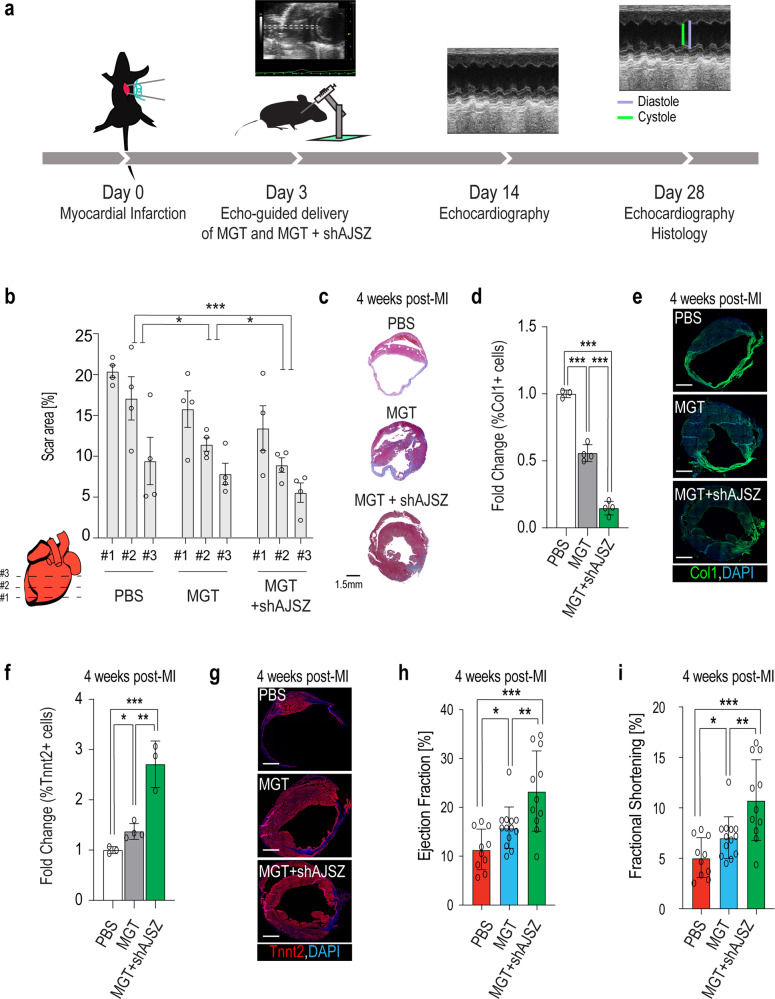
Defining the mechanisms safeguarding cell fate identity in differentiated cells is crucial to improve 1) - our understanding of how differentiation is maintained in healthy tissues or altered in a disease state, and 2) - our ability to use cell fate reprogramming for regenerative purposes. Here, using a genome-wide transcription factor screen followed by validation steps in a variety of reprogramming assays (cardiac, neural and iPSC in fibroblasts and endothelial cells), we identified a set of four transcription factors (ATF7IP, JUNB, SP7, and ZNF207 [AJSZ]) that robustly opposes cell fate reprogramming in both lineage and cell type independent manners. Mechanistically, our integrated multi-omics approach (ChIP, ATAC and RNA-seq) revealed that AJSZ oppose cell fate reprogramming by 1) - maintaining chromatin enriched for reprogramming TF motifs in a closed state and 2) - downregulating genes required for reprogramming. Finally, KD of AJSZ in combination with MGT overexpression, significantly reduced scar size and improved heart function by 50%, as compared to MGT alone post-myocardial infarction. Collectively, our study suggests that inhibition of barrier to reprogramming mechanisms represents a promising therapeutic avenue to improve adult organ function post-injury.


Conflict of interest statement

The authors declare no competing interests.

Figures

Fig. 1
Fig. 1. Genome-wide TF screen identifies Atf7ip, JunB, Sp7, and Zfp207 (ZNF207) as barriers to cell fate reprogramming.
a Schematic of the cardiac reprogramming assay and experimental rationale. b Volcano plot depicting genome-wide TF screen results. X-axis shows % of Myh6-EGFP + positive normalized to siControl. Y axis represents −log of P value as compared to siControl. The screen was run in experimental quadruplicate. c Validation of top 20 hits identifies eight siRNAs with confirmed activity. Student’s t-test: *p < 0.05, **p < 0.01, ***p < 0.001, and ****p < 0.0001. d Representative images of top hit siAtf7ip- and siControl-transfected iMGT-MEFs on day 3 after MGT induction. Myh6-eGFP is shown in green and nuclei are stained with DAPI (blue, top right insets). e Schematic of the combinatorial screening approach. A total of 255 combinations was tested, each in quadruplicate. f Volcano plot depicting genome-wide combinatorial screen results. Data were normalized and compared to the most potent single hit (siAtf7ip). 1–4 indicates top combinations that were significantly more potent than siAtf7ip alone (p < 0.05). siAtf7ip, siJunb, siSp7, and siZfp207 (siAJSZ) are shown in red. g Visualization of top 4 siRNA combinations in a histogram plot as in (c). h Representative images of iMGT-MEFs transfected with siAJSZ (siAtf7ip, siJunb, siSp7, and siZfp207) 3 days after MGT induction. n = 4 per condition for all data in this figure. Groups were compared using two-tailed unpaired analysis. Data in the figure are presented as mean values ±  standard deviation. Scale bars: 50 µm. a, e Schematics are modified from Cunningham, T. J. et al. Id genes are essential for early heart formation. Genes & development, 10.1101/gad.300400.117 (2017). - CC-BY 4.0.
Fig. 2
Fig. 2. Lineage- and cell type-independent role for AJSZ as barriers to reprogramming.
a Expression of AJSZ in HDFs. Immunostaining for AJSZ is shown in red and fibroblast markers Vimentin (VIM) or Transgelin (TAGLN) are shown in green. Nuclei are stained with DAPI. n = 4 per condition. b Quantification of the % of cardiac marker ACTN2-expressing cells normalized to MGT + siControl condition after 30 days of cardiac reprogramming in HDFs. n = 5 and n = 9 for siControl and siAJSZ treated, respectively. c Representative images of HDFs treated with MGT + siControl or MGT + siAJSZ and immunostained for cardiac (ACTN2, green) and fibroblast (TAGLN, red) markers. Nuclei are stained with DAPI (blue). White arrows indicate iCMs. d Quantification of the % of MAP2 (green) and TUJ1 (red)-double-positive cells, 3 days after overexpression of Ascl1, Brn2, and Mytl1 (ABM) in HDFs. n = 7 and n = 8 for siControl and siAJSZ treated, respectively. e Representative images of HDFs treated with ABM + siControl or ABM + siAJSZ and immunostained for MAP2 (green) and TUJ1 (red). Nuclei are stained with DAPI (blue, top left insets). White arrows indicate TUJ1 + MAP2 + double-positive cells = neurons. f Quantification of the % of NANOG-positive cells, 7 days after overexpression of OCT4, KLF4, SOX2, and cMYC (OKSM) in HDFs. n = 10 per condition. g Representative images of HDFs treated with OKSM + siControl or OKSM + siAJSZ and immunostained for pluripotent marker NANOG (red). Nuclei are stained with DAPI (blue, top left insets). White arrows indicate NANOG-positive cells= iPSCs. h Quantification of the % of ACTN2 + 20 days after MGT overexpression. i Representative images of HAECs treated with MGT + siControl or MGT + siAJSZ and immunostained for the endothelial marker (PECAM1, red) and the cardiac marker (ACTN2, green). n = 4 per condition. Nuclei are stained with DAPI (blue). White arrows indicate iCMs. Scale bars: 50 µm. Student’s t-test: *p < 0.05, **p < 0.01, ***p < 0.001, and ****p < 0.0001. Groups were compared using two-tailed unpaired analysis. Data in figure are presented as mean values ± standard deviation.
Fig. 3
Fig. 3. AJSZ binding properties in open and closed chromatin in HDFs.
a Chromatin binding properties of AJSZ in human dermal fibroblasts (HDFs) have not been characterized. b Number of binding sites determined by ChIP-seq for each factor. Peaks were merged from two samples. c Percentage of AJSZ binding sites located in open or closed chromatin. scATAC-seq was used to determine the state (open or closed) of the chromatin. d Top enriched motif in open chromatin bound by AJZ. e Co-occupancy analysis for AJZ at regions of open chromatin. f AJZ binding distribution at annotated regulatory regions in open chromatin. g Top enriched motifs in closed chromatin bound by AJS. h siStat4, 5a, or 6 respectively increase reprogramming efficiency as compared to siControl in iMGT-MEF assay. n = 8 biologically independent experiments for siControl and siStat4, 5a or 6 treated. Student’s t-test: **p < 0.01. Groups were compared using two-tailed unpaired. Data were presented as mean values ± standard deviation. i Representative images for siStat4 and siControl-transfected iMGT-MEFs 3 days post-Dox(MGT) treatment. Scale bars: 50 µm. j Motif analysis at regions of AJS-bound closed chromatin show enrichment for reprogramming TF motifs (i.e., MEF2C, ASCL1, and KLF4). k Schematic summarizing AJSZ binding properties at regions of open and closed chromatin in HDFs.
Fig. 4
Fig. 4. AJSZ regulate chromatin accessibility dynamics during cell fate reprogramming.
a, b t-SNE visualization of cell clusters after scATAC-seq of siControl-transfected HDFs 2 days after MGT overexpression (a), or siAJSZ-transfected HDFs 2 days after MGT overexpression (b). c GO term analysis for genes with differential accessibility transcriptional start sites (TSS) in cluster 2 vs remaining 8 clusters. d Topological mapping of domains 1 and 2 in regard to their chromosomal location. e Size distribution of differentially accessible chromatin regions in domains 1 and 2. f Most differentially enriched TF motifs in domain 1 as compared to 2 and conversely. g, h AJSZ binding density in domain 1 (g) and 2 (h) at ground state in HDFs. i Model summarizing the role of AJSZ in the regulation of chromatin accessibility during cell fate reprogramming.
Fig. 5
Fig. 5. AJSZ proximally regulates gene expression during cell fate reprogramming.
a Heatmap of differentially expressed (DE) genes in siControl- and siAJSZ-transfected HDFs 2 days after MGT overexpression b Venn diagram showing the overlap between DE and core promoter-bound (−1 kb-TSS- +0.1 kb) genes. 460 genes were both DE and bound by AJSZ at core promoter regions, including 348 downregulated and 112 upregulated genes. c Bar charts showing top-ranked biological terms enriched for the 460 DE and core promoter-bound genes. d Breakdown of the percentage of DE and core promoter-bound genes containing ATF7IP, JUNB, SP7, or ZNF207 binding sites. e ChIP-seq tracks for JUNB binding sites. f, g Genome browser views showing JUNB binding at TAGLN (f) and at MEF2C core promoter regions (g) in HDFs.
Fig. 6
Fig. 6. AJSZ control reprogramming barriers and agonists expression.
a Schematic depicting the hypothesis that AJSZ promotes the expression of reprogramming barriers. b Volcano plot showing the screening results for siRNAs directed against top 25 percentile downregulated (MGT + siAJSZ vs MGT) and core promoter-bound genes in the iMGT-MEF CR assay. The top three candidate barrier genes are circled. n = 4 per condition. c Histogram showing validation of siNceh1 and siChst2 effect on CR. n = 8 per condition. d Representative images for siControl, siChst2, and siNceh1 conditions. Myh6-eGFP+ cells are shown in green and cell nuclei are stained blue (DAPI, top right insets). e Schematic depicting the hypothesis that AJSZ negatively regulates reprogramming agonists. f Volcano plot showing the screening results for siRNAs directed against the top 25 percentile of upregulated (MGT + siAJSZ vs MGT) and core promoter-bound genes in siAJSZ-induced iMGT-MEF assay. g Histogram showing validation of top nine siRNAs that blunt siAJSZ-induced CR without affecting cell viability. n = 4 per condition. h Representative images for siAJSZ+ siControl, siMef2c, siHspb3, or siOlfml3 conditions. i Heatmap summarizing AJSZ expression dependence of identified barriers and agonists in HAECs and HDFs, 2 days after MGT, ABM, or OKSM overexpression. j Model showing that AJSZ regulates cell fate reprogramming by controlling the expression of a conserved set reprogramming agonists. Scale bars: 50 µm. Student’s t-test. *p < 0.05, **p < 0.01, and ****p < 0.0001. Groups were compared using two-tailed unpaired analysis. Data in the figure are presented as mean values ± standard deviation. j Schematic is modified from Cunningham, T. J. et al. Id genes are essential for early heart formation. Genes & development, 10.1101/gad.300400.117 (2017). - CC-BY 4.0.
Fig. 7
Fig. 7. shAJSZ enhances MGT’s ability to improve heart function post-MI.
a Schematic depicting the experimental strategy to test the role of AJSZ on heart function post-MI. b, d, f Quantification of scar area (b), fibrosis (d), and cardiac content (f) in PBS, MGT, and MGT + shAJSZ conditions 4 weeks after MI. n = 4 per condition. c, e, g Representative histological heart sections after Masson trichrome staining (scar area) Scale bar: 1.5 mm (c), Col1 (fibrosis) (e), and Tnnt2 (cardiac content) (g) staining in PBS, MGT, or MGT + shAJSZ conditions. DAPI is shown in blue. h Ejection fraction (EF) and i fractional shortening (FS) of the left ventricle were serially quantified by echocardiography in mice injected with PBS, MGT, and MGT + shAJSZ 4 weeks after MI. Cardiac function was improved with MGT + shAJSZ as compared to PBS or MGT conditions. For EF and FS quantification: PBS-treated mice n = 10, MGT-treated mice n = 13, and MGT + shAJSZ treated mice n = 11. Groups were compared using two-tailed unpaired. Scale bars: 1.5 mm. *P < 0.05, **P < 0.01, and ***P < 0.001. Data in the figure are presented as mean values ± standard deviation.

References

    1. Yadav T, Quivy JP, Almouzni G. Chromatin plasticity: a versatile landscape that underlies cell fate and identity. Science. 2018;361:1332–1336. doi: 10.1126/science.aat8950. - DOI - PubMed
    1. Gurdon JB, Elsdale TR, Fischberg M. Sexually mature individuals of Xenopus laevis from the transplantation of single somatic nuclei. Nature. 1958;182:64–65. doi: 10.1038/182064a0. - DOI - PubMed
    1. Davis RL, Weintraub H, Lassar AB. Expression of a single transfected cDNA converts fibroblasts to myoblasts. Cell. 1987;51:987–1000. doi: 10.1016/0092-8674(87)90585-X. - DOI - PubMed
    1. Takahashi K, Yamanaka S. Induction of pluripotent stem cells from mouse embryonic and adult fibroblast cultures by defined factors. Cell. 2006;126:663–676. doi: 10.1016/j.cell.2006.07.024. - DOI - PubMed
    1. Xu J, Du Y, Deng H. Direct lineage reprogramming: strategies, mechanisms, and applications. Cell Stem Cell. 2015;16:119–134. doi: 10.1016/j.stem.2015.01.013. - DOI - PubMed

Publication types

MeSH terms

Substances