

Analysis of spatial-temporal dynamic distribution and related factors of tuberculosis in China from 2008 to 2018
- PMID: 36973322
- PMCID: PMC10041483
- DOI: 10.1038/s41598-023-31430-0
Analysis of spatial-temporal dynamic distribution and related factors of tuberculosis in China from 2008 to 2018
Abstract
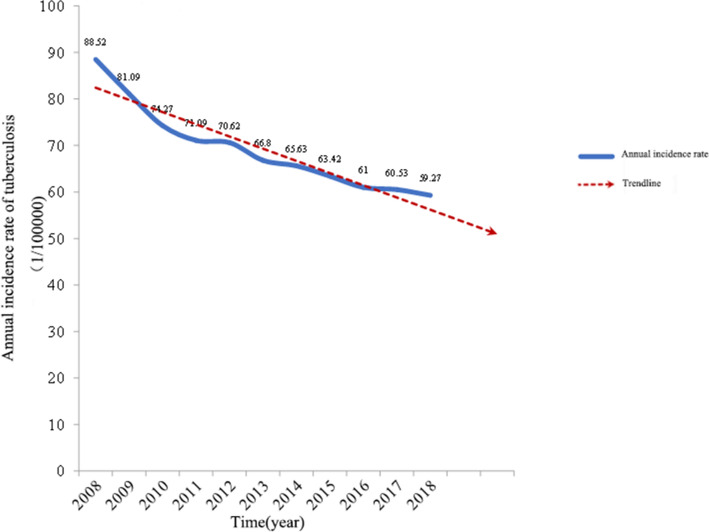
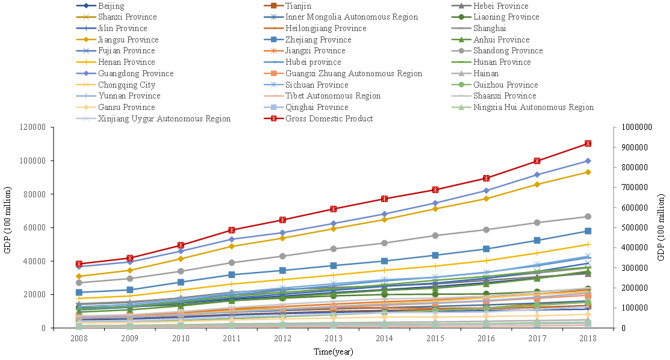
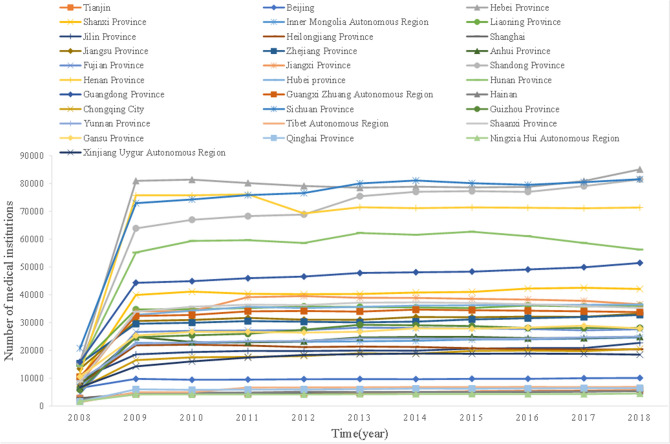
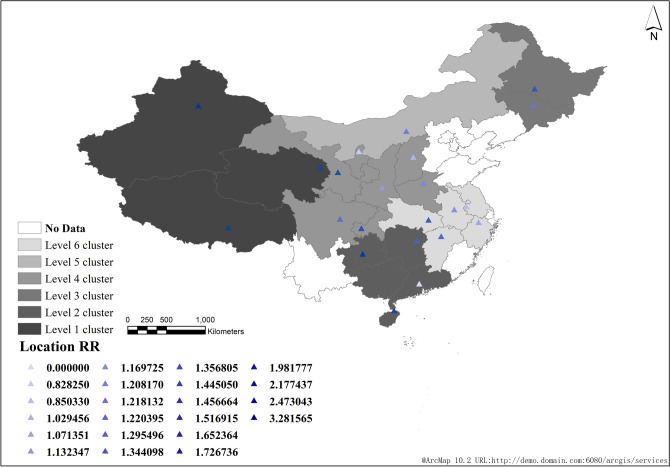
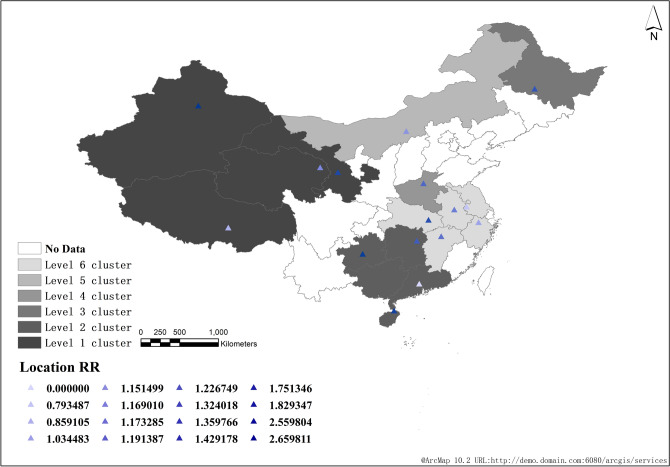
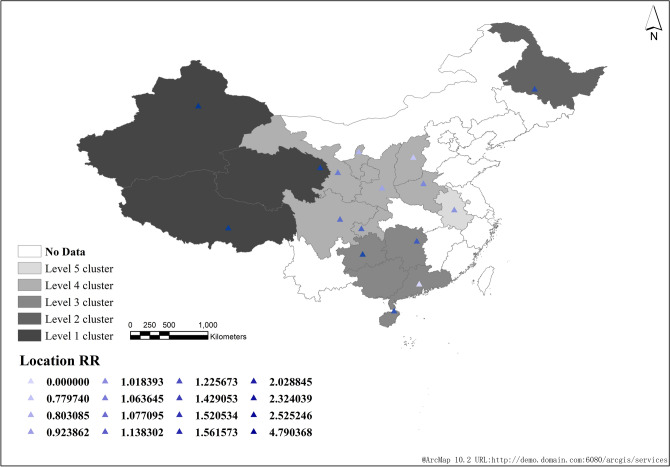
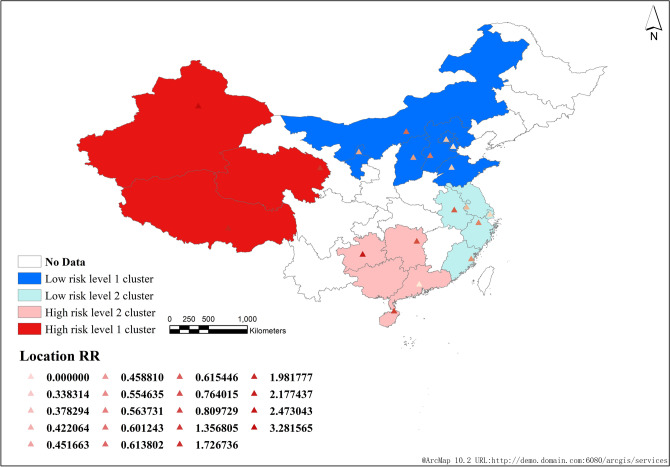
Through spatial-temporal scanning statistics, the spatial-temporal dynamic distribution of pulmonary tuberculosis incidence in 31 provinces and autonomous regions of China from 2008 to 2018 is obtained, and the related factors of spatial-temporal aggregation of tuberculosis in China are analyzed to provide strong scientific basis and data support for the prevention and control of pulmonary tuberculosis. This is a retrospective study, using spatial epidemiological methods to reveal the spatial-temporal clustering distribution characteristics of China's tuberculosis epidemic from 2008 to 2018, in which cases data comes from the China Center for Disease Control and prevention. Office Excel is used for general statistical description, and the single factor correlation analysis adopts χ2 Test (or trend χ2 Inspection). Retrospective discrete Poisson distribution space time scanning statistics of SaTScan 9.6 software are used to analyze the space time dynamic distribution of tuberculosis incidence in 31 provinces, cities and autonomous regions in China from 2008 to 2018. ArcGIS 10.2 software is used to visualize the results. The global spatial autocorrelation analysis adopts Moran's I of ArcGIS Map(Monte Carlo randomization simulation times of 999) is used to analyze high-risk areas, low-risk areas and high-low risk areas. From 2008 to 2018, 10,295,212 cases of pulmonary tuberculosis were reported in China, with an average annual incidence rate of 69.29/100,000 (95% CI: (69.29 ± 9.16)/100,000). The annual GDP (gross domestic product) of each province and city showed an upward trend year by year, and the number of annual medical institutions in each province and city showed a sharp increase in 2009, and then tended to be stable; From 2008 to 2018, the national spatiotemporal scanning statistics scanned a total of 6 clusters, including 23 provinces and cities. The national high-low spatiotemporal scanning statistics of the number of pulmonary tuberculosis cases scanned a total of 2 high-risk and low-risk clusters. The high-risk cluster included 8 provinces and cities, and the low-risk cluster included 12 provinces and cities. The global autocorrelation Moran's I index of the incidence rate of pulmonary tuberculosis in all provinces and cities was greater than the expected value (E (I) = -0.0333); The correlation analysis between the average annual GDP and the number of pulmonary tuberculosis cases in each province and city from 2008 to 2018 was statistically significant. From 2008 to 2018, the spatial and temporal scanning and statistical scanning areas of tuberculosis incidence in China were mainly concentrated in the northwest and southern regions of China. There is an obvious positive spatial correlation between the annual GDP distribution of each province and city, and the aggregation degree of the development level of each province and city is increasing year by year. There is a correlation between the average annual GDP of each province and the number of tuberculosis cases in the cluster area. There is no correlation between the number of medical institutions set up in each province and city and the number of pulmonary tuberculosis cases.
© 2023. The Author(s).
Conflict of interest statement
The authors declare no competing interests.
Figures
References
-
- The Global Tuberculosis Report 2022. https://www.who.int/teams/global-tuberculosis-programme/tb-reports/globa....
-
- Lixia W, Shiming C, Mingting C, et al. The fifth national tuberculosis epidemiological survey in 2010. Chin. J. Antituberculo. 2012;34(08):485–508.
-
- Zhang H, Wang W-X, Su J-J, et al. Temporal spatial distribution and characteristics of tuberculosis incidence rate and gender and age changes in Nanjing Infectious. Dis. Inf. 2022;35(02):144–150.
-
- Sun Y-H, Tian M-Z, Nie Y-W, et al. Application of spatial panel data model in the analysis of national tuberculosis surveillance data from 2015 to 2019. Chin. Prev. Med. 2022;23(06):436–441.
-
- Gao J, Du J. Temporal and spatial characteristics of pulmonary tuberculosis based on spatial epidemiology. Modern Preventive Medicine. 2018;45(15):2694–2696.
Publication types
MeSH terms
LinkOut - more resources
Full Text Sources
Medical
