. 2023 Mar 27;3(1):25.
doi: 10.1038/s43705-023-00231-x.

Linking prokaryotic genome size variation to metabolic potential and environment

Affiliations

Linking prokaryotic genome size variation to metabolic potential and environment

Alejandro Rodríguez-Gijón et al. ISME Commun. .

Abstract

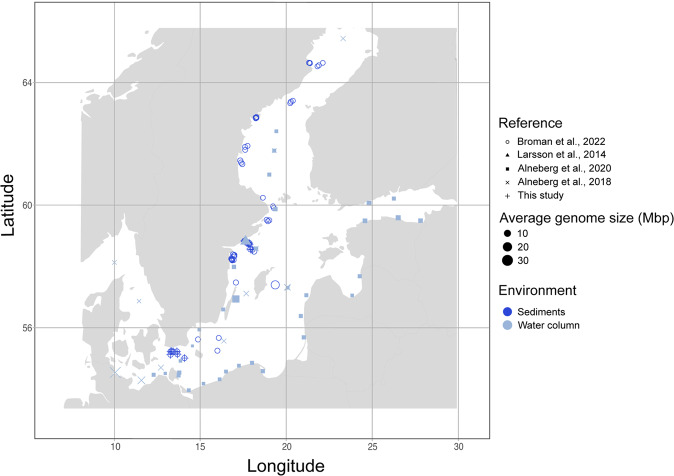
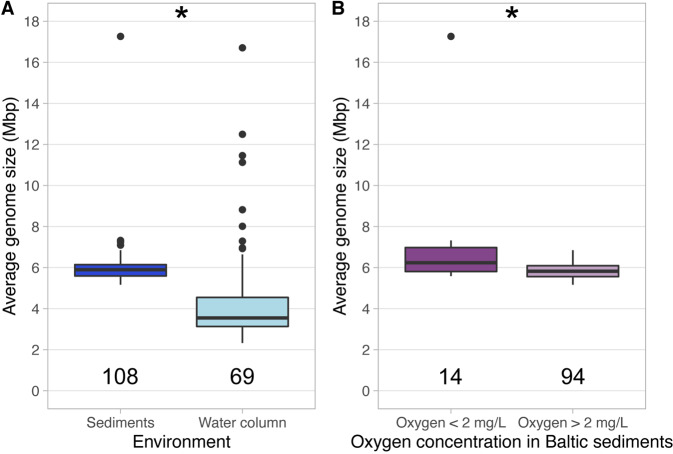
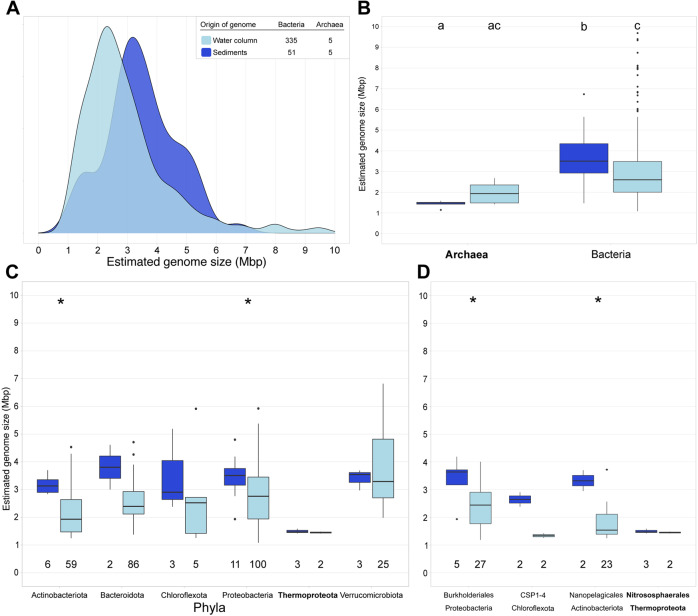
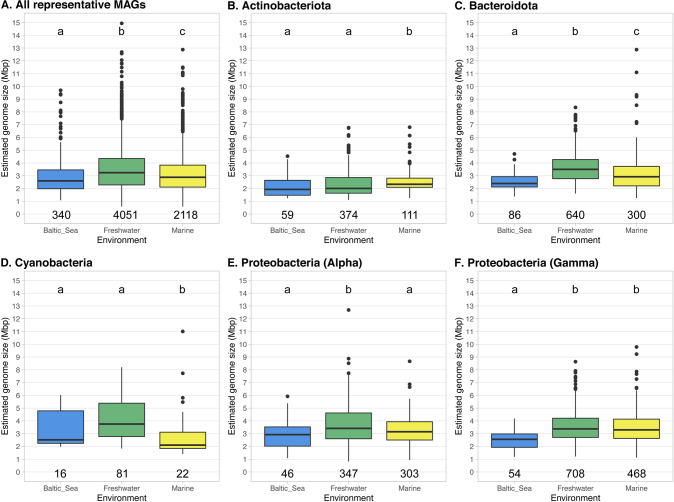
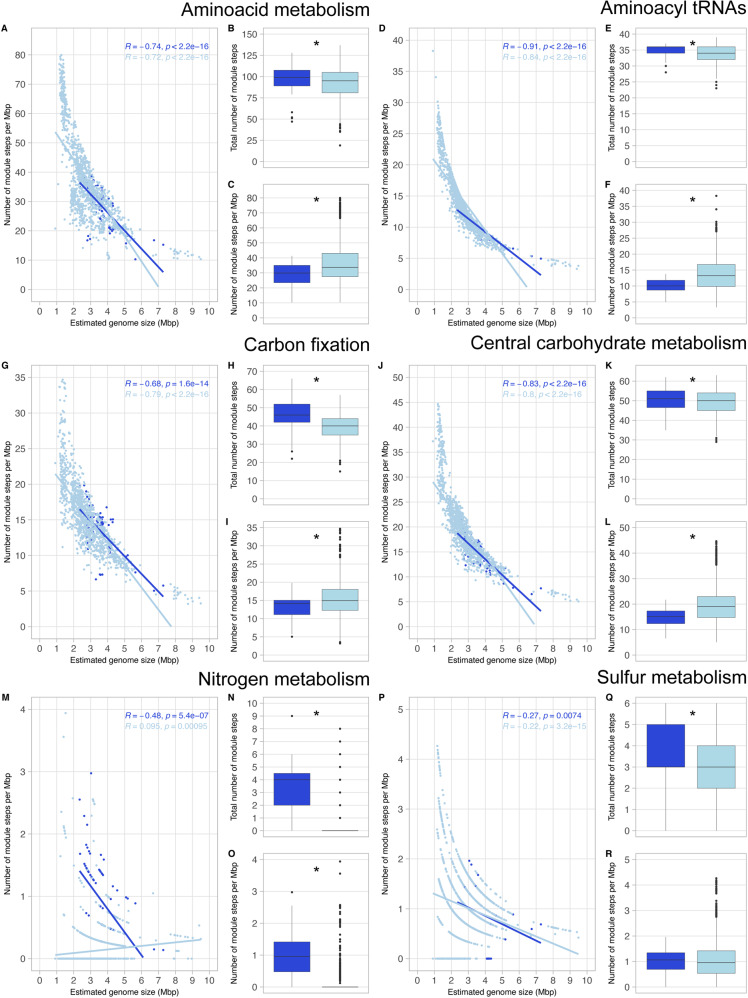
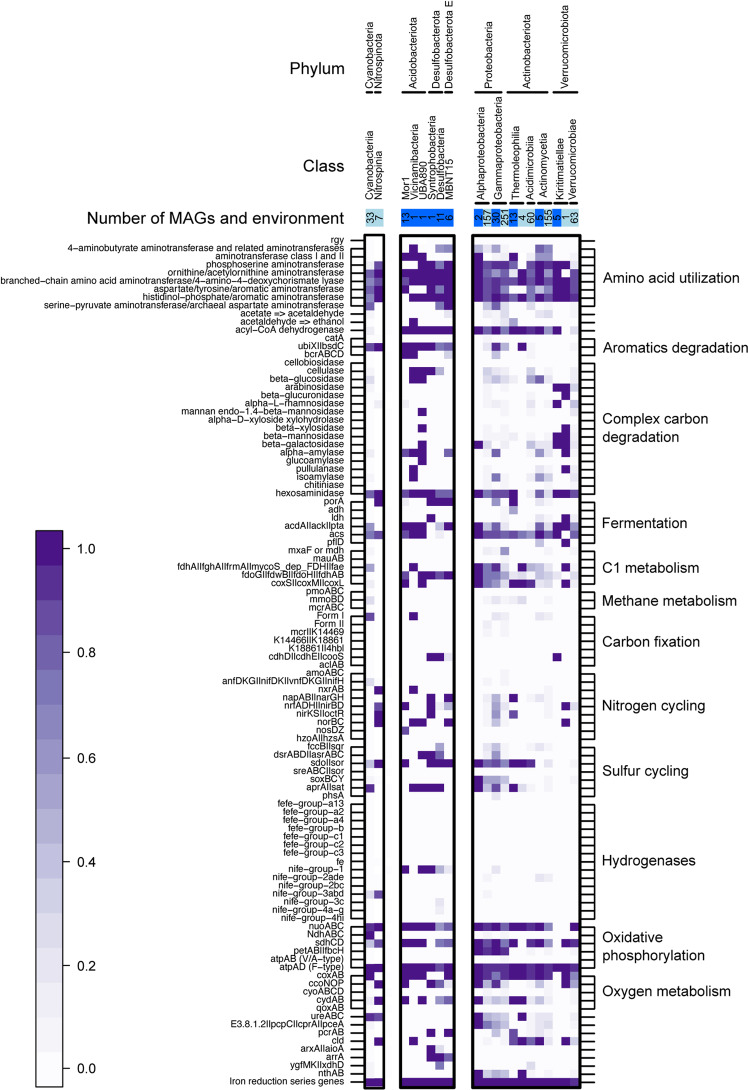
While theories and models have appeared to explain genome size as a result of evolutionary processes, little work has shown that genome sizes carry ecological signatures. Our work delves into the ecological implications of microbial genome size variation in benthic and pelagic habitats across environmental gradients of the brackish Baltic Sea. While depth is significantly associated with genome size in benthic and pelagic brackish metagenomes, salinity is only correlated to genome size in benthic metagenomes. Overall, we confirm that prokaryotic genome sizes in Baltic sediments (3.47 Mbp) are significantly bigger than in the water column (2.96 Mbp). While benthic genomes have a higher number of functions than pelagic genomes, the smallest genomes coded for a higher number of module steps per Mbp for most of the functions irrespective of their environment. Some examples of this functions are amino acid metabolism and central carbohydrate metabolism. However, we observed that nitrogen metabolism was almost absent in pelagic genomes and was mostly present in benthic genomes. Finally, we also show that Bacteria inhabiting Baltic sediments and water column not only differ in taxonomy, but also in their metabolic potential, such as the Wood-Ljungdahl pathway or the presence of different hydrogenases. Our work shows how microbial genome size is linked to abiotic factors in the environment, metabolic potential and taxonomic identity of Bacteria and Archaea within aquatic ecosystems.


Conflict of interest statement

The authors declare no competing interests.

Figures

Fig. 1
Fig. 1. Overview of the sampling locations and average genome size (AGS) of metagenomes (108 from sediments in dark blue, and 111 from the water column in light blue).
This figure shows the geographic location of all metagenomes used in this study. For exact coordinates see Table S1. Shape type indicates the reference and shape size indicates the AGS of the given metagenome.
Fig. 2
Fig. 2. Boxplots showing the AGS distribution of Baltic metagenomes.
A Indicates the AGS distribution in both water column and sediments. B Indicates the AGS distribution in metagenomes from sediments across the oxygen gradient (two groups, from 0 to 2 and from 2 to 12.45 mg/L). Stars in both panels indicate significant differences p < 0.05 (Wilcoxon non-parametric test).
Fig. 3
Fig. 3. Overview of the estimated genome size in bacteria and archaea obtained from Baltic Sea sediments (dark blue) and water column (light blue) using only the 397 representative MAGs (95% average nucleotide identity) with >75% completeness.
A Shows the genome size distribution of archaea and bacteria obtained from Baltic water column and sediments for a total of 397 representative genomes. B Shows the estimated genome size per domain and environment. Different letters indicate significant differences p < 0.05 (Kruskal-Wallis non-parametric test; multiple testing corrected with Benjamini-Hochberg). C Shows the estimated genome size per phylum. We selected only phyla with at least 2 MAGs in each environment. D Shows the estimated genome size per order. We selected only orders with at least 2 MAGs in each environment. Numbers below the boxes indicate the number of MAGs per environment. Stars in Panel C and D indicate significant differences p < 0.05 (Wilcoxon non-parametric test).
Fig. 4
Fig. 4. Overview of the estimated genome size of pelagic Bacteria and Archaea obtained from Baltic Sea (blue), freshwater (green) and marine (yellow) using only representative MAGs (calculates using 95% average nucleotide identity) with >75% completeness.
We compare all representative MAGs (A), only phylum Actinobacteriota (B), phylum Bacteroidota (C), phylum Cyanobacteria (D), class Alphaproteobacteria (E) and class Gammaproteobacteria (F). Different letters indicate significant differences p < 0.05 (Kruskal-Wallis non-parametric test; multiple testing corrected with Benjamini-Hochberg). Numbers below the boxes indicate the number of MAGs per environment.
Fig. 5
Fig. 5. Overview of the presence of module steps for six metabolic categories.
The analyzed metabolic capabilities include amino acid metabolism (AC), aminoacyl tRNAs (DF), carbon fixation (GI), central carbohydrate metabolism (JL), nitrogen metabolism (MO) and sulfur metabolism (PR). We used all bacterial MAGs with very-high quality (>90% completeness and <5% contamination), from both environments (99 MAGs from sediments and 1215 MAGs from water column). Stars in boxplots indicate significant differences p < 0.05 (Wilcoxon non-parametric test). B, E, H, K, N and Q indicate total number of module steps. C, F, I, L, O and R indicate the number of module steps per Mbp.
Fig. 6
Fig. 6. Metabolic potential of all high-quality MAGs (>90% completeness and <5% contamination).
We selected all phyla with at least 5 MAGs, and then divided by class. Boxes on the top of the figure indicate environment (pelagic in light blue and sediments in dark blue), and inner numbers indicate the number of MAGs per category. In the heatmap, white squares indicate absence of a given gene in all MAGs, and the darkest purple indicates presence in all of them (gradient scale on the bottom-left part of the figure for reference).

Similar articles

Cited by

References

    1. Kirchberger PC, Schmidt ML, Ochman H. The ingenuity of bacterial genomes. Annu Rev Microbiol. 2020;74:815–34. doi: 10.1146/annurev-micro-020518-115822. - DOI - PubMed
    1. Rodríguez-Gijón A, Nuy JK, Mehrshad M, Buck M, Schulz F, Woyke T, et al. A genomic perspective across Earth’s microbiomes reveals that genome size in Archaea and Bacteria is linked to ecosystem type and trophic strategy. Front Microbiol. 2022;12:761869. doi: 10.3389/fmicb.2021.761869. - DOI - PMC - PubMed
    1. Lynch M. Streamlining and simplification of microbial genome architecture. Annu Rev Microbiol. 2006;60:327–49. - PubMed
    1. Giovannoni SJ, Cameron Thrash J, Temperton B. Implications of streamlining theory for microbial ecology. ISME J. 2014;8:1553–65. doi: 10.1038/ismej.2014.60. - DOI - PMC - PubMed
    1. Kuo CH, Moran NA, Ochman H. The consequences of genetic drift for bacterial genome complexity. Genome Res. 2009;19:1450–4. doi: 10.1101/gr.091785.109. - DOI - PMC - PubMed