. 2023 May;28(5):2136-2147.
doi: 10.1038/s41380-023-02020-3. Epub 2023 Mar 27.

Altered behavior, brain structure, and neurometabolites in a rat model of autism-specific maternal autoantibody exposure

Affiliations

Altered behavior, brain structure, and neurometabolites in a rat model of autism-specific maternal autoantibody exposure

Matthew R Bruce et al. Mol Psychiatry. 2023 May.

Abstract

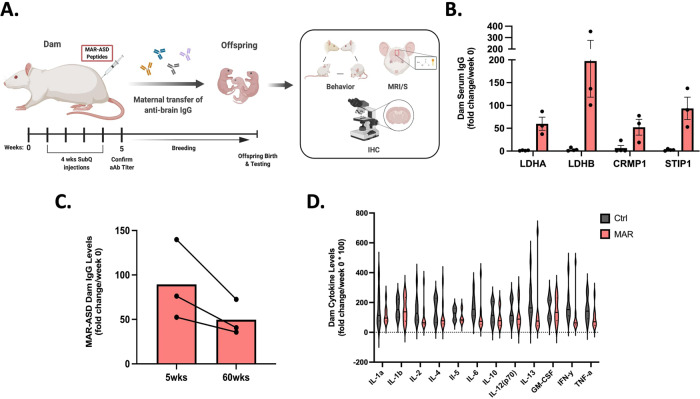
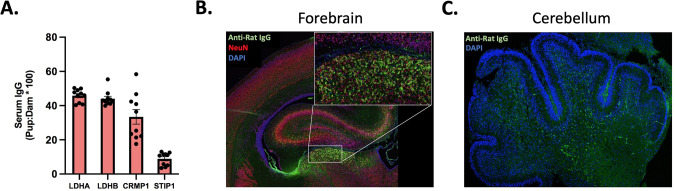
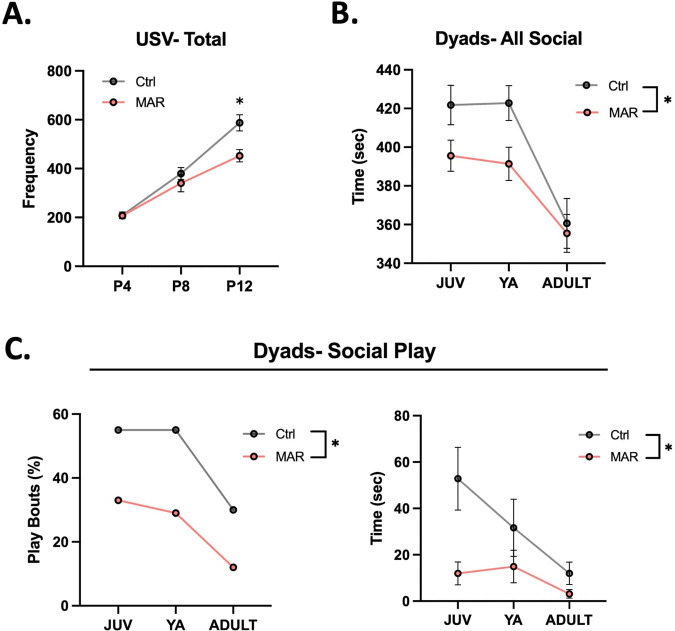
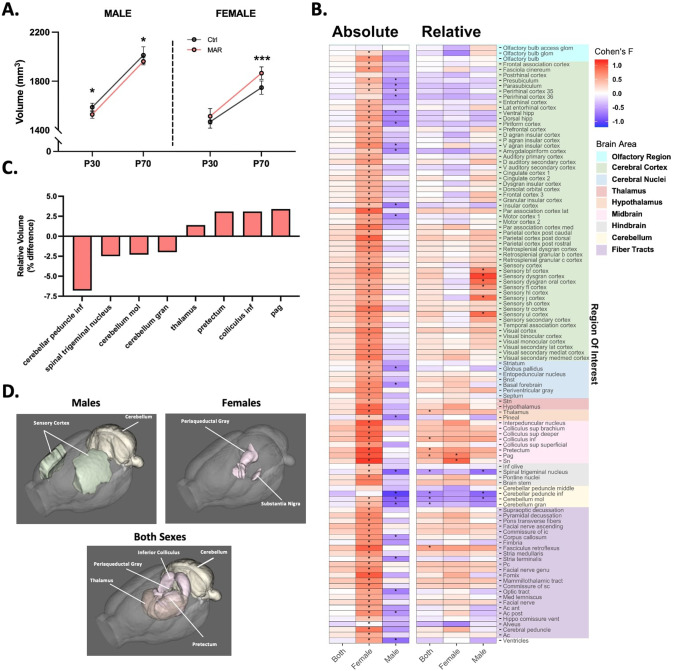
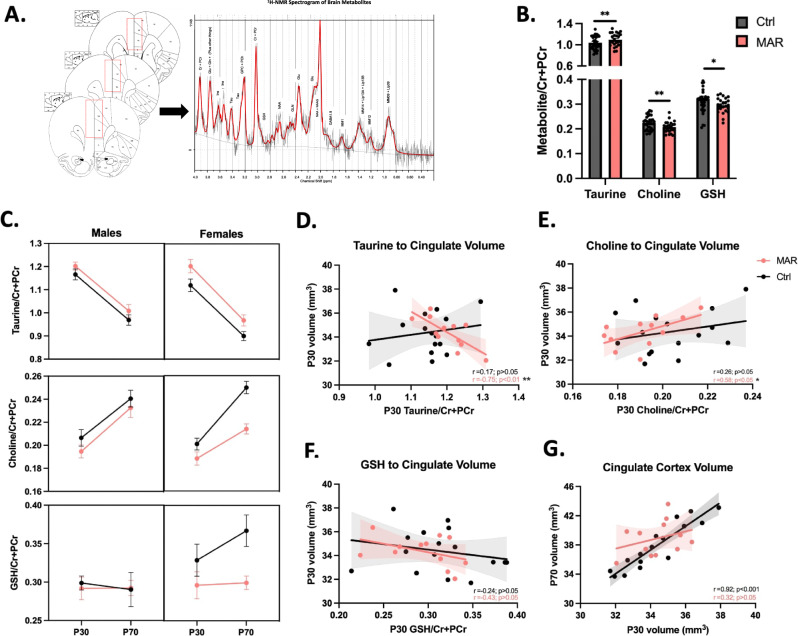
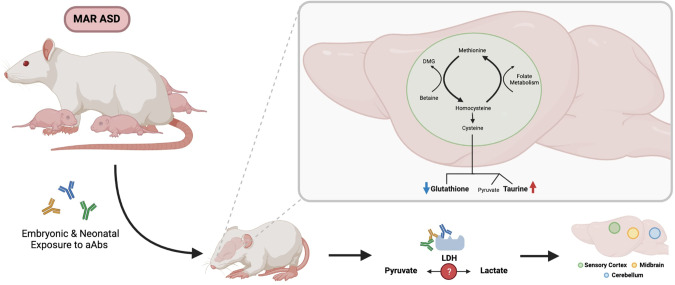
Maternal immune dysregulation is a prenatal risk factor for autism spectrum disorder (ASD). Importantly, a clinically relevant connection exists between inflammation and metabolic stress that can result in aberrant cytokine signaling and autoimmunity. In this study we examined the potential for maternal autoantibodies (aAbs) to disrupt metabolic signaling and induce neuroanatomical changes in the brains of exposed offspring. To accomplish this, we developed a model of maternal aAb exposure in rats based on the clinical phenomenon of maternal autoantibody-related ASD (MAR-ASD). Following confirmation of aAb production in rat dams and antigen-specific immunoglobulin G (IgG) transfer to offspring, we assessed offspring behavior and brain structure longitudinally. MAR-ASD rat offspring displayed a reduction in pup ultrasonic vocalizations and a pronounced deficit in social play behavior when allowed to freely interact with a novel partner. Additionally, longitudinal in vivo structural magnetic resonance imaging (sMRI) at postnatal day 30 (PND30) and PND70, conducted in a separate cohort of animals, revealed sex-specific differences in total and regional brain volume. Treatment-specific effects by region appeared to converge on midbrain and cerebellar structures in MAR-ASD offspring. Simultaneously, in vivo 1H magnetic resonance spectroscopy (1H-MRS) data were collected to examine brain metabolite levels in the medial prefrontal cortex. Results showed that MAR-ASD offspring displayed decreased levels of choline-containing compounds and glutathione, accompanied by increased taurine compared to control animals. Overall, we found that rats exposed to MAR-ASD aAbs present with alterations in behavior, brain structure, and neurometabolites; reminiscent of findings observed in clinical ASD.


Conflict of interest statement

JVW has a patent application involving the MAR-ASD peptides described herein and has a UC Davis-based startup company focusing on the development of the MAR-ASD autoantibody profile as a risk assessment for a child developing ASD. All other authors have no conflicts of interest to declare.

Figures

Fig. 1
Fig. 1. MAR-ASD autoantibody production in rat dams.
A Autoantibody production is induced in rat dams through injection with autism-specific autoantigen peptides. Antibody can then transfer to offspring and influence developmental outcomes. B Levels of serum IgG Ab reactive to MAR-ASD proteins (LDHA/B, STIP1, CRMP1) in rat dams compared between aAb and control animals. Values expressed as fold-change over baseline (week 0) following 4 weeks of injections. C Longitudinal characterization of MAR-ASD IgG persistence in serum from treated dams at 5 weeks and 60 weeks following initial immunization. ELISA data representative of single experiments. D Serum cytokine levels in MAR-ASD and control dams taken 1 week prior to breeding. Data expressed as fold change over baseline (week 0). N = 3 per condition for each experiment, data are expressed as mean ± SEM. Analysis conducted by two-way ANOVA, representative of a single experiment.
Fig. 2
Fig. 2. Transfer of MAR-ASD aAb to offspring.
A Levels of serum IgG reactive to MAR ASD protein targets in exposed offspring at PND2. Data represent offspring ELISA reactivity expressed as a percentage of dam levels. N = 10 pups, representative of a single experiment with data expressed as mean ± SEM. Representative IHC images of IgG reactivity in the brain of PND2 MAR-ASD offspring in both the Forebrain (B) and Cerebellum (C). Tissue labeled and imaged across multiple experiments. Magnification ×20 objective.
Fig. 3
Fig. 3. MAR-ASD aAb exposure alters offspring behavior.
A Total ultrasonic vocalizations (USVs) recorded at each timepoint, graphed longitudinally by treatment (MAR; N = 48, Ctrl; N = 40). B Time spent engaged in social behavior during the social dyads task, measured in seconds and compared between MAR-ASD (MAR) and control (Ctrl) animals. Data are expressed as mean ± SEM, *p < 0.05. C Proportion of social play bouts by treatment (MAR; JUV (0.33, 95% CI’s = 0.16, 0.55), YA (0.33, 95% CI’s = 016, 0.55), ADULT (0.12, 95% CI’s = 0.03, 0.32), Ctrl; JUV (0.55, 95% CI’s = 0.31, 0.77), YA (0.55, 95% CI’s = 0.31, 0.77), ADULT (0.3, 95% CI’s = 0.12, 0.54) as well as total time spent engaged in social play behavior. Data expressed as mean ± SEM, *p < 0.05. Data expressed as mean ± SEM, *p < 0.05. MAR; N = 24; Ctrl; N = 20 for BC. Behavioral data analyzed using linear mixed effects models with data collected across multiple experiments.
Fig. 4
Fig. 4. Altered regional brain volume in MAR-ASD offspring.
A Total brain volume (mm3) in MAR-ASD and Ctrl offspring in both sexes at PND30 and PND70. Data represented as mean ± SD, *p < 0.05, ***p < 0.001. MAR ASD; N = 6/sex, Ctrl; N = 8/sex. B Heatmap plot of absolute and relative regional volumetric differences in MAR-ASD offspring collapsed between time points. Heatmap scale corresponds to Cohen’s F values for the comparisons between MAR-ASD and Ctrl animals for each region. Columns represent data either from both sexes combined (“Both”), or each sex independently. Starred (*) fields represent those comparisons that differed significantly between treatment groups and had a false discovery ratio (FDR) below 5%. Colored blocks on the right y-axis correspond to regional grouping by larger brain areas. Imaging data were analyzed by two-way ANOVA with 5% FDR correction. C Graph of brain regions displaying differences by treatment using relative volumetric analysis. Data expressed as percent change with values collapsed between time point and sex. D Visual representation of brain regions displaying relative volumetric differences in MAR-ASD offspring compared to control animals in males, females, or both sexes combined. Spinal trigeminal nucleus not pictured due to orientation of rendering. Also, subregions within brain area are not broken down (i.e., sensory dysgranular cortex in males) to reduce complexity. All regions are detailed in Supplementary Table 2.
Fig. 5
Fig. 5. MAR-ASD exposure alters neurometabolite levels in the mPFC.
A Diagram detailing anatomical location of voxel placement with rat brain atlas as a backdrop. Also depicted is a representative 1H-NMR spectrogram output that was used for model fitting and analysis. B Metabolites found to differ significantly in response to treatment including taurine, choline, and glutathione (GSH). C Metabolite differences split by sex for each metabolite. Metabolite data were collected and analyzed at the time of MR scanning, PND30 and PND70. Data correspond to mean ± SEM analyzed using repeated measures regression analysis, *p < 0.05, **p < 0.01. MAR-ASD; N = 6/sex, Ctrl; N = 8/sex. Graphs depicting the relationship between metabolite levels and volume of the voxel region at P30 for taurine (D), choline (E), and GSH (F). G Correlation between cingulate cortex volume at PND30 and PND70 graphed by treatment. Pearson’s r value and related test statistic reported as the result of correlational analysis (DG). 1H-MRS data were collected across imaging sessions with two timepoints per animal.
Fig. 6
Fig. 6. Schematic depicting the effects of MAR-ASD aAb exposure on offspring.
Antibodies generated by dams transfer to offspring during gestation and impact molecules involved in the cysteine metabolic pathway. This could be the result of aAb effects on target proteins or those involved in this pathway thereby affecting the homeostatic balance and potentially leading to the noted changes in brain volume.

References

    1. American Psychiatric Association. Diagnostic and statistical manual of mental disorders. American Psychiatric Association; Arlington, VA; 2013.
    1. Horder J, Petrinovic MM, Mendez MA, Bruns A, Takumi T, Spooren W, et al. Glutamate and GABA in autism spectrum disorder—a translational magnetic resonance spectroscopy study in man and rodent models. Transl Psychiatry. 2018;8:106. doi: 10.1038/s41398-018-0155-1. - DOI - PMC - PubMed
    1. Giulivi C, Zhang Y-F, Omanska-Klusek A, Ross-Inta C, Wong S, Hertz-Picciotto I, et al. Mitochondrial dysfunction in autism. JAMA. 2010;304:2389. doi: 10.1001/jama.2010.1706. - DOI - PMC - PubMed
    1. Orozco JS, Hertz-Picciotto I, Abbeduto L, Slupsky CM. Metabolomics analysis of children with autism, idiopathic-developmental delays, and Down syndrome. Transl Psychiatry. 2019;9:243. doi: 10.1038/s41398-019-0578-3. - DOI - PMC - PubMed
    1. Qiu S, Qiu Y, Li Y, Cong X. Genetics of autism spectrum disorder: an umbrella review of systematic reviews and meta-analyses. Transl Psychiatry. 2022;12:249. doi: 10.1038/s41398-022-02009-6. - DOI - PMC - PubMed

Publication types