. 2023 May;7(5):698-706.
doi: 10.1038/s41559-023-02013-z. Epub 2023 Mar 27.

Current levels of microplastic pollution impact wild seabird gut microbiomes

Affiliations

Current levels of microplastic pollution impact wild seabird gut microbiomes

Gloria Fackelmann et al. Nat Ecol Evol. 2023 May.

Abstract

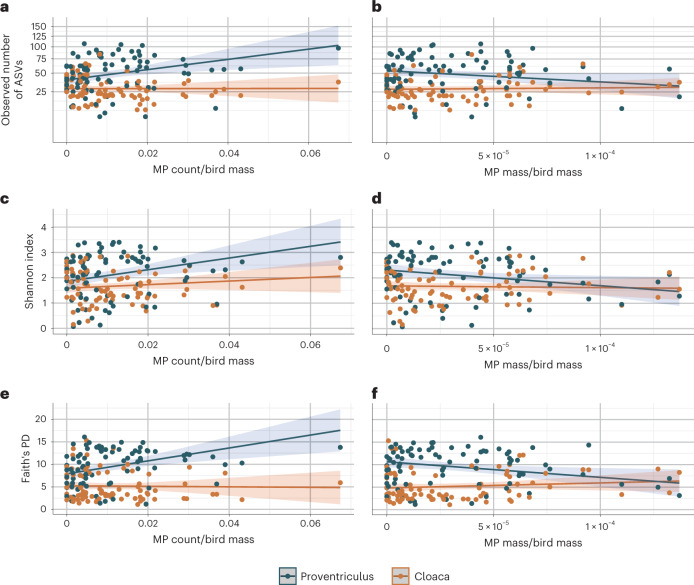
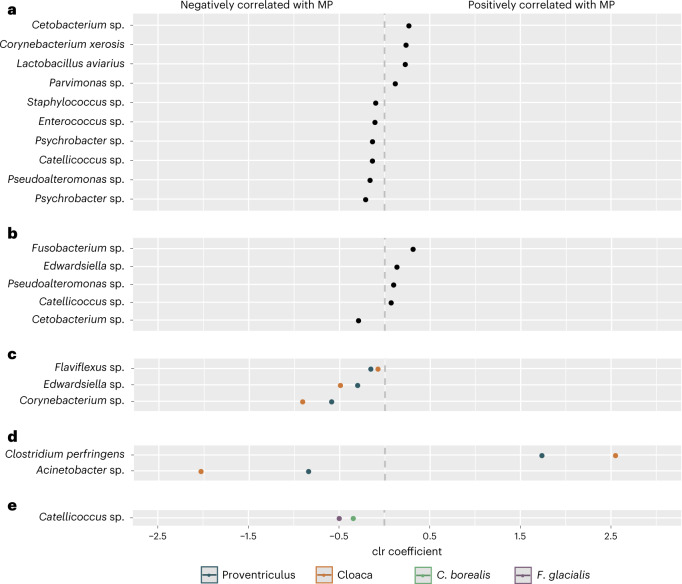
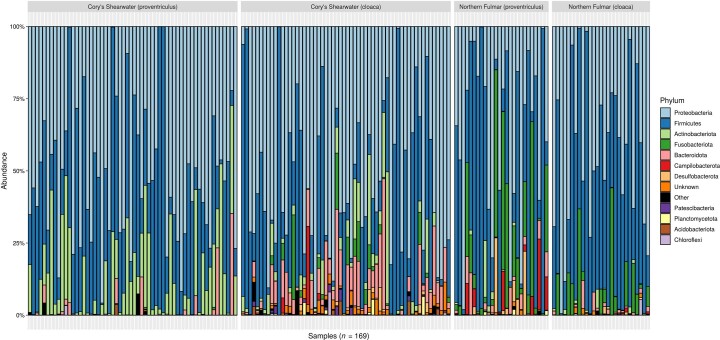
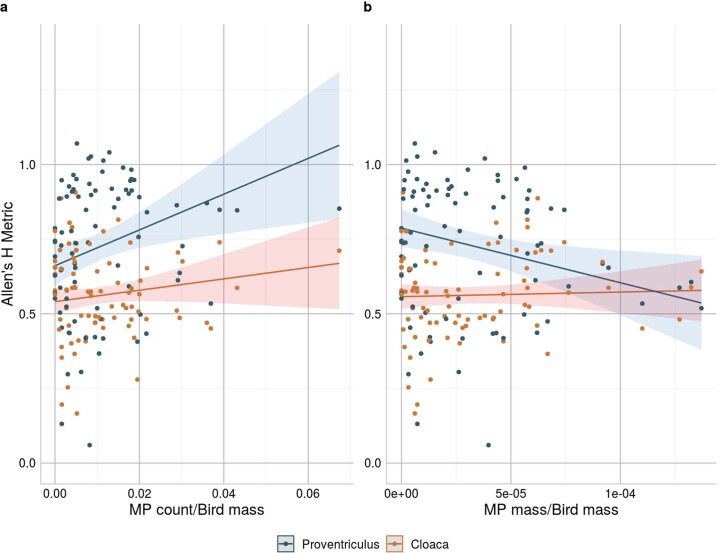
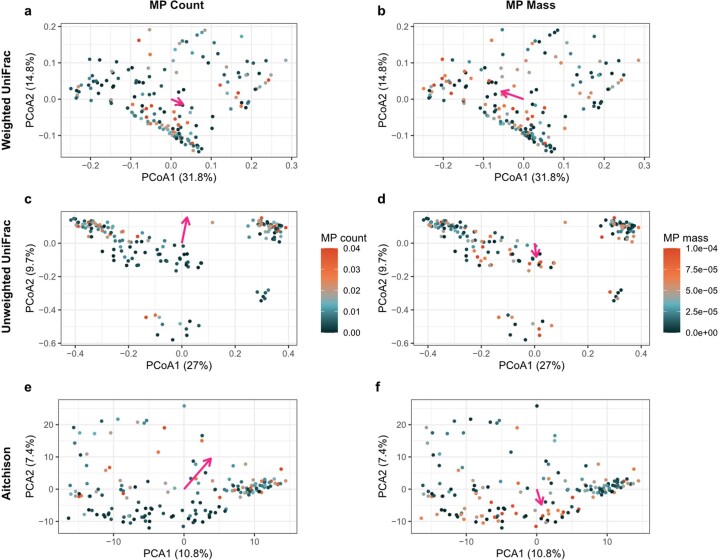
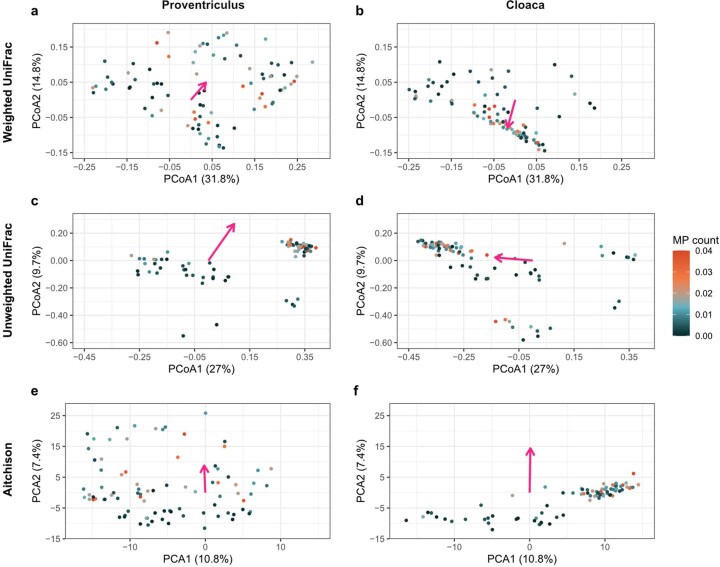
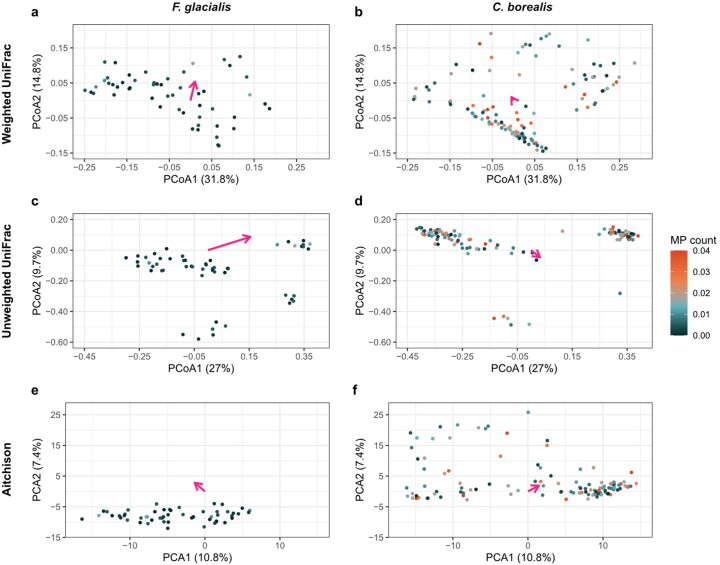
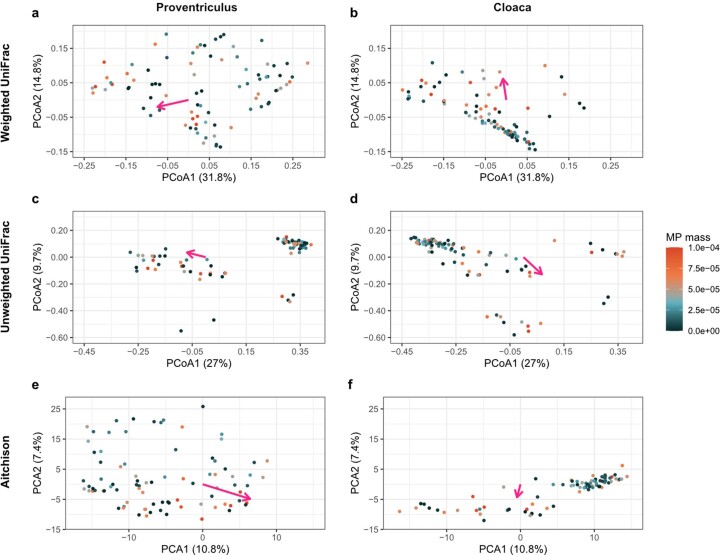
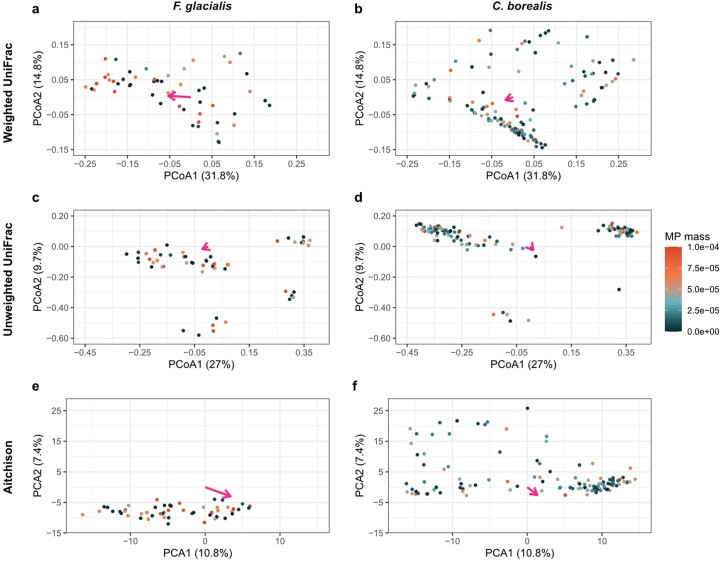
Microplastics contaminate environments worldwide and are ingested by numerous species, whose health is affected in multiple ways. A key dimension of health that may be affected is the gut microbiome, but these effects are relatively unexplored. Here, we investigated if microplastics are associated with changes in proventricular and cloacal microbiomes in two seabird species that chronically ingest microplastics: northern fulmars and Cory's shearwaters. The amount of microplastics in the gut was significantly correlated with gut microbial diversity and composition: microplastics were associated with decreases in commensal microbiota and increases in (zoonotic) pathogens and antibiotic-resistant and plastic-degrading microbes. These results illustrate that environmentally relevant microplastic concentrations and mixtures are associated with changes in gut microbiomes in wild seabirds.


Conflict of interest statement

The authors declare no competing interests.

Figures

Fig. 1
Fig. 1. Correlations between microplastics (MP) and the alpha diversity of the proventricular and cloacal microbiomes in northern fulmar and Cory’s shearwater individuals.
af, Each dot represents a microbiome sample that is coloured by the location within the GIT, either from the proventricular (blue dots, n = 85) or cloacal microbiome (orange dots, n = 84). Alpha diversity metrics: observed number of ASVs (note that the scale is non-linear due to the square root transformation of the alpha diversity values) (a and b), Shannon index (c and d) and Faith’s PD (e and f) are plotted in relation to the proportion of MP counts (MP count/individual bird mass; left) and the proportion of MP mass (MP mass/individual bird mass; right). The lines in each plot denote the predicted values based on the linear mixed model for that alpha diversity metric, and the shaded areas flanking the lines indicate the upper and lower 95% confidence intervals.
Fig. 2
Fig. 2. Differentially abundant ASVs associated with microplastics (counts and mass) identified by ANCOM.
ae, Each dot represents an ASV plotted by its taxonomic assignment on the y axis and in decreasing order of its centred log-ratio (clr) coefficient on the x axis. Thus, dots to the right of centre zero show a positive correlation with microplastics, whereas dots to the left show a negative correlation. Plotted ASVs were identified as differentially abundant by ANCOM (at w0 = 0.70) according to microplastic count (a), microplastic mass (b), the interaction between microplastic count and sample type (blue dots represent the proventriculus, red dots represent the cloaca) (c), the interaction between microplastic mass and sample type (blue dots represent the proventriculus, orange dots represent the cloaca) (d) and the interaction between microplastic counts and species (green dots represent Cory’s shearwaters, purple dots represent northern fulmars) (e). ANCOM identified 17 differentially abundant ASVs; however, 21 dots are shown here because 3 of the 17 ASVs are associated with microplastic counts (a) as well as microplastic mass (b; annotated as Catellicoccus sp., Cetobacterium sp. and Pseudoalteromonas sp.) and one ASV is associated with both microplastic mass (b) and the interaction between microplastic counts and sample type (c; annotated as Edwardsiella sp.).
Extended Data Fig. 1
Extended Data Fig. 1. Sampling location and distribution of the study species C. borealis and F. glacialis.
Cory’s shearwaters were collected at the edge of the North Atlantic subtropical gyre on the Azores archipelago (Portugal; dark green dot; distribution shown in green) and northern fulmars were collected near Qikiqtarjuaq, Nunavut in the Northwest Atlantic (dark purple dot; distribution shown in purple).
Extended Data Fig. 2
Extended Data Fig. 2. Microbiota composition at the phylum rank for the proventricular and cloacal microbiomes of Cory’s shearwaters and northern fulmars.
The phyla within each sample (n = 169 samples obtained from 85 individual seabirds) are plotted by their relative abundance on the y-axis. Low-abundance phyla (prevalence < 0.1 and abundance < 10) are grouped together and labelled as “Other”.
Extended Data Fig. 3
Extended Data Fig. 3. Correlations between microplastics (MP) and the alpha diversity of the proventricular and cloacal microbiomes in northern fulmar and Cory’s shearwater individuals.
Each dot represents a microbiome sample that is colored by the location within the GIT, either from the proventricular (blue dots, n = 85) or cloacal microbiome (orange dots, n = 84). Alpha diversity metric Allen’s H metric is plotted in relation to a the proportion of MP counts (MP count/individual bird mass) and b the proportion of MP mass (MP mass/individual bird mass). The lines in each plot denote the predicted values based on the linear mixed model for the alpha diversity metric and the shaded areas flanking the lines indicate the upper and lower 95% confidence intervals.
Extended Data Fig. 4
Extended Data Fig. 4. Ordination plots showing the correlations between microplastic (MP) count and mass and seabird GIT microbial beta diversity.
Principle coordinate analysis (PCoA) ordination plots with a,b weighted UniFrac distances, c,d unweighted UniFrac distances, and e,f principle component analysis (PCA) ordination plots with Euclidean distances (Aitchison’s approach). Each dot represents a microbiome sample colored on a continuous scale by (a,c,e) the proportion of MP count (MP count/individual bird mass; n = 169) and (b,d,f) the proportion of MP mass (MP mass/individual bird mass; n = 169) and magenta arrows show the direction of the MP effects.
Extended Data Fig. 5
Extended Data Fig. 5. Ordination plots showing the correlations beween MP count and seabird proventricular versus cloacal microbial beta diversity.
PCoA plots with a,b weighted UniFrac distances, c,d unweighted UniFrac distances, and e,f PCA plots with Euclidean distances (Aitchison’s approach) illustrate the effects of MP counts on seabird proventricular (a,c,e; n = 85) versus cloacal (b,d,f; n = 84) microbial beta diversity. Each dot represents a microbiome sample colored on a continuous scale by the proportion of MP count (MP count/individual bird mass) and magenta arrows show the direction of the MP effects.
Extended Data Fig. 6
Extended Data Fig. 6. Ordination plots showing the correlations between MP count and northern fulmar versus Cory’s shearwater GIT microbial beta diversity.
PCoA plots with a,b weighted UniFrac distances, c,d unweighted UniFrac distances, and e,f PCA plots with Euclidean distances (Aitchison’s approach) illustrate the effects of MP count on GIT microbial beta diversity in northern fulmars (a,c,e; n = 27) versus Cory’s shearwaters (b,d,f; n = 58). Each dot represents a microbiome sample colored on a continuous scale by the proportion of MP count (MP count/individual bird mass) and magenta arrows show the direction of the MP effects.
Extended Data Fig. 7
Extended Data Fig. 7. Ordination plots showing the correlations between MP mass and seabird proventricular versus cloacal microbial beta diversity.
PCoA plots with a,b weighted UniFrac distances, c,d unweighted UniFrac distances, and e,f PCA plots with Euclidean distances (Aitchison’s approach) illustrate the effects of MP mass on seabird proventricular (a,c,e; n = 85) versus cloacal (b,d,f; n = 84) microbial beta diversity. Each dot represents a microbiome sample colored on a continuous scale by the proportion of MP mass (MP mass/individual bird mass) and magenta arrows show the direction of the MP effects.
Extended Data Fig. 8
Extended Data Fig. 8. Ordination plots showing the correlations between MP mass and northern fulmar versus Cory’s shearwater GIT microbial beta diversity.
PCoA plots with a,b weighted UniFrac distances, c,d unweighted UniFrac distances, and e,f PCA plots with Euclidean distances (Aitchison’s approach) illustrate the effects of MP mass on GIT microbial beta diversity in northern fulmars (a,c,e; n = 27) versus Cory’s shearwaters (b,d,f; n = 58). Each dot represents a microbiome sample colored on a continuous scale by the proportion of MP mass (MP mass /individual bird mass) and magenta arrows show the direction of the MP effects.

Comment in

Similar articles

Cited by

References

    1. Street ME, Bernasconi S. Microplastics, environment and child health. Ital. J. Pediatr. 2021;47:47–49. doi: 10.1186/s13052-021-01034-3. - DOI - PMC - PubMed
    1. Fackelmann G, Sommer S. Microplastics and the gut microbiome: how chronically exposed species may suffer from gut dysbiosis. Mar. Pollut. Bull. 2019;143:193–203. doi: 10.1016/j.marpolbul.2019.04.030. - DOI - PubMed
    1. Anbumani S, Kakkar P. Ecotoxicological effects of microplastics on biota: a review. Environ. Sci. Pollut. Res. 2018;25:14373–14396. doi: 10.1007/s11356-018-1999-x. - DOI - PubMed
    1. Zilber-Rosenberg I, Rosenberg E. Role of microorganisms in the evolution of animals and plants: the hologenome theory of evolution. FEMS Microbiol. Rev. 2008;32:723–735. doi: 10.1111/j.1574-6976.2008.00123.x. - DOI - PubMed
    1. Valdes AM, Walter J, Segal E, Spector TD. Role of the gut microbiota in nutrition and health. Br. Med. J. 2018;361:36–44. - PMC - PubMed

Publication types