. 2023 Apr;55(4):619-630.
doi: 10.1038/s41588-023-01332-y. Epub 2023 Mar 27.

Neuroblastoma arises in early fetal development and its evolutionary duration predicts outcome

Affiliations

Neuroblastoma arises in early fetal development and its evolutionary duration predicts outcome

Verena Körber et al. Nat Genet. 2023 Apr.

Abstract

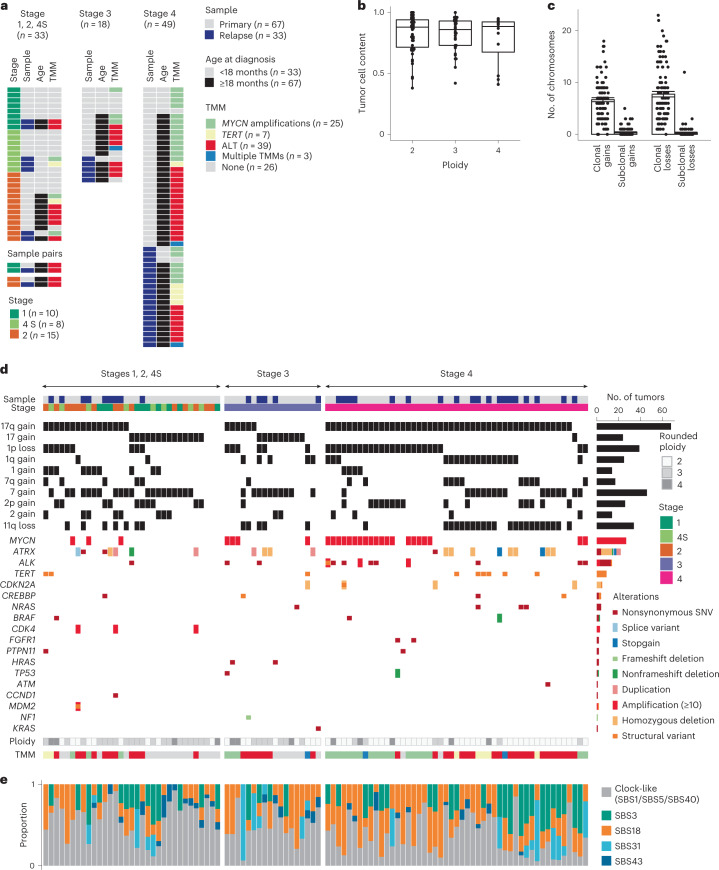
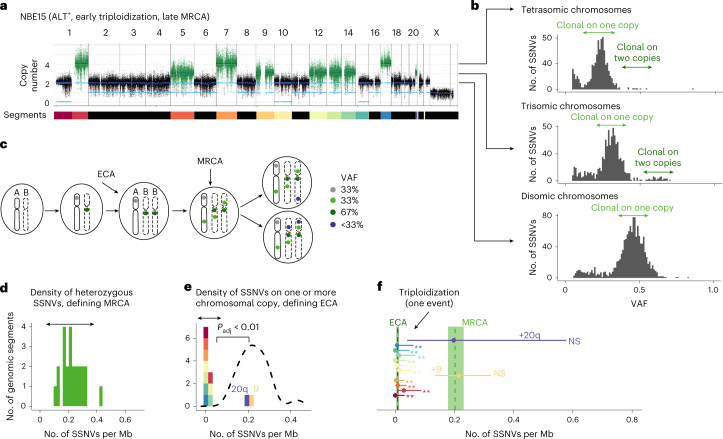
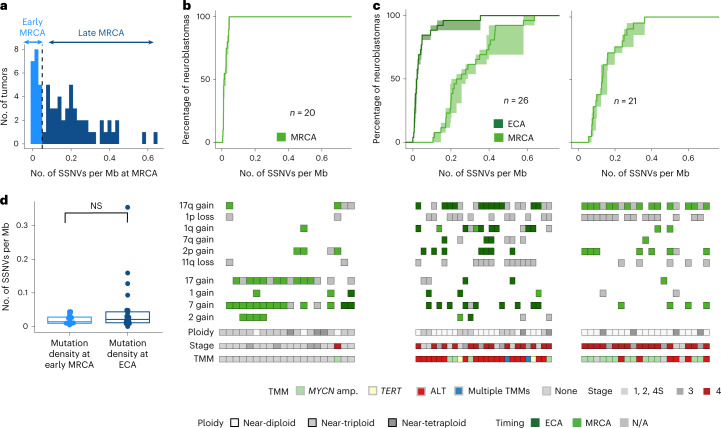
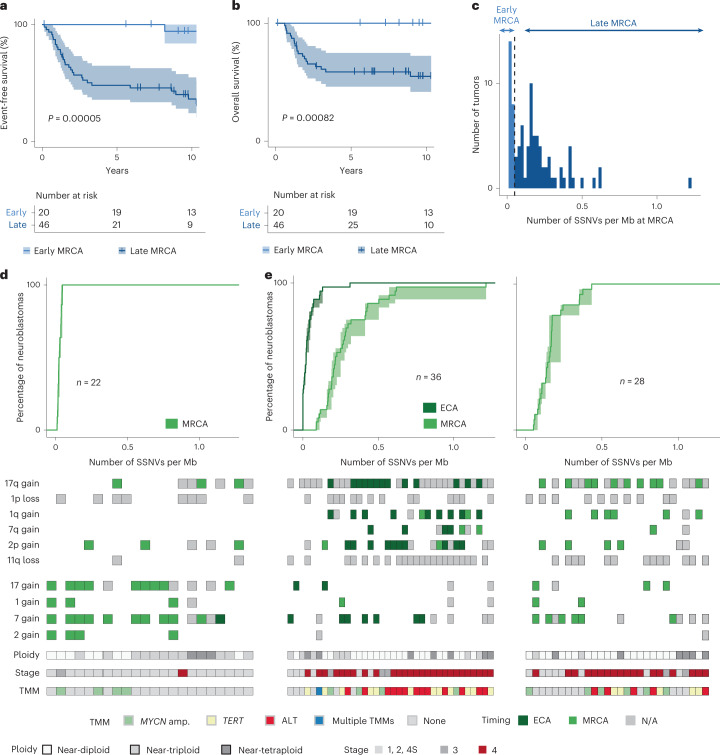
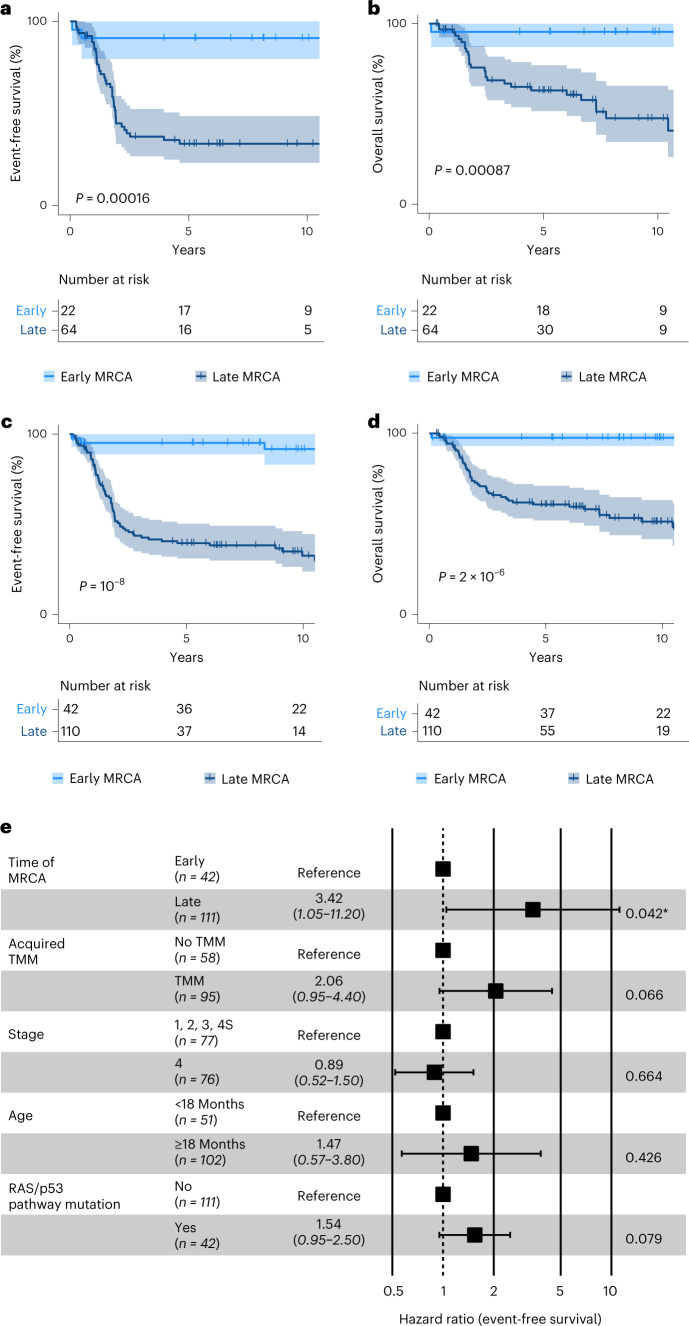
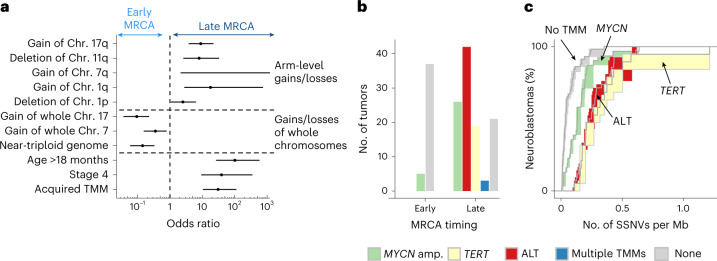
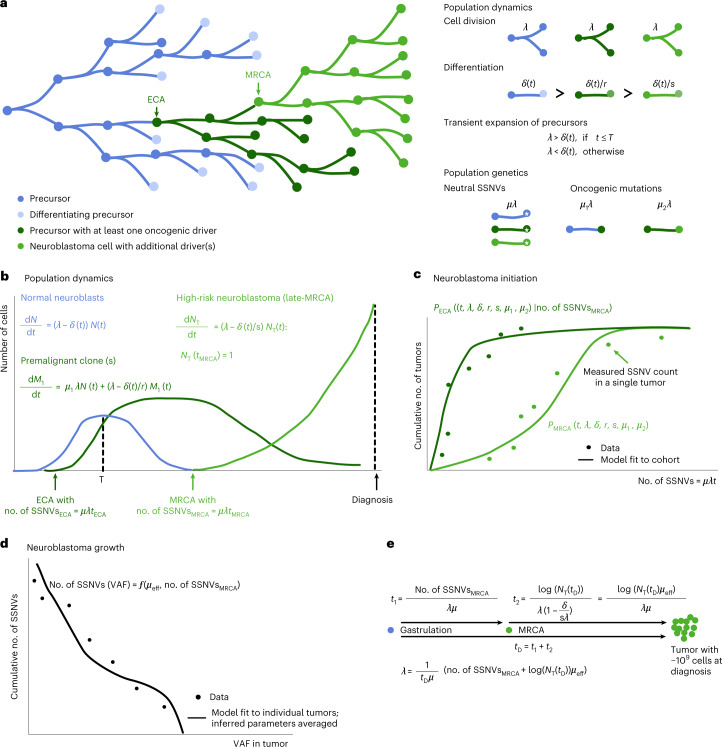
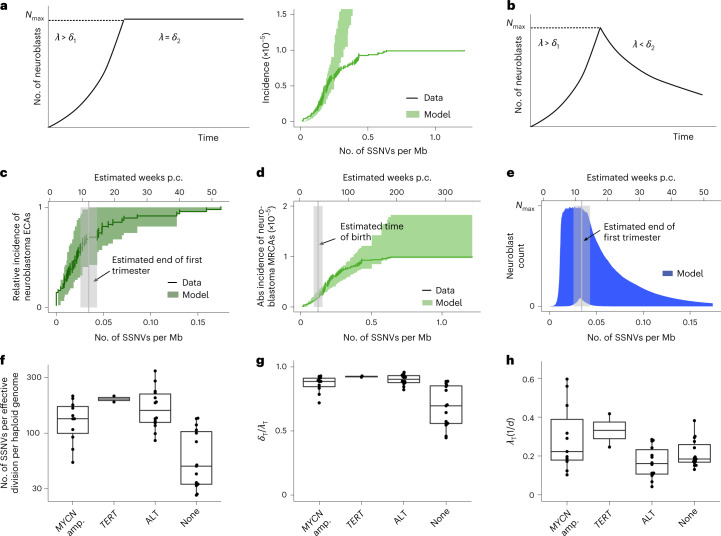
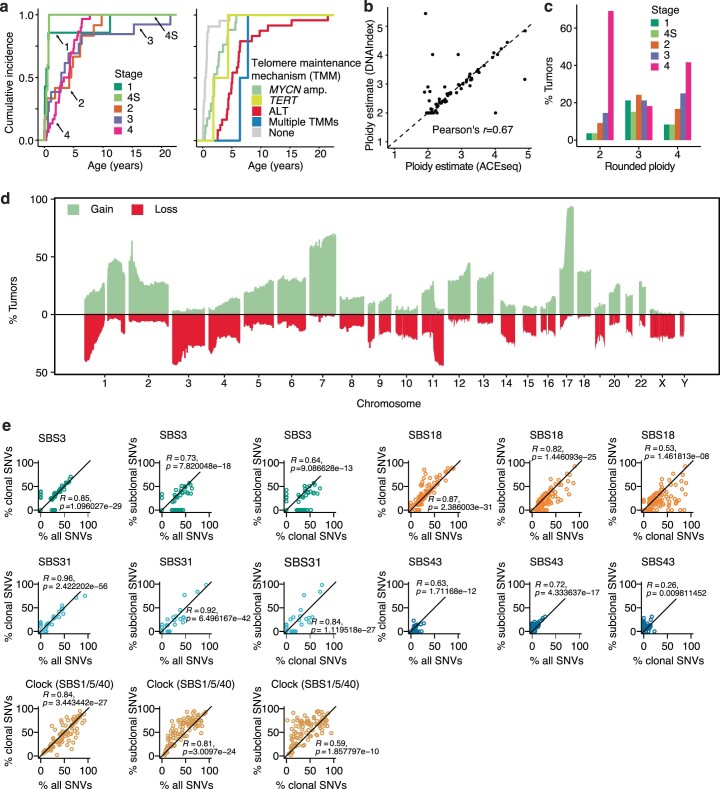
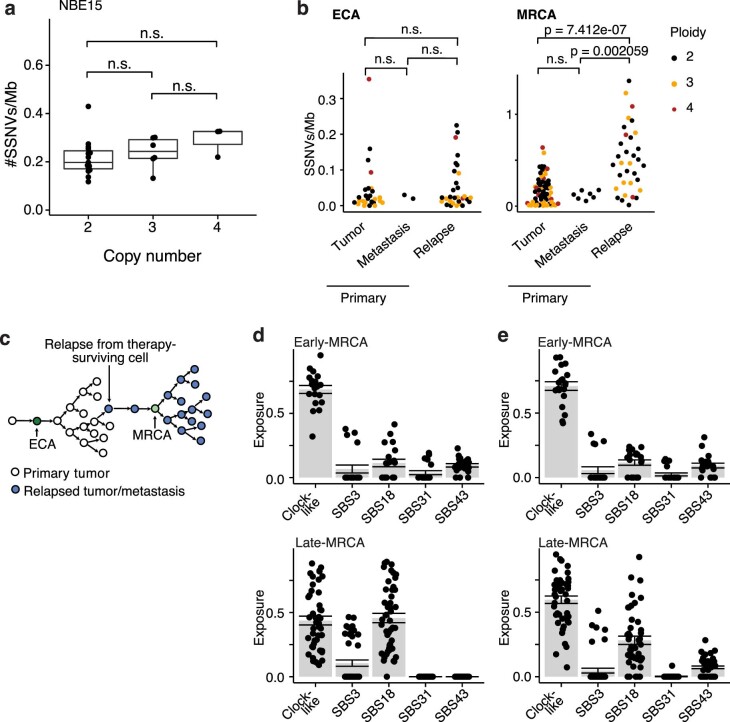
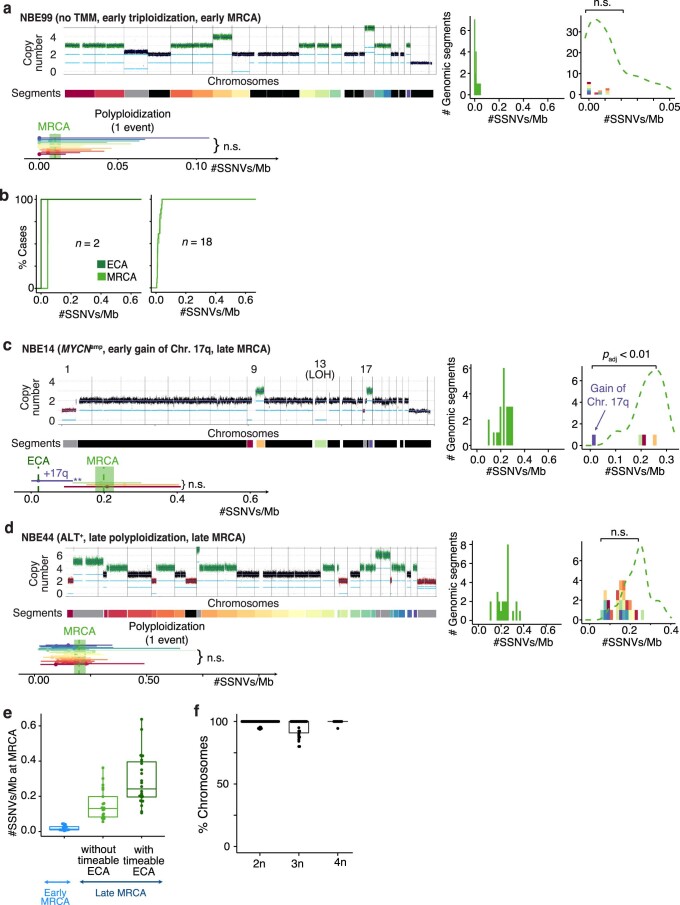
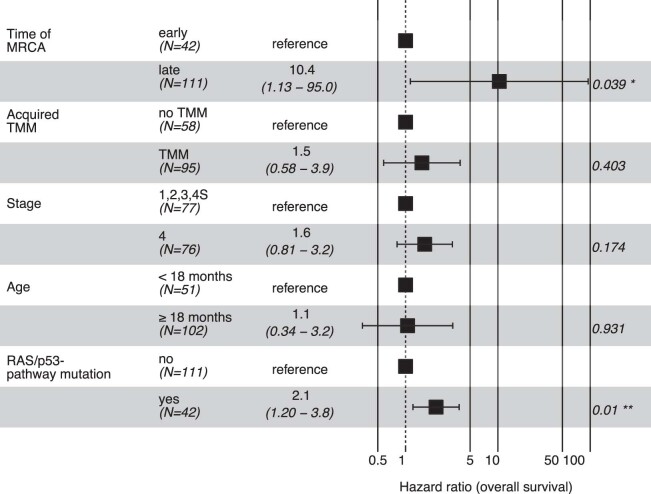
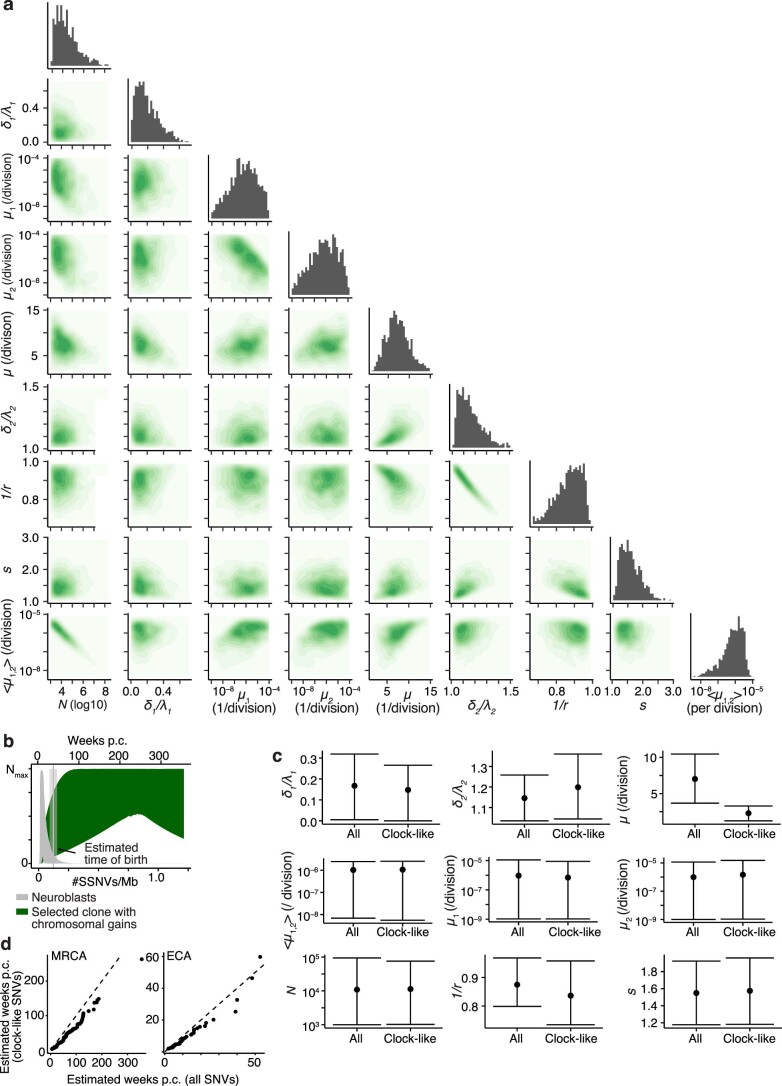
Neuroblastoma, the most frequent solid tumor in infants, shows very diverse outcomes from spontaneous regression to fatal disease. When these different tumors originate and how they evolve are not known. Here we quantify the somatic evolution of neuroblastoma by deep whole-genome sequencing, molecular clock analysis and population-genetic modeling in a comprehensive cohort covering all subtypes. We find that tumors across the entire clinical spectrum begin to develop via aberrant mitoses as early as the first trimester of pregnancy. Neuroblastomas with favorable prognosis expand clonally after short evolution, whereas aggressive neuroblastomas show prolonged evolution during which they acquire telomere maintenance mechanisms. The initial aneuploidization events condition subsequent evolution, with aggressive neuroblastoma exhibiting early genomic instability. We find in the discovery cohort (n = 100), and validate in an independent cohort (n = 86), that the duration of evolution is an accurate predictor of outcome. Thus, insight into neuroblastoma evolution may prospectively guide treatment decisions.


Conflict of interest statement

The authors declare no competing interests.

Figures

Fig. 1
Fig. 1. Molecular subtypes and mutation spectrum of the discovery cohort.
a, Clinical parameters and molecular characteristics. b, Tumor baseline ploidies and tumor cell content. Boxes show median, 25 and 75% percentiles and whiskers extend to the smallest and largest value within 1.5× interquartile range. Shown are n = 55 near-diploid, n = 33 near-triploid and n = 12 near-tetraploid tumors. c, Number of chromosomes harboring gains and losses ≥106 bp. Shown are mean and s.e. of the mean for n = 100 tumors. d, Copy number variants and small-scale mutations (SSNVs, small insertions/deletions, amplifications, homozygous deletions and structural rearrangements) in candidate driver genes. e, Exposures of mutational signatures (COSMIC v.3.1) per sample. Signatures SBS1, SBS5 and SBS40 were grouped into a single, clock-like mutations signature. Source data
Fig. 2
Fig. 2. Timing of chromosomal gains using SSNVs.
a, Copy number profile of a near-triploid tumor with ALT. Each segment of equal copy number is denoteded by a color in the bar at the bottom; these colors are used below to mark the segments in e,f. b, VAF distribution of SSNVs stratified by copy number for the tumor shown in a. c, Schematic introducing the nomenclature based on VAF of SSNVs. d,e, Densities of non-amplified (d) and amplified (e) clonal mutations on genomic segments of length ≥107 bp for the tumor shown in a. e, Dashed line indicates kernel-density estimate of the distribution of non-amplified clonal mutations shown in d. d,e, Chromosomal segments of equal copy number were combined into single genomic segments, and Holm-corrected, one-sided P values were computed based on negative binomial distribution (exact P values provided in Source Data). f, Mutation densities of ECA and MRCA, with 95% confidence bounds estimated by bootstrapping for the tumor shown in a. Horizontal lines represent mutation densities at gained segments, as in e, with 95% confidence bounds computed from χ2 distributions. Segments on which densities of amplified clonal mutations were significantly different from that at MRCA are marked by ** (adjusted P < 0.01); NS, not significant; test and P values as in e. e,f, Color coding for segments is in a. Source data
Fig. 3
Fig. 3. Early- versus late-MRCA neuroblastoma.
a, Bimodal distribution of mutation densities of the MRCA for the discovery cohort; a threshold of 0.05 SSNVs per Mb separates the two modes (dashed line). b,c, Top, cumulative SSNV densities of the ECA (dark green) and MRCA (light green) of primary tumors classified as either early-MRCA neuroblastoma (b, n = 20 tumors) or late-MRCA neuroblastoma (c, n = 26 tumors with ECA and n = 21 tumors without ECA). c, Left and right panels correspond to tumors with and without timeable ECA, respectively. b,c, Solid lines represent maximum-likelihood estimates, while shaded areas represent 95% confidence intervals obtained by nonparametric bootstrapping of chromosomal segments. Bottom, clonal chromosomal/segmental gains and losses implied in oncogenesis, ploidy, stage and presence of an acquired TMM. Gains were timed whenever possible as occurring in either the ECA (dark green) or MRCA (light green); gains that could not be timed are shown in gray. d, Mutation densities at the MRCA in 20 primary tumors classified as early MRCA, and at the ECA in 26 cases classified as late MRCA. Significance was tested using a two-sided Wilcoxon rank sum test/Mann–Whitney U-test (α = 0.05). Boxes show median, 25 and 75% percentiles and whiskers extend to the smallest and largest value within 1.5× interquartile range. N/A, not applicable. Source data
Fig. 4
Fig. 4. Timing of the MRCA predicts outcome.
a,b, Event-free (a) and overall survival (b) stratified by mutation density of the MRCA of primary tumors and metastases from the discovery cohort (n = 66; a single tumor lacking survival information was excluded from the analysis). Survival is shown for up to 10 years. P values were computed using the log-rank test; error band represents 95% confidence interval. c, Distribution of mutation densities of the MRCA for the validation cohort. The threshold (0.05 SSNVs per Mb, dashed line) is identical to that of the discovery cohort (compare with Fig. 3a). d,e, Mutation densities of ECA and MRCA for the validation cohort. Top, cumulative SSNV densities of the ECA (dark green) and MRCA (light green) of primary tumors classified as either early-MRCA neuroblastoma (d, n = 22) or late-MRCA neuroblastoma (e, n = 36 with ECA, n = 28 without ECA). e, Left and right panels correspond to tumors with and without timeable ECA, respectively. d,e, Solid lines represent maximum-likelihood estimates and shaded areas represent 95% confidence intervals obtained by nonparametric bootstrapping of chromosomal segments. Bottom, timing of pervasive chromosomal gains; segments compatible with both ECA and MRCA were classified as early, with subclonal gains excluded. Source data
Fig. 5
Fig. 5. Survival analysis.
ad, Event-free (a,c) and overall survival (b,d) stratified by mutation density at the MRCA of primary tumors and metastases from the validation cohort (a,b, n = 86) and from both cohorts (c,d, n = 152). Survival is shown for up to 10 years; P values were computed using the log-rank test, and error band represents 95% confidence interval. e, Multivariate Cox regression analysis for event-free survival of both cohorts (n = 152), considering mutation densities at MRCA, acquired mechanisms of telomere maintenance, disease stage at diagnosis, age at diagnosis and functional mutations in the RAS/p53 pathway. Shown are mean hazard ratio, 95% confidence intervals and P values for each variable (two-sided Wald test; *, P < 0.05). Source data
Fig. 6
Fig. 6. Early genomic instability is associated with unfavorable outcome.
a, Enrichment of chromosomal aberrations and clinical parameters in early- and late-MRCA tumors predicting favorable and unfavorable outcome, respectively. Shown are odds ratios (centers) with 95% confidence intervals (error bars) between tumors with late and early MRCA for characteristics with significant enrichment (P < 0.05 according to two-sided Fisher’s exact test; exact P values are provided in Source data). The odds ratio for 7q gain is infinite and hence only the lower bound is displayed. b, Prevalence of TMMs across early- and late-MRCA neuroblastomas. c, Cumulative mutation densities of the MRCA stratified by TMM. Shown are 150 primary tumors and metastases of both cohorts, excluding three tumors with multiple TMM. Solid lines represent maximum-likelihood estimates and shaded areas represent 95% confidence intervals obtained by bootstrapping. Source data
Fig. 7
Fig. 7. Population genetics models of tumor initiation and growth.
a, Model scheme. Neuronal precursors divide and differentiate. Oncogenic events at ECA and MRCA cause the outgrowth of premalignant (ECA) and malignant (MRCA) clones. Cells divide at rate λ and differentiate at rate δ; oncogenic mutations reduce the loss rate by a factor 1/r (first event) and 1/s (second event). Neutral SSNVs are acquired at rate μλ in each cell while driver mutations are acquired at lower rates μ1λ (corresponding to the first oncogenic event and defining the ECA of the tumor) and μ2λ (corresponding to the second oncogenic event and defining the MRCA of the tumor). b, Population dynamics of normal neuroblasts (N), premalignant clones (harboring one oncogenic event, M1) and high-risk neuroblastomas (harboring two oncogenic events, NT). Rates are defined in a. c, The model outlined in a,b yields a probability distribution for the time point at which the MRCA emerges (PMRCA(t)); likewise, it also yields a conditional probability for the time point at which the ECA emerged, given the mutation density in the MRCA (PECA(t|no. of SSNVsMRCA)). The parameters of both probability distributions can be estimated from the measured SSNV counts at ECA and MRCA across the cohort. d, Model of mutation accumulation during neuroblastoma growth. Neutral SSNVs are continuously acquired at rate µeff, defined as the number of neutral mutations per effective division (where one effective division produces two surviving daughter cells). By fitting the model to the measured VAF distribution, an estimate for µeff is obtained on the level of individual tumors (subsetting on cases with sufficient data quality and excluding tumors with evidence for subclonal selection during tumor growth). e, Estimation of division rate in actual time. The time between gastrulation and diagnosis (tD) consists of a premalignant time span, up to the emergence of the MRCA (t1), and the expansion of the tumor thereafter (t2). Assuming exponential tumor growth and approximately 109 tumor cells at diagnosis, this yields an estimate for the division rate per tumor for the subset used to estimate µeff. To obtain an estimate for the population level, these estimates are subsequently averaged across the cohort.
Fig. 8
Fig. 8. Evolutionary dynamics of neuroblastoma initiation.
a, Assuming a constant putative population of origin following neuroblast expansion (left panel), the model fit does not capture the observed saturating incidence of high-risk neuroblastomas (right panel; shaded areas, 95% posterior probability of the fit; data, mutation densities of the MRCA from primary neuroblastomas with an acquired TMM, combining discovery and validation cohort; solid line, maximum-likelihood estimates of data with error bars representing s.d. estimated by bootstrapping). b, Transient putative population of origin. c,d, Model fits to ECA (c) and MRCA (d) with transient population of origin, as in b accounts for the experimental data [green shaded areas, 95% posterior probability bounds; vertical lines and shaded areas, mean and 95% CI of the estimated end of the first trimester (12 weeks p.c.) and of the time of birth (38 weeks p.c.); data, mutation densities of ECA (dark green, n = 47) and MRCA (light green, n = 95) from primary neuroblastomas (tumors/metastases) with acquired TMM; solid lines, maximum-likelihood estimates; error bars, s.d. estimated by bootstrapping]. e, Predicted transient expansion of putative cells of origin, agreeing with rapid proliferative phase of sympathetic neuroblasts (shaded area, 95% posterior probability; vertical line and shaded area, mean and 95% CI of the estimated end of the first trimester (12 weeks p.c.)). f, Estimated mutation rate per effective cell division, computed from primary tumors/metastases with MYCN amplification (amp.) (n = 11), TERT rearrangement (n = 2), ALT (n = 14) or no acquired TMMs (n = 15), using cases with highly accurate subclonal VAF distribution due to high tumor purity. Boxes represent median and 25 and 75% percentiles; whiskers extend to the smallest and largest values within 1.5× interquartile range. g,h, Estimated loss rate (relative to cell division, g) and cell division rate (h) in primary tumors and metastases analyzed in f (shown are n = 11 primary tumors with MYCN amplification, n = 2 primary tumors with TERT rearrangement, n = 14 primary tumors with ALT and n = 15 primary tumors without acquired telomere maintenance). Boxes represent median and 25 and 75% percentiles; whiskers extend to the smallest and largest values within 1.5× interquartile range; λT, division rate during tumor growth; δT, loss rate during tumor growth. Source data
Extended Data Fig. 1
Extended Data Fig. 1. Copy number changes and mutational signatures in primary and relapsed neuroblastomas of the discovery cohort.
a, Age distribution at tumor diagnosis. b, Ploidy estimates based on WGS (inferred with ACEseq) and on DNA-index measurements (as measured by flow cytometry). Shown are 71 primary and relapsed tumors for which DNA-index was determined. c, Distribution of neuroblastoma stages among rounded ploidies. d, Overview of gains and losses across the tumor cohort. e, Comparison of mutational signatures (Cosmic v3) contributing to all SSNVs and to clonal and subclonal SSNVs (n = 100 primary and relapse tumors from the discovery cohort; Pearson’s correlation coefficients and two-sided P values are shown for each comparison). Source data
Extended Data Fig. 2
Extended Data Fig. 2. Mutation densities at chromosomal gains in the discovery cohort.
a, Mutation densities of non-amplified clonal mutations per genomic segment, stratified by copy number for tumor NBE15. Significance was tested with a two-sided Wilcoxon rank sum test/Mann–Whitney U-test (disomic: n = 15; trisomic: n = 6; tetrasomic: n = 3). Boxes show median, 25% and 75% percentiles, whiskers extend to the smallest and largest value within 1.5x interquartile range. b, Estimated mutation densities at ECA and MRCA of primary tumors (ECA: n = 26; MRCA: n = 60), primary metastases (ECA: n = 2; MRCA: n = 7) and relapsed tumors/metastases (ECA: n = 30; MRCA: n = 33). Significance was tested with a two-sided Wilcoxon rank sum test/Mann–Whitney U-test and defining ** as P < 0.01 (exact P values are given in Source Data). c, Model scheme for neuroblastoma relapse corresponding to data in (b). d and e, Exposures of mutational signatures among clonal (d) and subclonal SSNVs (e). Signatures SBS1, SBS5 and SBS40 were combined into a single clock-like mutational signature. Bar heights correspond to the average among early-MRCA (top; n = 20 primary tumors and metastases) and late-MRCA tumors (bottom; n = 47 primary tumors and metastases); error bars show standard error of the mean. Source data
Extended Data Fig. 3
Extended Data Fig. 3. Examples of early evolution.
a, Copy number profiles of an example tumor with near-triploid genome and without a timeable ECA. The color panels annotate genomic segments of equal copy number. Next to the copy number profile, the densities of non-amplified (green) and amplified (color-encoded) clonal mutations on segment of length ≥107 bp are shown, with the dashed line showing the kernel-density estimate of the distribution of non-amplified clonal mutations. Chromosomal segments of equal copy number were merged and Holm-corrected one-sided P values were computed based on a negative binomial distribution (**, padj < 0.01, exact P values are provided in Source Data). The bottom panel shows mutation densities at ECA and MRCA with 95% confidence bounds estimated by bootstrapping. The horizontal lines show mutation densities on gained segments with 95% confidence bounds computed from χ2 distributions. b, Mutation densities at ECA and MRCA of early-MRCA tumors with (left) and without (right) timeable ECA. Solid lines represent maximum likelihood estimates and shaded areas represent 95% confidence intervals, as obtained by bootstrapping. c and d, As in (a) but for a near-diploid tumor with timeable ECA (c) and for a near-tetraploid tumor without timeable ECA (d). Holm-corrected one-sided P values were computed based on a negative binomial distribution (**, padj < 0.01, exact P values are provided in Source Data). e, Mutation densities at MRCA in early-MRCA (n = 20) and late-MRCA primary tumors (n = 47, thereof n = 26 with ECA and n = 21 without ECA). f, Fraction of polysomic chromosomes in near-triploid (n = 33) and near-tetraploid (n = 12) tumors that were generated in a single oncogenic event. As a control, the fraction of disomic chromosome whose mutation density matched with the MRCA is shown for near-diploid tumors (n = 55). In (e) and (f), boxes show median, 25 and 75% percentiles, whiskers extend to the smallest and largest value within 1.5x interquartile range. Source data
Extended Data Fig. 4
Extended Data Fig. 4. Analysis of overall survival.
Multivariate analysis of overall survival with Cox-regression considering MRCA timing, acquired mechanisms of telomere maintenance, stage, age at diagnosis and mutation status in the RAS/P53 pathway. Shown are mean hazard ratio, 95% confidence intervals and p-values for each variable (two-sided Wald test). Source data
Extended Data Fig. 5
Extended Data Fig. 5. Neuroblastoma initiation during progenitor expansion.
a, Two-dimensional projections of the posterior probability distribution of the model parameters (considering neuroblastoma initiation in a transient population of early neuroblasts). b, Predicted expansion of neuroblasts (grey) and the selected subclone upon acquisition of the first oncogenic event (dark green) in a model of transient neuroblast expansion. Colored areas show the 95% posterior probability bounds (estimated from simulations using 1,000 samples from the posterior probability distribution). Vertical line and shaded area give mean and 95% CI for the estimated time of birth (computed from n = 62 primary tumors). c, Comparison of parameter estimates if fitting the model to all SSNVs or to SSNVs generated by a clock-like mutational process only. For the latter, mutant densities were adjusted by the fraction of SSNVs explained by SBS1, SBS5 or SBS40. For each parameter, median and 80% credible intervals are shown (estimated from n = 1000 samples of the posterior distribution). d, Comparison between the estimated time point at which the MRCA (left, n = 95 primary tumors/metastases with TMM) and the ECA (right, n = 47 primary tumors/metastases with TMM) emerged if using all SSNVs or if using SSNVs that were generated by a clock-like process only. Time is measured in weeks post conceptionem (p.c.). Source data

Comment in

References

    1. Stratton MR, Campbell PJ, Futreal PA. The cancer genome. Nature. 2009;458:719–724. doi: 10.1038/nature07943. - DOI - PMC - PubMed
    1. Bozic I, Wu CJ. Delineating the evolutionary dynamics of cancer from theory to reality. Nat. Cancer. 2020;1:580–588. doi: 10.1038/s43018-020-0079-6. - DOI - PubMed
    1. Nordling C. A new theory on the cancer-inducing mechanism. Br. J. Cancer. 1953;7:68–72. doi: 10.1038/bjc.1953.8. - DOI - PMC - PubMed
    1. Armitage P, Doll R. A two-stage theory of carcinogenesis in relation to the age distribution of human cancer. Br. J. Cancer. 1957;11:161–169. doi: 10.1038/bjc.1957.22. - DOI - PMC - PubMed
    1. Singer J, Kuipers J, Jahn K, Beerenwinkel N. Single-cell mutation identification via phylogenetic inference. Nat. Commun. 2018;9:5144. doi: 10.1038/s41467-018-07627-7. - DOI - PMC - PubMed

Publication types