. 2023 Apr;30(4):512-520.
doi: 10.1038/s41594-023-00955-3. Epub 2023 Mar 27.

Discrimination between cyclic nucleotides in a cyclic nucleotide-gated ion channel

Affiliations

Discrimination between cyclic nucleotides in a cyclic nucleotide-gated ion channel

Yangang Pan et al. Nat Struct Mol Biol. 2023 Apr.

Abstract

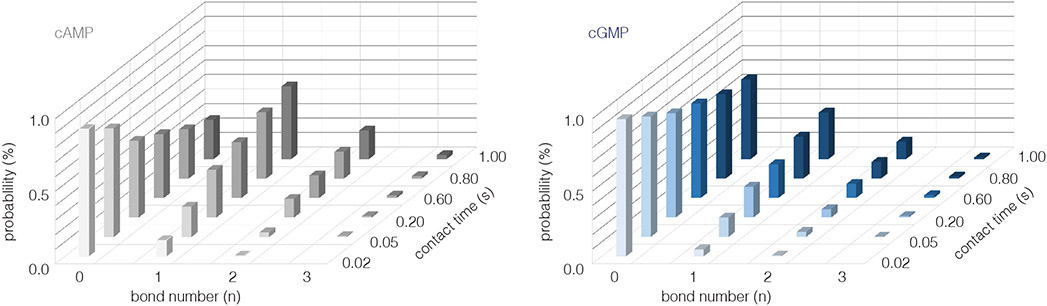
Cyclic nucleotide-gated ion channels are crucial in many physiological processes such as vision and pacemaking in the heart. SthK is a prokaryotic homolog with high sequence and structure similarities to hyperpolarization-activated and cyclic nucleotide-modulated and cyclic nucleotide-gated channels, especially at the level of the cyclic nucleotide binding domains (CNBDs). Functional measurements showed that cyclic adenosine monophosphate (cAMP) is a channel activator while cyclic guanosine monophosphate (cGMP) barely leads to pore opening. Here, using atomic force microscopy single-molecule force spectroscopy and force probe molecular dynamics simulations, we unravel quantitatively and at the atomic level how CNBDs discriminate between cyclic nucleotides. We find that cAMP binds to the SthK CNBD slightly stronger than cGMP and accesses a deep-bound state that a cGMP-bound CNBD cannot reach. We propose that the deep binding of cAMP is the discriminatory state that is essential for cAMP-dependent channel activation.


Figures

Extended Data Fig. 1 ∣
cNs-CNBD binding studies using microscalethermophoresis (MST). a) and c) Microscale thermophoresis (MST) traces ofcAMP-CNBD (a) and cGMP-CNBD (c) interactions, respectively. b) Binding curveof labeled CNBD with cAMP. Two binding phases were detected. The first hada KD of 0.4 ± 0.5 μM, and the second had a K D of 1.6 ± 1.1 μM. d) Binding curveof labeled CNBD with cGMP. The K D value of cGMP-CNBD was 3.3 ± 1.8 μM. Theconcentration of labeled His 6-C-linker-CNBD was kept constant (50 nM), and theconcentration of cNs was varied from 0.00305 μM to 100 μM.
Extended Data Fig. 2 ∣
Distributions of rupture forces of cAMP-CNBD or cGMP-CNBD bonds under various conditions. a) Force distribution of cAMP-CNBD unbinding following 0.02 s bond formation at varying pulling velocity (top right in each graph). b) Force distribution of cAMP-CNBD unbinding following 1.00 s bond formation at varying pulling velocities (top right in each graph). The force distributions are fitted with bimodal Gaussian fits to extract the most probable rupture forces for binding state 1 (first peak) and binding state 2 (second peak), which are then used for Bell–Evans model fitting. c) Force distribution of cGMP-CNBD unbinding following 0.02 s bond formation at varying pulling velocities (top right in each graph). d) Force distribution of cGMP-CNBD unbinding following 1.00 s bond formation at varying pulling velocities (top right in each graph). e) and f) Distributions of rupture forces of cGMP-CNBD (e) and cAMP-CNBD (f) unbinding following different bond formation times and at 0.4 μm/s pulling velocity). Bimodal Gaussian fits are used to extract the number of events for each bond state, which is then used to calculate the probability of occurrence of binding state 2.
Extended Data Fig. 3 ∣
Deviations of rupture force distributions. Theoretical, simulation and experimental unbinding force distributions (normalized by loading rates) of cAMP (left) and cGMP (right). The experimental unbinding force distributions are the distributions after 0.02 s bond formation time.
Extended Data Fig. 4 ∣
Number of bond ruptures as a function of bond- formation time for cAMP-CNBD (left) and cGMP-CNBD (right). With increasing cN contact time, the frequency of unsuccessful (0 bond) force-distance cycles decreases, while the number of successful (1 bond) force-distance cycles increases. Concomitantly, a fraction of force-distance cycles reported multiple (2 or 3) binding events.
Extended Data Fig. 5 ∣
Markovian sequence analysis for the force spectroscopy experiments of cAMP-CNBD at 1 s contact time. Markovian model fitting for 1 (gray line) and 2 (dashed line) bonds. koff and xβ values were derived from the Bell–Evans model fit to the canonical binding mode (see Fig. 5b). The most probable rupture force (Gaussian peak) and error (full width at half maximum of the Gaussian peak) at each loading rate was determined through Gaussian fitting of the corresponding histogram (total data points for all histograms, N = 1898, Extended Data Fig. 2b).
Extended Data Fig. 6 ∣
Comparison of SthK with CNG and HCN channels, with a focus on their cN binding pockets. Top: cNs binding pocket of SthK (left, gray) and CNGA1 (right, orange) showing that the residues Y and F are swapped in CNGA1 channels compared with SthK. Bottom: Sequence alignment of SthK with CNG and HCN channels showing that Y357 and F365 identified by MDS to be crucial in cN discrimination in SthK are not conserved, whereas M369 is a conservative mutation and A370 is a semi-conservative mutation. cAMP interacts with Y357, M369 and A370, and cGMP interacts with F365.
Figure 1 ∣
Figure 1 ∣. 2D-crystallization of SthK C-linker-CNBD.
a) Side view of the SthK channel structure (PDB 6CJQ) with transmembrane domain (TMD, green), intracellular C-Linker domain (CL, orange) and cyclic-nucleotide binding domain (CNBD, yellow). b) Bottom view of the SthK channel onto the intracellular face. Inset: Nucleotide binding site with bound cAMP (red). c) Schematic of His6-C-linker-CNBDs assembling on a DOPC/DOPS (3:1) membrane containing 20% Ni2+-NTA lipids (DGS-NTA-Ni, light pink). d) Overview AFM topography of His6-C-linker-CNBD 2D-crystals on a lipid bilayer containing Ni2+-NTA headgroups. e) Cross-sections of the 2D-crystals along the dashed lines 1 and 2 in (d). f) Height distribution histogram of all pixels in (d). The membrane height level is set to 0 nm and the height of CNBD patches is measured as ~5 nm. g) High-resolution AFM images of a His6-C-linker-CNBD 2D-crystal exposing the CNBDs to the solution (unit cell: a = b = 11 nm, γ = 90°).
Figure 2 ∣
Figure 2 ∣. Schematic of the experiment to probe the cN-CNBD interaction using AFM single molecule force spectroscopy (SMFS).
a) Surface chemistry to tether cNs, here cAMP (chemical structure), to the AFM tip via a 3-step protocol: First, amine groups are introduced to the inert silicon-nitride tip-surface. Second, a PEG-linker is covalently coupled to the tip. Third, cAMP is coupled to the free end of the linker. b) Force measurement cycle: At a fixed lateral position, the deflection (force) of the cantilever is recorded as a function of the tip-sample distance. In the approaching period (red line) the deflection remains zero until the tip touches the surface (1). Upon further approach, the cantilever bends upward, and a linearly increasing force is applied to the surface (2). The tip contacts the CNBD for a preset time at a preset force (3). Upon tip retraction (blue line) cantilever bending relaxes until the cantilever reaches again its resting position (4). In case of a CNBD─cN bond formation the tip-surface attachment leads to a downward bending of the cantilever and stretching of the PEG-linker (5) until the CNBD─cN bond breaks (5 to 6). The loading rate of force application on the bond and the unbinding force are the measurables extracted from each individual SMFS cycle. c) Specificity of AFM-SMFS measurements: For control, saturating concentrations, 2 mM cAMP or cGMP were injected into the fluid cell during cAMP-CNBD or cGMP-CNBD experiments, respectively. In presence of soluble ligand, the cN-CNBD complex formation decreased by ~85%. The error bars indicate s.d. of the mean value. (N=3 independent experiments for both cAMP and cGMP experiments).
Figure 3 ∣
Figure 3 ∣. Binding kinetics of cAMP-CNBD and cGMP-CNBD.
a) and e) Representative force-distance curves of cAMP-CNBD and cGMP-CNBD unbinding events, respectively, recorded at 0.4 μm/s pulling speed. b) and f) Rupture force histograms at three different pulling speeds (0.2 μm/s, 0.4 μm/s, and 2.0 μm/s) of cAMP-CNBD and cGMP-CNBD, respectively (lines: Gaussian fits). c) and g) Representative simulation force curves of cAMP-CNBD and cGMP-CNBD unbinding events, respectively. d) and h) Rupture force histograms from simulations at three different pulling speeds of cAMP-CNBD and cGMP-CNBD, respectively (lines: Gaussian fits). i) Dynamic force spectra of the most probable rupture forces of cAMP-CNBD and cGMP-CNBD complexes, respectively, versus logarithm of the loading rate. To guide the eye, the lines show Bell-Evans model fits as indicated, eq.1. See Table 1 for detailed fit results of the experiment, the MDS, and the combined data. The most probable rupture force (Gaussian peak) and error (full width at half maximum of the Gaussian peak) at each loading rate was determined through Gaussian fitting of the corresponding histogram (N=851 data points for cAMP, and N=991 data points for cGMP). j) Binding probability (bond-formation / total number of experimental cycles) of cAMP and cGMP to the CNBD, respectively, as a function of cN-CNBD contact time (lines: Probabilistic binding frequency model fits, eq.2). Each data point represents the mean binding probability ± s.d. (error bar) (N=3 independent experiments).
Figure 4 ∣
Figure 4 ∣. H-bond interactions between CNBD and cNs.
a) From left to right: Top: Representative simulation snapshots at increasing COM (geometric average of all cN atoms) separation in state 1, 2 and 3 along the unbinding pathway for the cAMP-CNBD (left), and cGMP-CNBD (right) complex. cN is shown in green, the PEG-linker is omitted for clarity. Protein residues with highest contributions to the H-bond energies (defined as constituting 95% of the total integrated H-bond energy along the enforced unbinding) are shown colored, residues in the pocket and on the C-helix (top) are shown in color and licorice mode. Bottom: Corresponding close-up views showing H-bonds as dashed lines with 3 different line thicknesses representing the interaction strength (strong >3.5 kcal/mol; intermediate 1.7 - 3.5 kcal/mol, and weak 0.1 - 1.7 kcal/mol interactions). b) Energy contributions of residues as a function of cN-to-pocket COM separation distance for cAMP (left) and cGMP (right). Colored as the residues in the structural snapshots.
Figure 5 ∣
Figure 5 ∣. A deep cAMP binding site after extended cAMP-CNBD bond formation.
a) Force distribution of cAMP-CNBD (left) and cGMP-CNBD (right) complexes after 0.02 s and 1.00 s bond formation contact times. The rupture force distribution after 1.00 s contact time is about two-fold wider for cAMP (p = 0.00209), but not for cGMP. Box: 25th-75th percentiles. Square in the box: Mean value. Line in the box: Median value. Top line: Maximum value. Bottom line: Minimum value. (N=6). P-values were determined by two-sample t-test in Origin. b) Dynamic force spectrum and Bell-Evans model fits (lines) of the most probable rupture forces of cAMP-CNBD after 1.00 s bond formation time. Grey crosses: individual data points (N=1898). Gray line: Fit for state 1 bond (lower force distributions). Dashed line: Fit for the state 2 bond (higher force distributions). The most probable rupture force (Gaussian peak) and error (full width at half maximum of the Gaussian peak) at each loading rate was determined through Gaussian fitting of the corresponding histogram (Extended Data Fig. 2b). c) Probability of occurrence of state 2 binding events as a function of cAMP-CNBD bond formation time. Gray line: Fit of eq.4 to extract the reaction kinetics of state 2 bond formation. The state 2 probability was estimated from dividing the events under the second Gaussian fit by the total number of events and error bar is the full width at half maximum of the second peak at each contact time (total data points for all histograms, N=1917, Extended Data Fig. 2f).
Figure 6 ∣
Figure 6 ∣. Kinetic model of cAMP and cGMP binding to the SthK CNBD.
a) cAMP has a ~2-fold lower off-rate than cGMP, but very similar on-rates to bind in state 1. However, cAMP can exchange state 1 binding with a deeper bound state 2 that is inaccessible to cGMP. We propose that state 2 binding relates to a state that can activate the channel. b) Sketch of the energy landscapes of the cGMP and the two states of cAMP binding from the parameters provided in Table S1 derived through the DHS-model.

References

    1. Kaupp UB, Seifert R. Cyclic Nucleotide-Gated Ion Channels. Physiological Reviews 82, 769–824 (2002). - PubMed
    1. Craven KB, Zagotta WN. CNG AND HCN CHANNELS: Two Peas, One Pod. Annual Review of Physiology 68, 375–401 (2006). - PubMed
    1. Robinson RB, Siegelbaum SA. Hyperpolarization-Activated Cation Currents: From Molecules to Physiological Function. Annual Review of Physiology 65, 453–480 (2003). - PubMed
    1. Biel M, Wahl-Schott C, Michalakis S, Zong X. Hyperpolarization-Activated Cation Channels: From Genes to Function. Physiological Reviews 89, 847–885 (2009). - PubMed
    1. James ZM, Zagotta WN. Structural insights into the mechanisms of CNBD channel function. Journal of General Physiology 150, 225–244 (2017). - PMC - PubMed

METHODS-ONLY REFERENCES

    1. Asakawa H, Yoshioka S, Nishimura K-i, Fukuma T. Spatial Distribution of Lipid Headgroups and Water Molecules at Membrane/Water Interfaces Visualized by Three-Dimensional Scanning Force Microscopy. ACS Nano 6, 9013–9020 (2012). - PubMed
    1. Koehler M, et al. Control of Ligand-Binding Specificity Using Photocleavable Linkers in AFM Force Spectroscopy. Nano Letters 20, 4038–4042 (2020). - PMC - PubMed
    1. Miyagi A, Scheuring S. Automated force controller for amplitude modulation atomic force microscopy. Review of Scientific Instruments 87, 053705 (2016). - PubMed
    1. Miyagi A, Scheuring S. A novel phase-shift-based amplitude detector for a high-speed atomic force microscope. Review of Scientific Instruments 89, 083704 (2018). - PubMed
    1. Sali A, Blundell TL. Comparative protein modelling by satisfaction of spatial restraints. J Mol Biol 234, 779–815 (1993). - PubMed

Publication types

MeSH terms