. 2023 Apr;26(4):638-649.
doi: 10.1038/s41593-023-01282-y. Epub 2023 Mar 27.

Intrinsic activity development unfolds along a sensorimotor-association cortical axis in youth

Affiliations

Intrinsic activity development unfolds along a sensorimotor-association cortical axis in youth

Valerie J Sydnor et al. Nat Neurosci. 2023 Apr.

Abstract

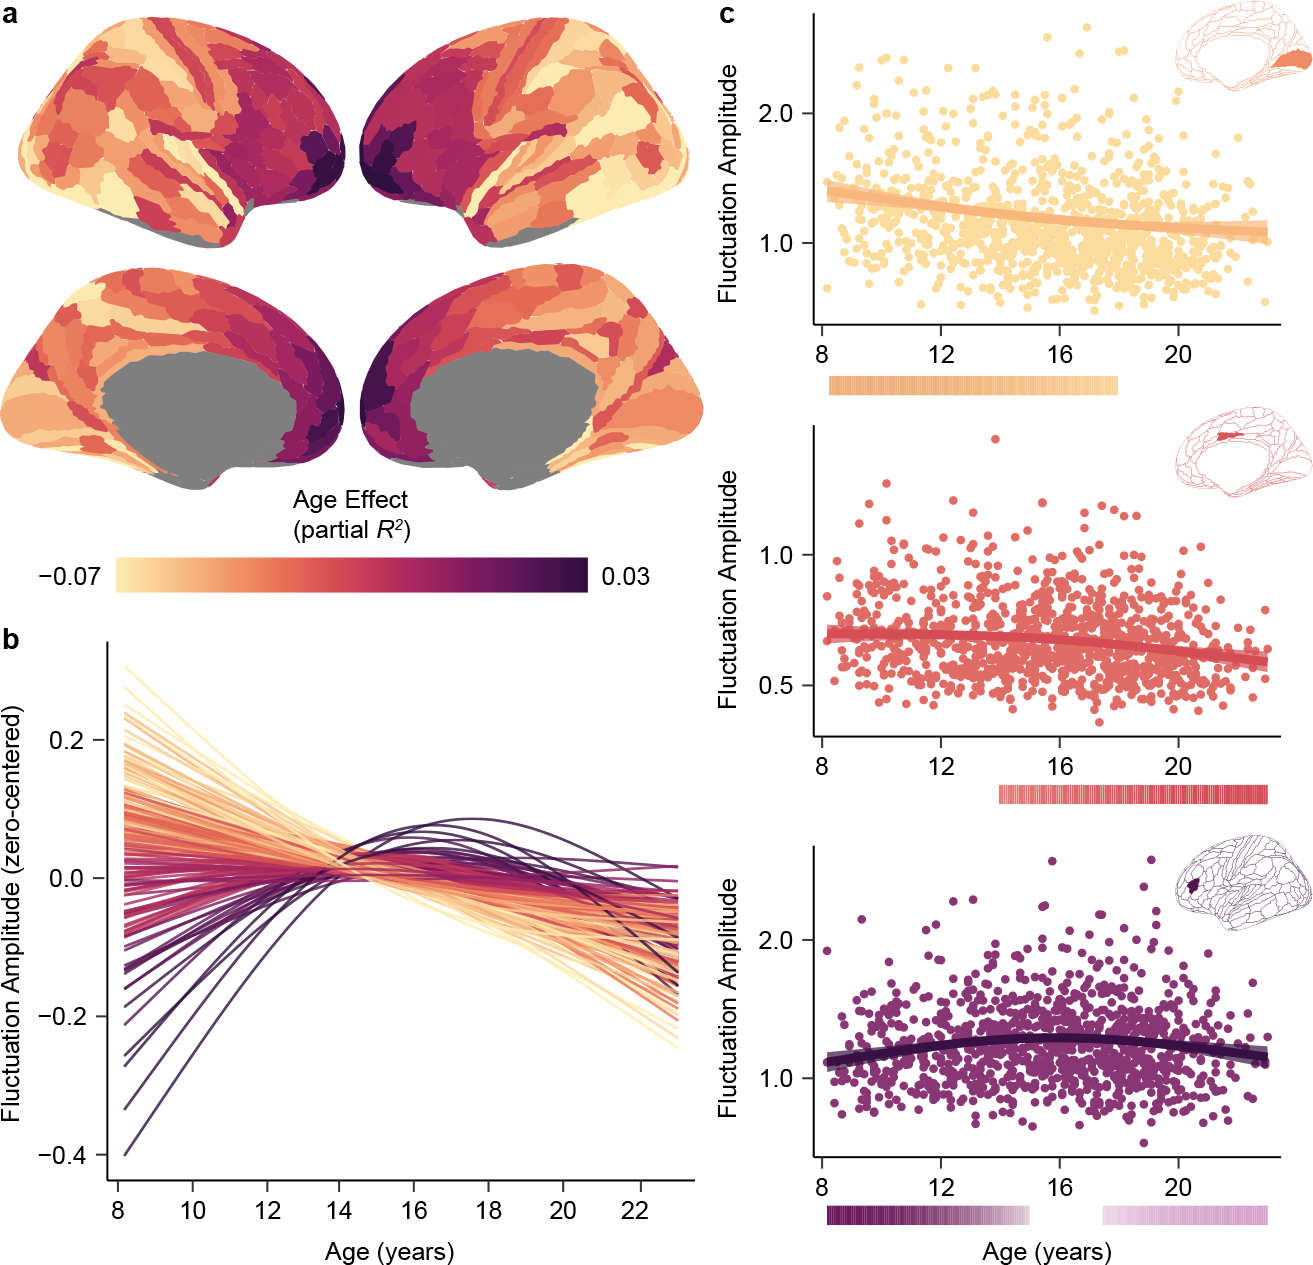
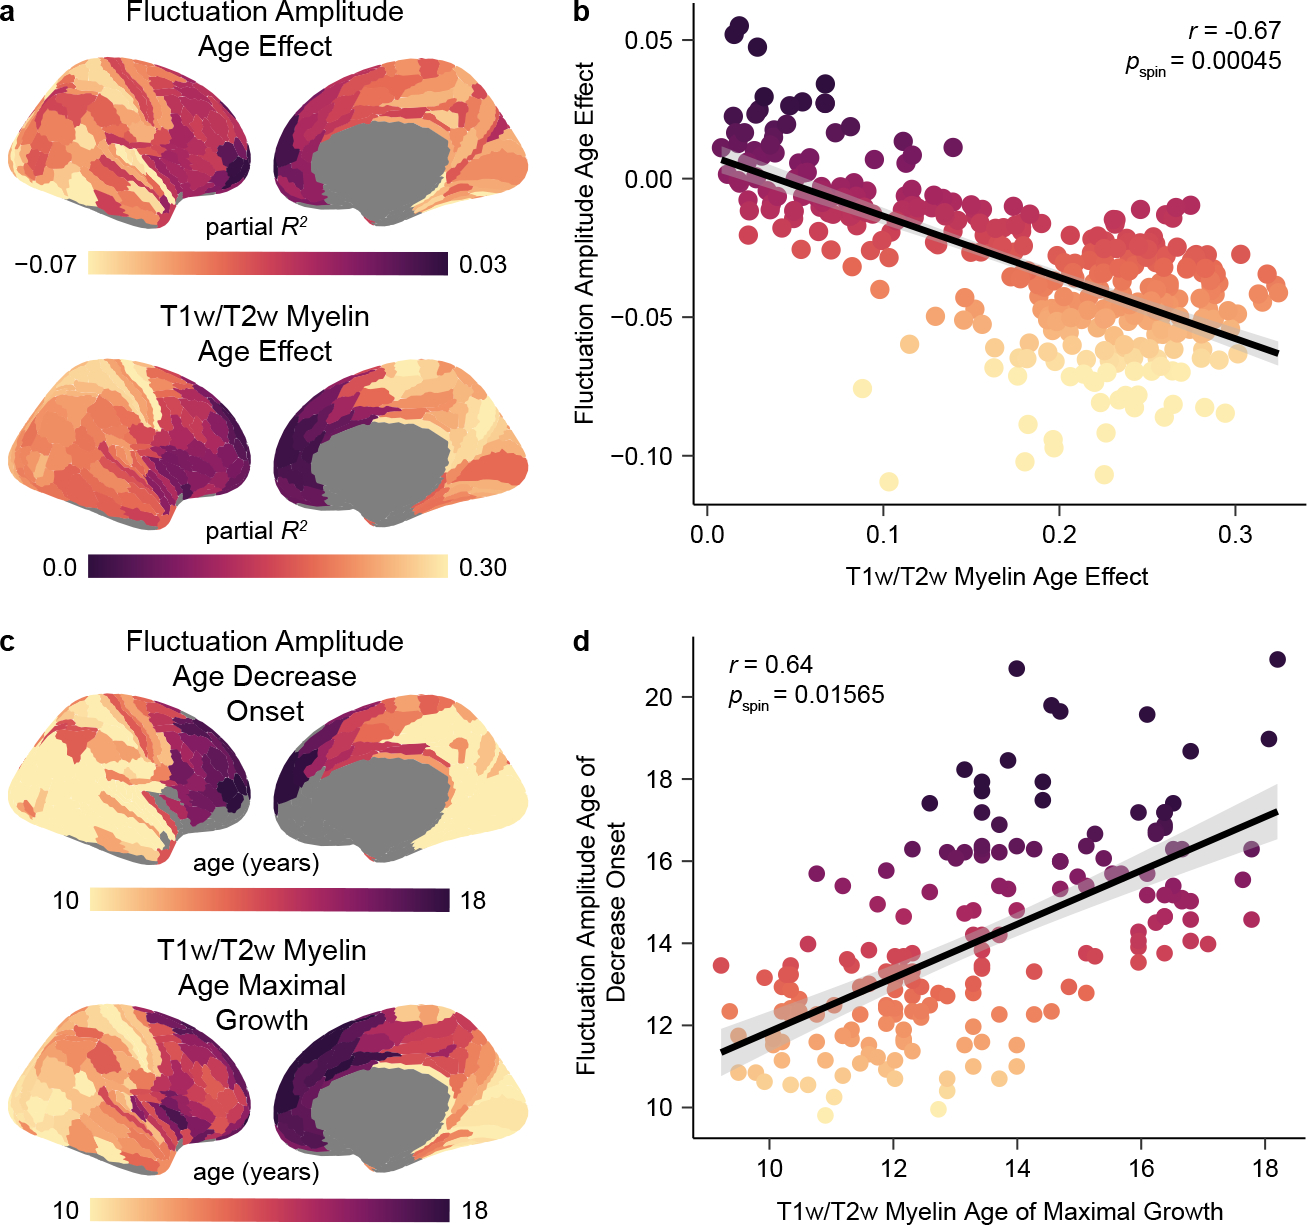
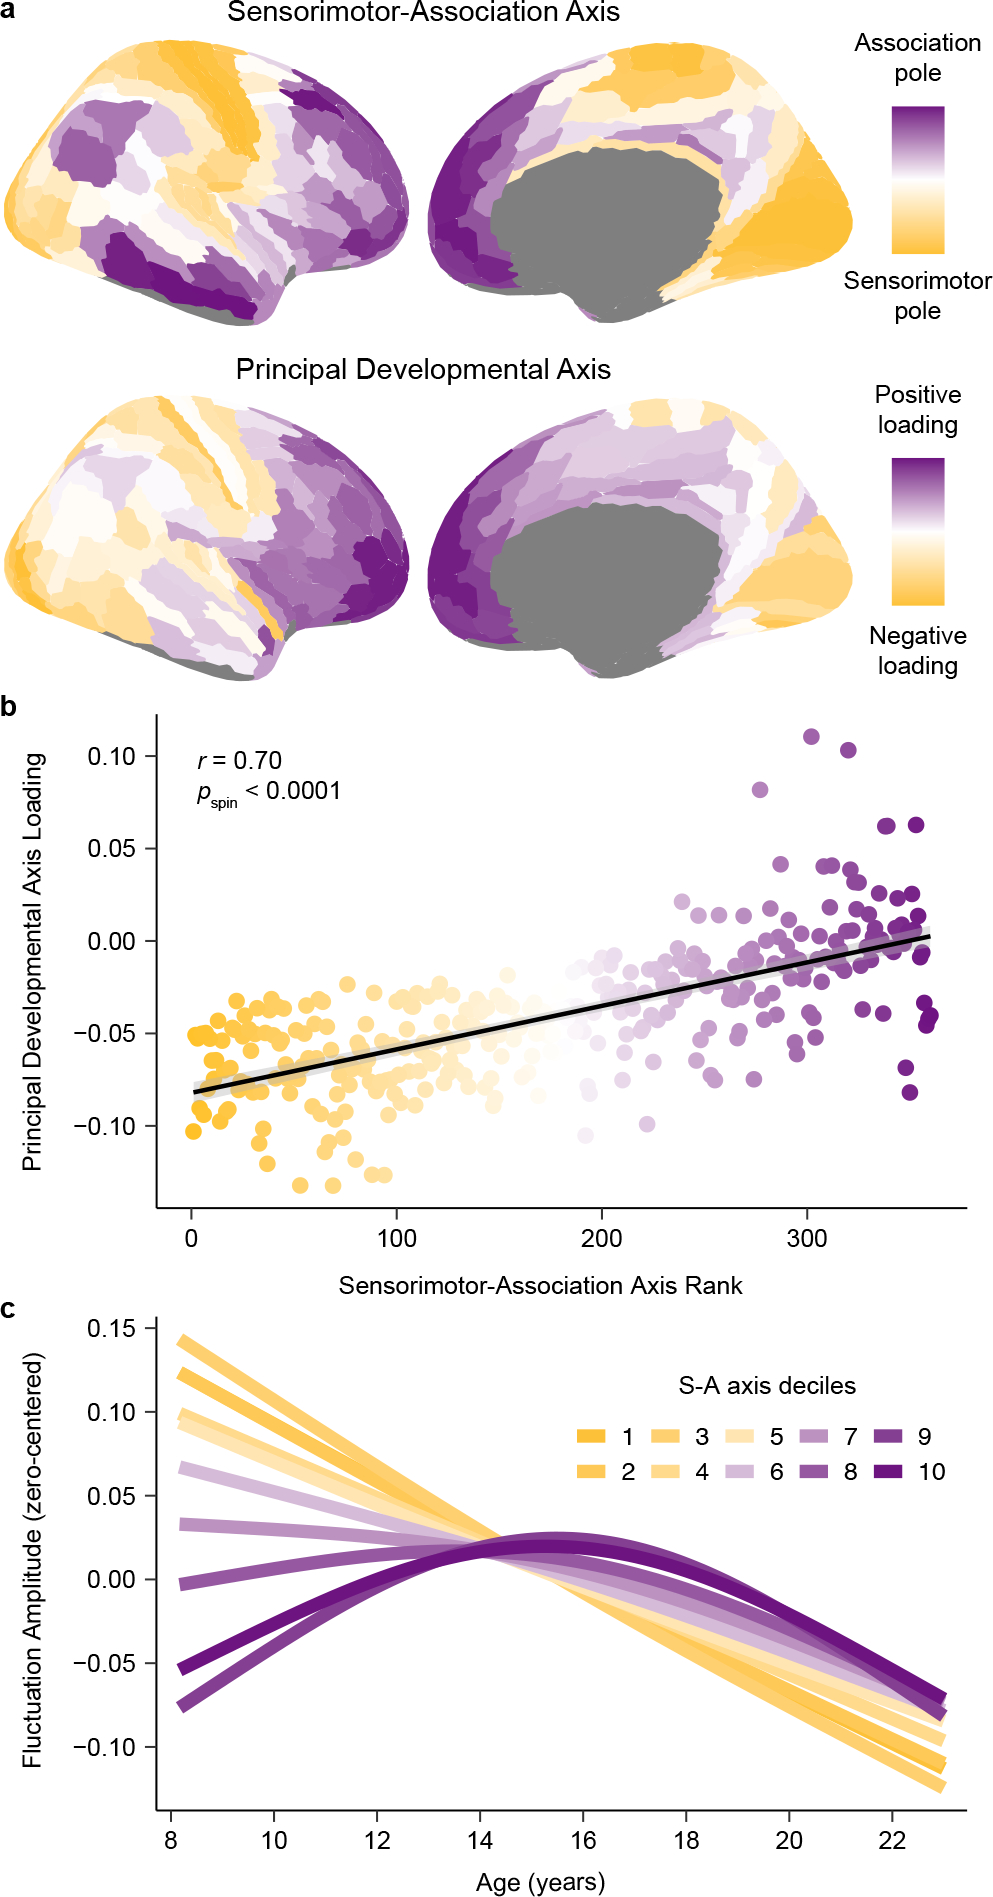
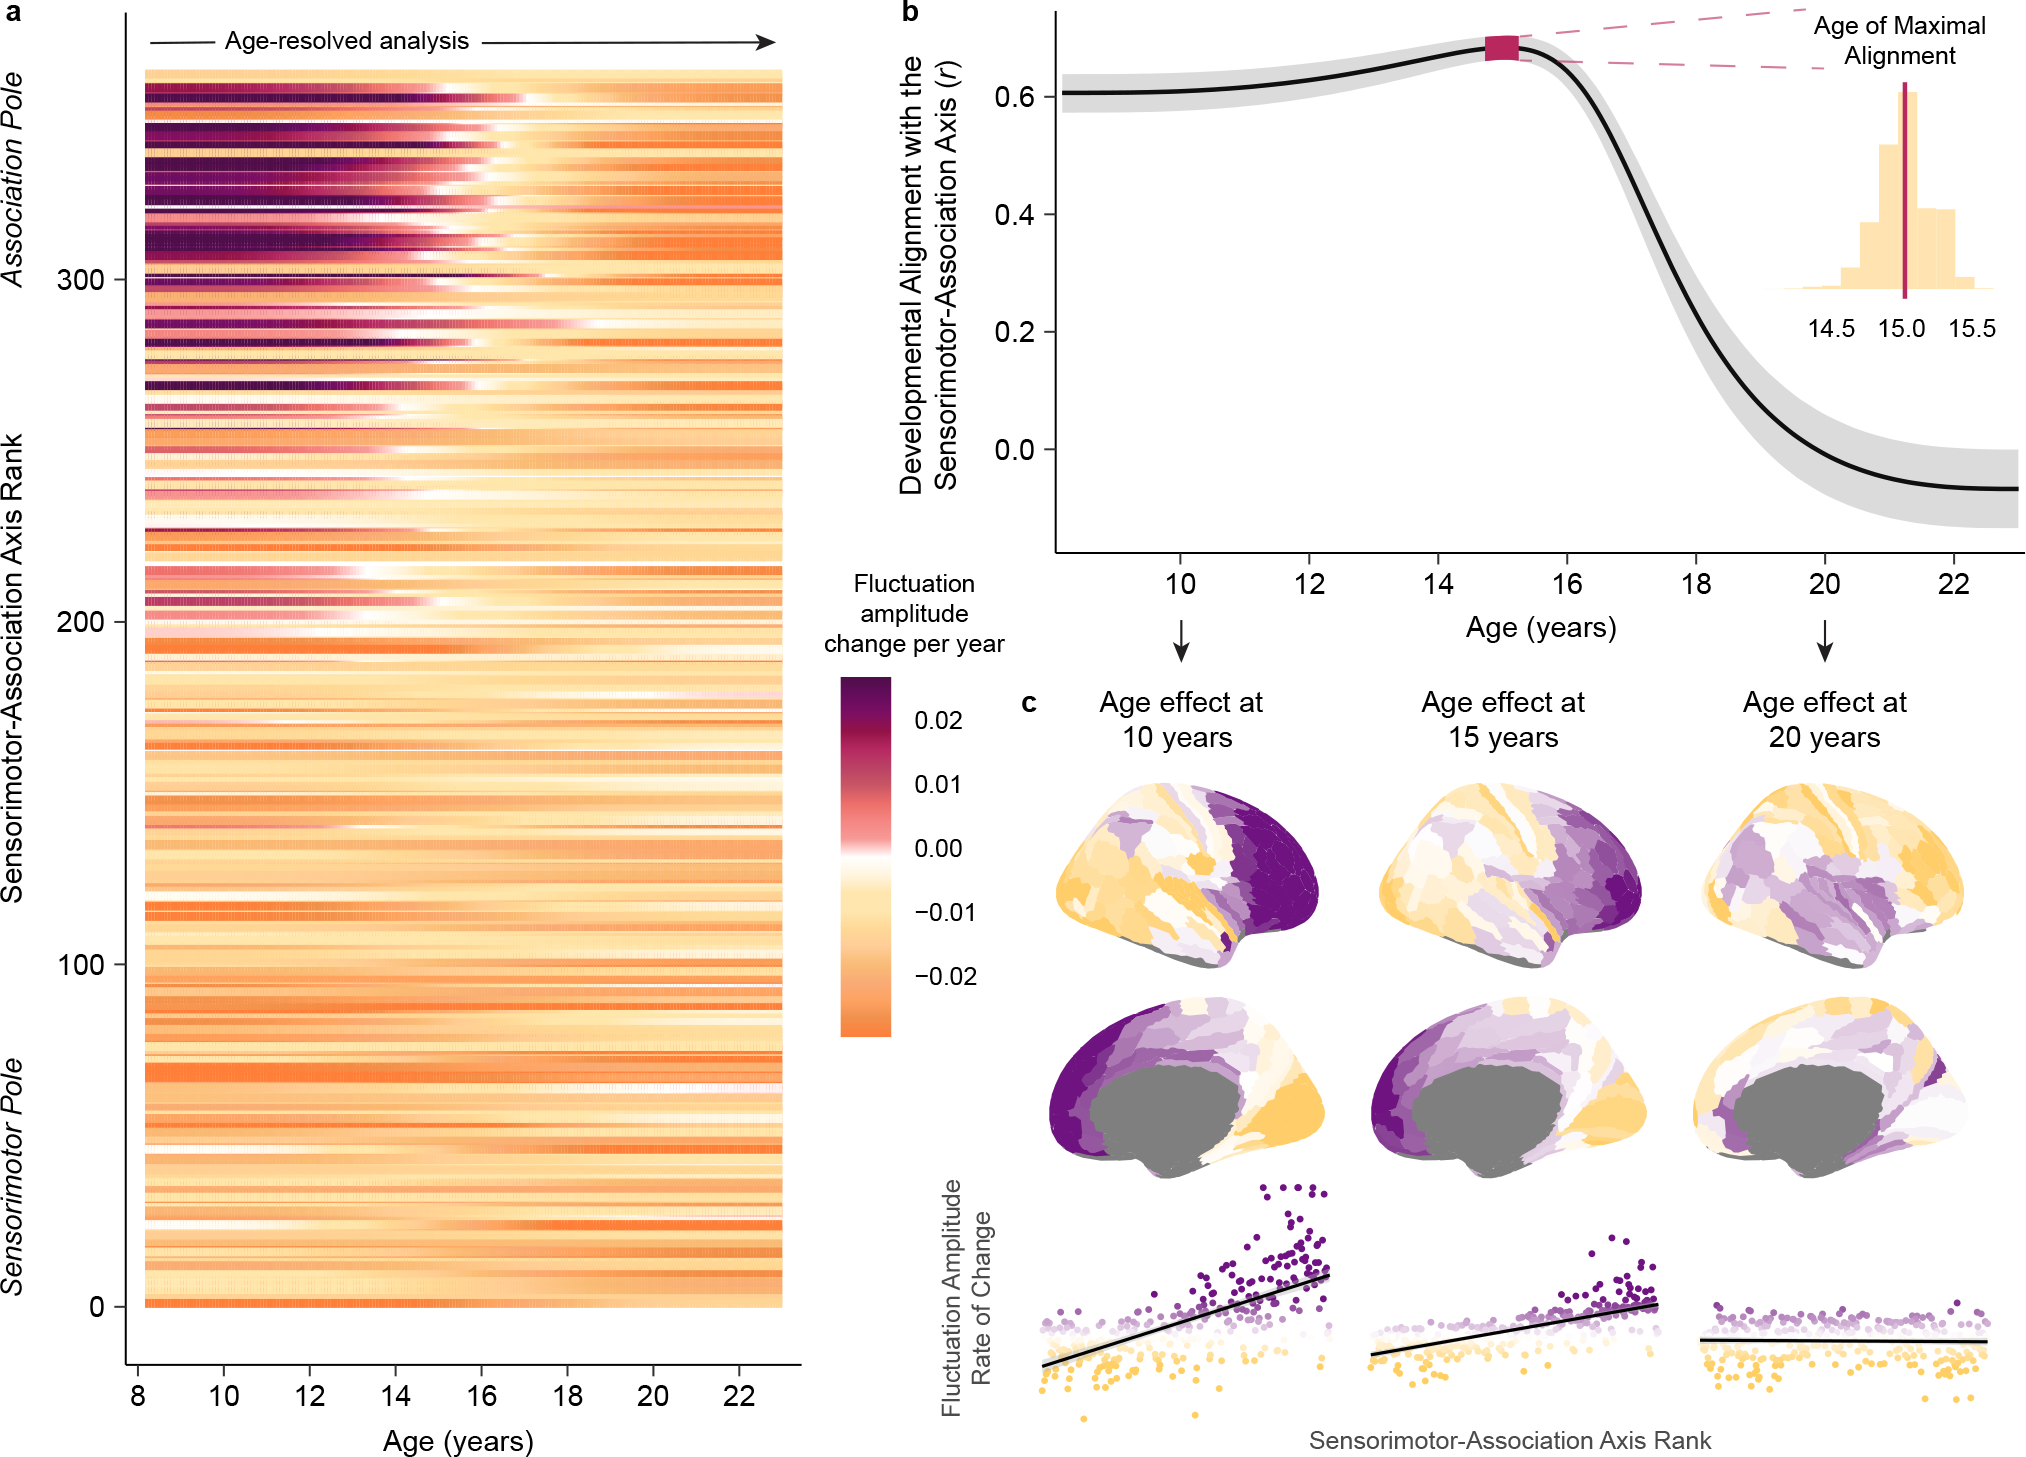
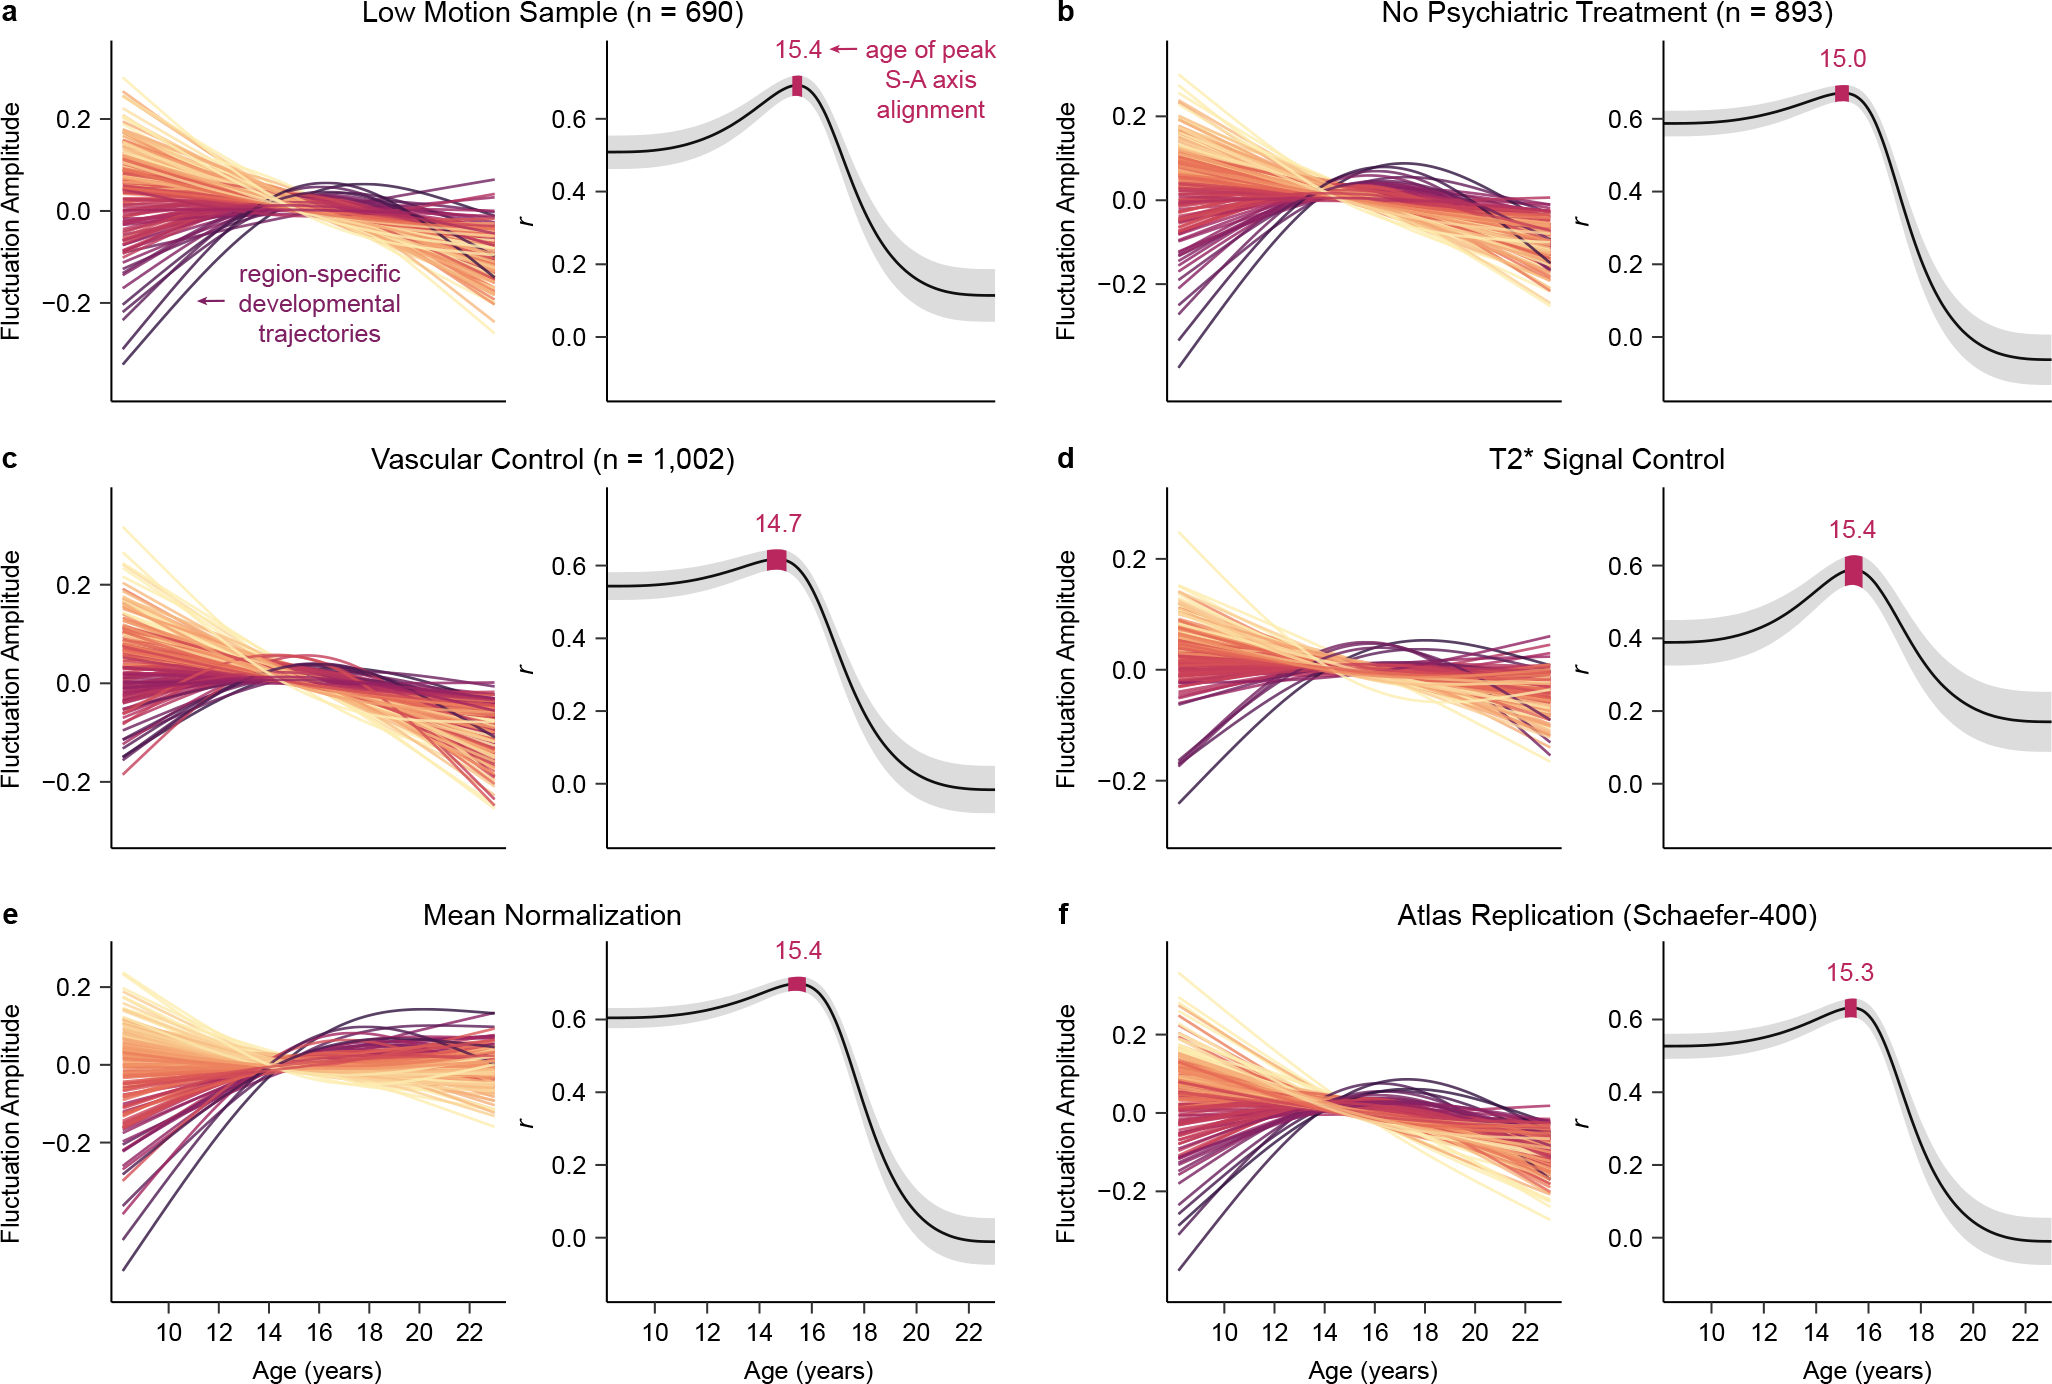
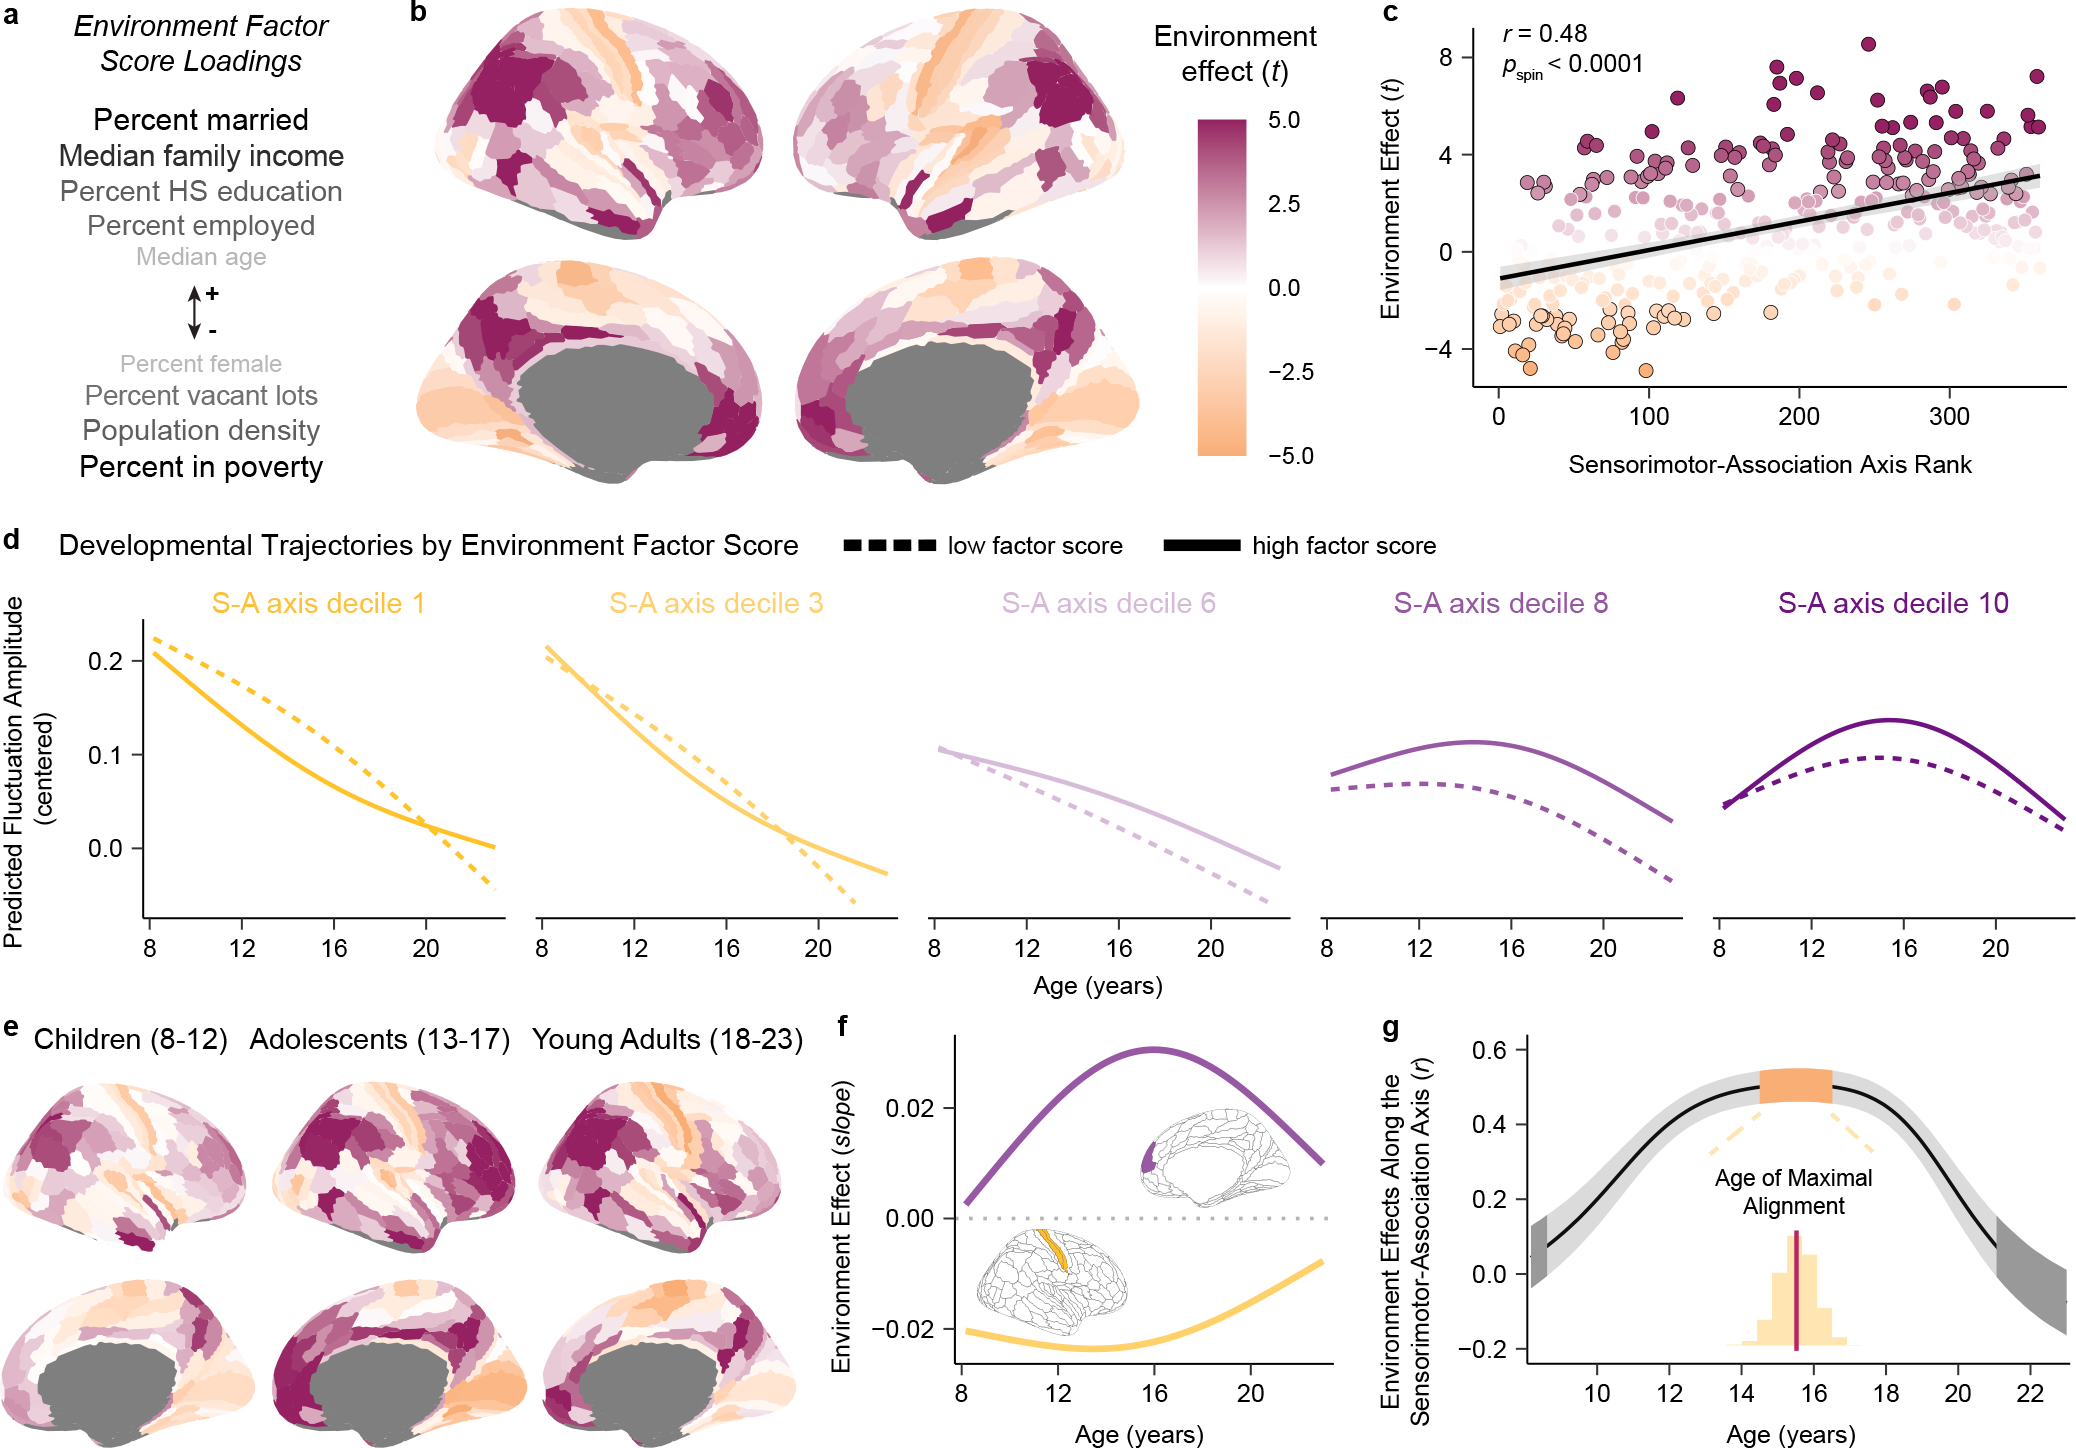
Animal studies of neurodevelopment have shown that recordings of intrinsic cortical activity evolve from synchronized and high amplitude to sparse and low amplitude as plasticity declines and the cortex matures. Leveraging resting-state functional MRI (fMRI) data from 1,033 youths (ages 8-23 years), we find that this stereotyped refinement of intrinsic activity occurs during human development and provides evidence for a cortical gradient of neurodevelopmental change. Declines in the amplitude of intrinsic fMRI activity were initiated heterochronously across regions and were coupled to the maturation of intracortical myelin, a developmental plasticity regulator. Spatiotemporal variability in regional developmental trajectories was organized along a hierarchical, sensorimotor-association cortical axis from ages 8 to 18. The sensorimotor-association axis furthermore captured variation in associations between youths' neighborhood environments and intrinsic fMRI activity; associations suggest that the effects of environmental disadvantage on the maturing brain diverge most across this axis during midadolescence. These results uncover a hierarchical neurodevelopmental axis and offer insight into the progression of cortical plasticity in humans.


Conflict of interest statement

COMPETING INTERESTS STATEMENT

The authors declare the following competing interest: RTS receives consulting income from Octave Bioscience for work wholly unrelated to the present research. All other authors declare no competing interests.

Figures

Fig. 1.
Fig. 1.. Developmental refinement of fluctuation amplitude varies across the cortex.
a) The heterogeneous patterning of fluctuation amplitude age effects (partial R2) is displayed across the cortical surface. b) Fluctuation amplitude developmental trajectories (zero-centered GAM smooth functions) are shown for all left hemisphere cortical regions, revealing a spectrum of age-related change. Trajectories are colored by each region’s age effect using the color bar in panel a. c) Fluctuation amplitude developmental trajectories are shown overlaid on data from all participants for the primary visual cortex (area V1, yellow), the midcingulate gyrus (area p24pr, pink), and the dorsolateral prefrontal cortex (area IFSa, purple). Regional trajectories represent the GAM-predicted fluctuation amplitude value at each age with a 95% credible interval band. The color bars below each regional plot depict the age window(s) wherein fluctuation amplitude significantly changed in that region, shaded by the rate of change, as determined by the first derivative of the age function and the simultaneous 95% confidence interval around this derivative (two-sided).
Fig. 2.
Fig. 2.. Development of fluctuation amplitude spatially and temporally parallels cortical myelin development.
a) The cortical distribution of fluctuation amplitude age effects closely resembles the distribution of T1w/T2w ratio age effects, suggesting interdependent refinement of cortical function and microstructure in youth. Age effects (partial R2) are signed by the sign of the average first derivative of the age smooth function. b) Regions that show larger declines in fluctuation amplitude during childhood and adolescence additionally undergo greater increases in the cortical T1w/T2w ratio in this developmental period. A Spearman’s correlation between age effects for these two measures was significant (r = −0.67, pspin = 0.00045) as assessed by a conservative spin-based spatial rotation test. The negative linear fit between these measures is shown with a 95% confidence interval. c) Maps depicting the age at which fluctuation amplitude began to decrease (earliest significant negative derivative of the age function) and the age of maximal T1w/T2w-indexed myelin growth (largest significant derivative of the age function) reveal temporal similarity in the development of these two measures in youth. d) Across regions, the age at which fluctuation amplitude began to significantly decrease is closely coupled to the age at which the T1w/T2w ratio shows a maximal rate of increase, providing evidence for temporal coordination between functional and structural maturation. A Spearman’s correlation between these temporal measures was significant (r = 0.64, pspin = 0.01565) as assessed by the spatial rotation test procedure. The positive linear relationship between these two measures is plotted with a 95% confidence interval.
Fig. 3.
Fig. 3.. The principal axis of fluctuation amplitude development exhibits convergent spatial embedding with the sensorimotor-association axis.
a) The principal axis of fluctuation amplitude development closely resembles the sensorimotor-association (S-A) axis, illustrating that the spatiotemporal maturation of intrinsic cortical fMRI activity aligns to the brain’s global cortical hierarchy. The S-A axis, derived in Sydnor et al. (2021), is a dominant axis of cortical feature organization that spans from primary sensory and motor cortices (sensorimotor pole; dark yellow), to modality-selective and multimodal cortices, and then to transmodal association cortices (association pole; dark purple). The principal developmental axis is the first component from a PCA conducted on regional fluctuation amplitude maturational trajectories. This component quantitatively captures cortex-wide differences in maturational patterns along a unidimensional spatial gradient. b) Across the cortex, principal developmental axis loadings are strongly related to S-A axis ranks (linear association shown with a 95% confidence interval). The Spearman’s correlation between these two measures, which represent developmental and organizational maps, was significant (r = 0.70, pspin < 0.0001) as assessed by a conservative spin-based spatial rotation test. c) Average model fits depicting the relationship between fluctuation amplitude and age are shown for deciles of the S-A axis. To generate average decile fits, the S-A axis was divided into 10 bins each consisting of 33–34 regions, and age smooth functions were averaged across all regions in a bin. The first decile (darkest yellow; linear decline) represents the sensorimotor pole of the axis, the tenth (darkest purple; inverted U) represents the association pole of the axis. Maturational patterns diverged most between S-A axis poles and varied continuously between them.
Fig. 4.
Fig. 4.. Neurodevelopment unfolds along the sensorimotor-association axis until late adolescence.
a) The rate and direction of developmental change in fluctuation amplitude is displayed for each cortical region from ages 8 to 23 years. Regions are ordered along the y-axis by S-A axis rank. Fluctuation amplitude rate of change, expressed as the change in amplitude per year, was estimated from the first derivative of each region’s GAM smooth function for age. Cortical regions near the association pole of the S-A axis exhibit unique increases in fluctuation amplitude through childhood that culminate in adolescent BOLD amplitude peaks. b) Developmental change in intrinsic fMRI activity aligns with the S-A axis from childhood until late adolescence. The line plot displays age-specific correlation values (r) between regional rates of fluctuation amplitude change and regional S-A axis ranks from ages 8 to 23 years. To obtain reliable estimates of this correlation value at each age, we sampled 10,000 draws from the posterior derivative of each region’s age smooth function and quantified age-specific correlations between derivatives and S-A axis ranks for each draw. The median correlation value obtained across all draws is depicted by the black line and the 95% credible interval around this value is represented by the gray band. We additionally determined the age of maximal alignment between fluctuation amplitude change and S-A axis rank for all 10,000 draws. The 95% credible interval for the age of maximal alignment is depicted on the line plot by the pink band. The full distribution of ages obtained from all draws is portrayed in the inset histogram. c) Age-specific developmental effects (first derivative maps) are visualized on the cortical surface at age 10, 15, and 20 years. Maps are shown above scatterplots that depict the linear relationship (with a 95% confidence interval band) between regional S-A axis ranks and regional age-specific rates of fluctuation amplitude change. Scatterplot points are colored by age-specific rates of change. Developmental refinement of fluctuation amplitude is governed by the S-A axis at ages 10 and 15 years. By age 20, further refinement of fluctuation amplitude is unrelated to the S-A axis.
Fig. 5.
Fig. 5.. Region-specific and cortex-wide developmental patterns are robust to methodological variation.
a-f) Key results are shown for each of the six sensitivity analyses performed. For each analysis, the left plot shows fluctuation amplitude developmental trajectories (zero-centered GAM smooth functions) for left hemisphere regions, colored by age effects. The right plot presents the age-resolved analysis of the correlation between developmental change in fluctuation amplitude and S-A axis rank from ages 8 to 23 years. Both the medial correlation value (r) and the 95% credible interval around this value are shown for the age-resolved analysis. All six sensitivity analyses yielded convergent region-specific and cortex-wide results, confirming that our developmental findings were not being driven by head motion in the scanner (a), the use of psychotropic medications (b), age-related changes in cerebrovascular perfusion (c), inter-scan differences in T2* signal strength (d), global effects (e), or the specific atlas used for cortical parcellation (f).
Fig. 6.
Fig. 6.. Associations between fluctuation amplitude and the developmental environment vary along the sensorimotor-association axis in adolescence.
a) An environment factor score captures multiple features of each child’s neighborhood environment. Variables listed above (+) and below (−) the arrow positively and negatively loaded onto the factor score, respectively. Darker and larger text indicates stronger loadings. Higher factor scores reflect greater neighborhood-level socioeconomic advantage. b) A cortical map displaying regional associations (quantified by model t-values) between environment factor scores and fluctuation amplitude is displayed; the map partly recapitulates the S-A axis. c) Each region’s environment effect (t-value) is plotted against its S-A axis rank (linear fit shown with a 95% confidence interval). Regions with a significant environment effect following correction for multiple comparisons are outlined in black. The S-A axis explains significant variability in brain-environment associations (Spearman’s correlation with a spatial rotation-based significance test: r = 0.48, pspin < 0.0001). d) Fluctuation amplitude developmental trajectories are displayed for low and high environment factor scores for five deciles of the S-A axis, illustrating environment-associated differences in this measure by developmental timing. e) Cortical maps depicting region-wise associations between environment factor scores and fluctuation amplitude (as in b) in child, adolescent, and young adult groups show subtle differences in associations throughout development. Magenta and orange denote positive and negative environment effects (t-values), as in b. f) Age-specific environment effects are shown for an exemplar primary sensorimotor region (primary somatosensory cortex, area 3b, yellow) and transmodal association region (medial prefrontal cortex, area 9m, purple). The magnitude of effects is largest in adolescence in these regions. g) Regional differences in environment associations are most organized along the S-A axis in adolescence, as revealed by age-specific correlations between regional environment effects and S-A axis ranks. The plot depicts the median correlation value (r) at each age (black line) and the 95% credible interval around this value (gray band) obtained by sampling the posterior distribution of regional age-by-environment interaction GAMs 10,000 times. The orange and dark gray bands respectively designate credible intervals for the ages of maximal and zero correlation of environment effects with the S-A axis.

References

    1. Sydnor VJ & Satterthwaite TD Neuroimaging of plasticity mechanisms in the human brain: from critical periods to psychiatric conditions. Neuropsychopharmacology 48, 219–220 (2023). - PMC - PubMed
    1. Cooper EA & Mackey AP Sensory and cognitive plasticity: implications for academic interventions. Curr. Opin. Behav. Sci. 10, 21–27 (2016). - PMC - PubMed
    1. Sisk LM & Gee DG Stress and adolescence: vulnerability and opportunity during a sensitive window of development. Curr. Opin. Psychol. 44, 286–292 (2022). - PMC - PubMed
    1. Sydnor VJ et al. Neurodevelopment of the association cortices: Patterns, mechanisms, and implications for psychopathology. Neuron 109, 2820–2846 (2021). - PMC - PubMed
    1. Bethlehem RAI et al. Brain charts for the human lifespan. Nature 604, 525–533 (2022). - PMC - PubMed

METHODS-ONLY REFERENCES

    1. Satterthwaite TD et al. Neuroimaging of the Philadelphia neurodevelopmental cohort. NeuroImage 86, 544–553 (2014). - PMC - PubMed
    1. Esteban O et al. fMRIPrep: a robust preprocessing pipeline for functional MRI. Nat. Methods 16, 111–116 (2019). - PMC - PubMed
    1. Avants BB et al. A reproducible evaluation of ANTs similarity metric performance in brain image registration. NeuroImage 54, 2033–2044 (2011). - PMC - PubMed
    1. Dale AM, Fischl B & Sereno MI Cortical surface-based analysis. I. Segmentation and surface reconstruction. NeuroImage 9, 179–194 (1999). - PubMed
    1. Ciric R et al. Benchmarking of participant-level confound regression strategies for the control of motion artifact in studies of functional connectivity. NeuroImage 154, 174–187 (2017). - PMC - PubMed

Publication types