

doi: 10.1038/s41592-023-01819-w.
Epub 2023 Mar 27.
In vivo photopharmacology with a caged mu opioid receptor agonist drives rapid changes in behavior
Affiliations
- PMID: 36973548
- PMCID: PMC10569260
- DOI: 10.1038/s41592-023-01819-w
Item in Clipboard
In vivo photopharmacology with a caged mu opioid receptor agonist drives rapid changes in behavior
Nat Methods.
2023 May.
Abstract
Photoactivatable drugs and peptides can drive quantitative studies into receptor signaling with high spatiotemporal precision, yet few are compatible with behavioral studies in mammals. We developed CNV-Y-DAMGO-a caged derivative of the mu opioid receptor-selective peptide agonist DAMGO. Photoactivation in the mouse ventral tegmental area produced an opioid-dependent increase in locomotion within seconds of illumination. These results demonstrate the power of in vivo photopharmacology for dynamic studies into animal behavior.
© 2023. The Author(s), under exclusive licence to Springer Nature America, Inc.
Conflict of interest statement
Competing interests
The authors declare no competing financial interests.
Figures
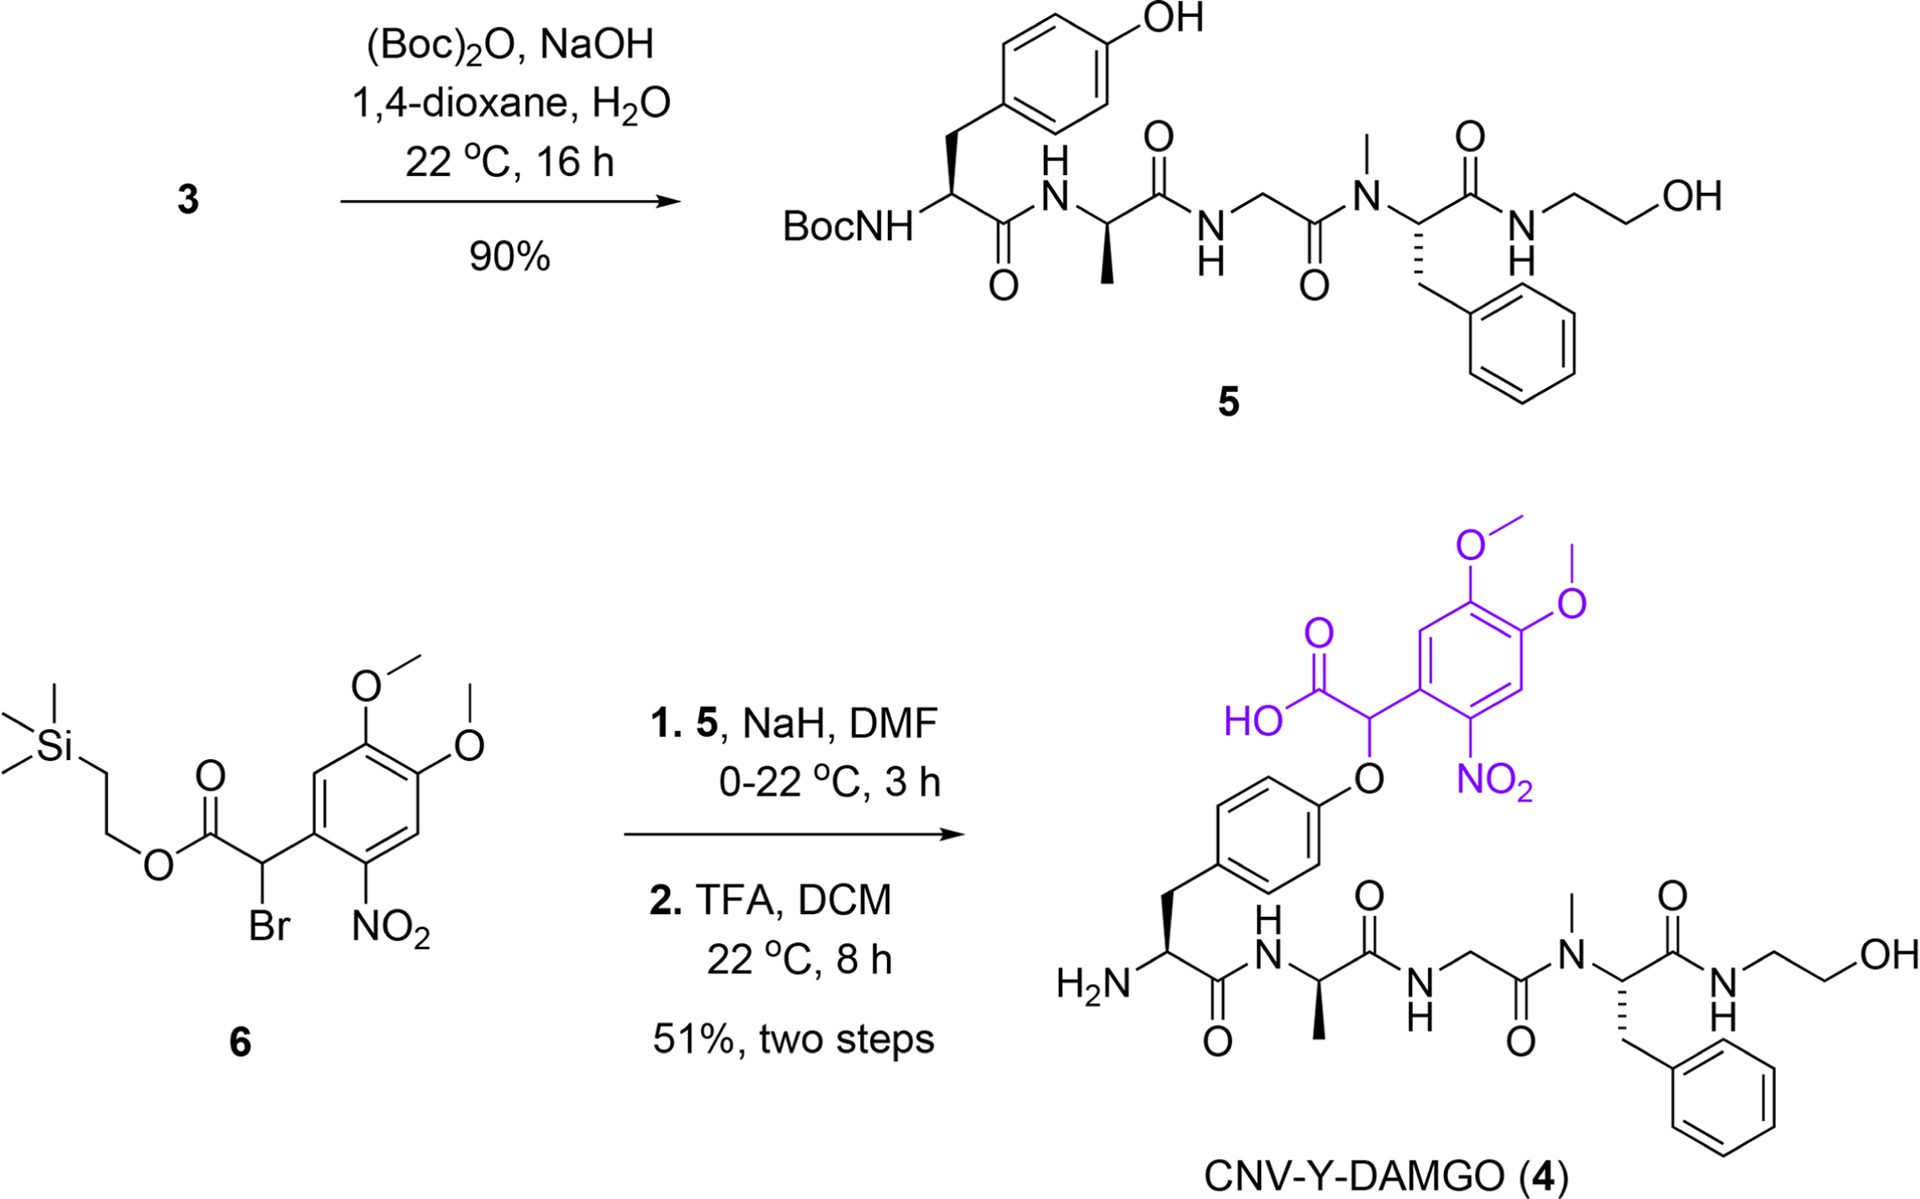
The N-terminal amine in DAMGO (3) was Boc-protected prior to phenol alkylation with 6. Global deprotection with TFA produced CNV-Y-DAMGO (4) in good overall yield
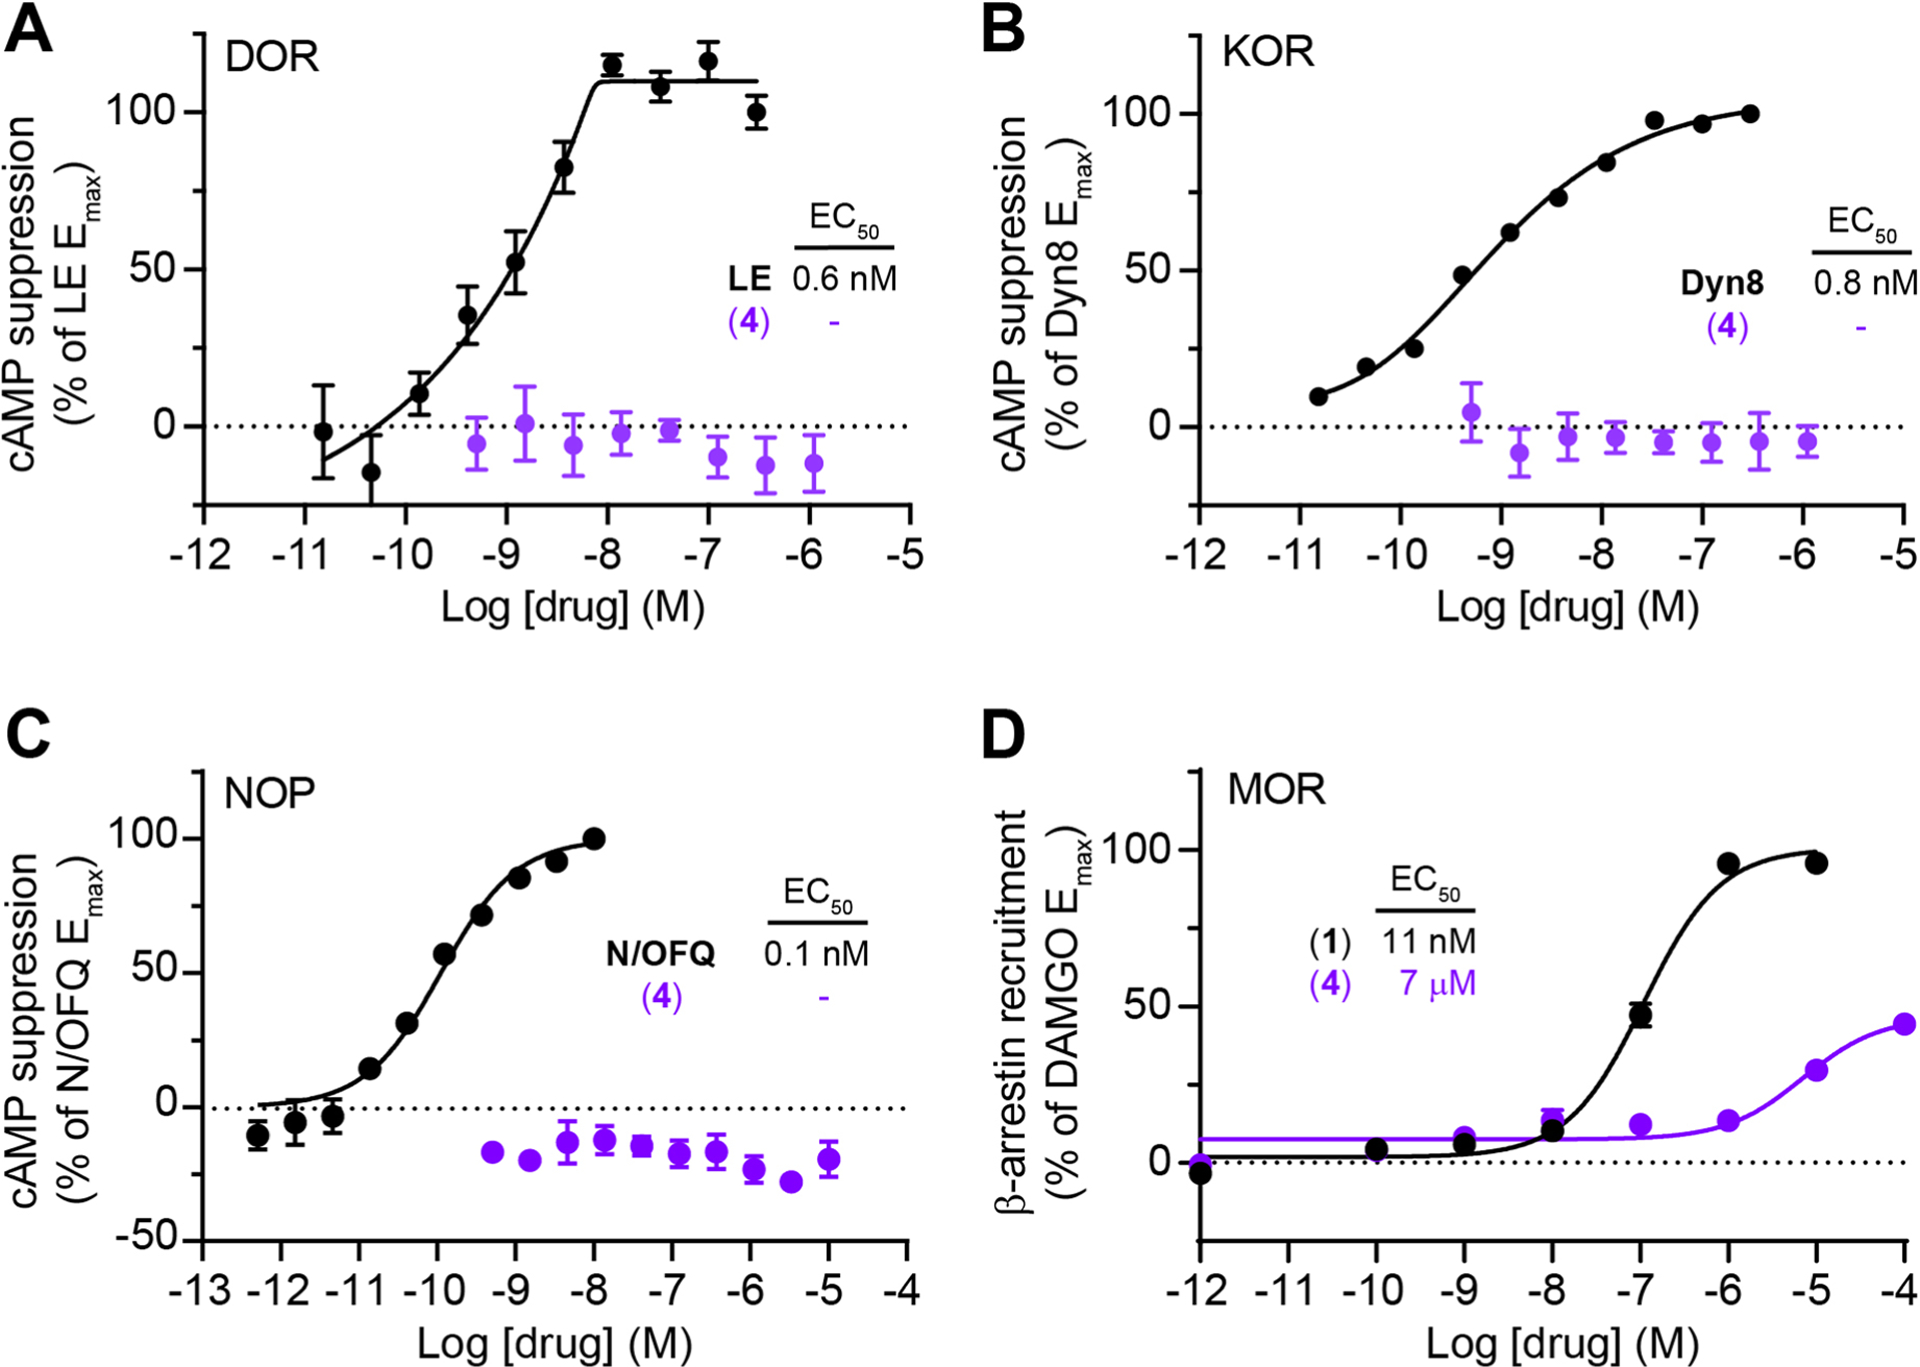
(A) Dose-response curves at the delta opioid receptor (DOR) using a GloSensor assay of cAMP signaling in HEK293T cells (n = 5 wells per data point, 1 representative independent experiment shown). Data were normalized to the maximal response to leucine-enkephalin (LE, 1 μM) and are expressed as the mean ± SEM. (B) Same as A, but using the kappa opioid receptor (KOR) and dynorphin A(1–8) (Dyn8, 1 μM) for normalization. (C) Same as A, but using the nociceptin/orphanin FQ receptor (NOP) and nociception/orphanin FQ (N/OFQ, 1 μM) for normalization. (D) Dose-response curves at the mu opioid receptor (MOR) using a NanoBiT-based luminescence complementation assay of β-arrestin signaling in HEK293T cells (n = 4 wells per data point, 3 independent experiments averaged). Data were normalized to the maximal response to DAMGO (10 μM) and are expressed as the mean ± SEM.

(A) Waterfall plot of HPLC chromatograms of CNV-Y-DAMGO (0.4 mM) during illumination with 375 nm light (10 mW) in PBS, pH 7.2. (B) Enlarged HPLC chromatogram after 2 min of illumination (top) and mass spectrograms corresponding to the indicated peaks (bottom). (C) HPLC chromatograms of a sample of CNV-Y-DAMGO (1 mM) in PBS left for 24 hours in the dark. (D) Summary of MNI-Glutamate and CNV-Y-DAMGO photouncaging reactions over time, as measured by HPLC (n = 3 samples per condition). Samples were optical density-matched at 375 nm in PBS and illuminated with 375 nm laser irradiation. Data are expressed as the mean ± SEM. (E) UV-VIS spectrum of samples of CNV-Y-DAMGO (0.4 mM) in PBS before and after irradiation with 375 nm light (10 mW) for the indicated time periods.
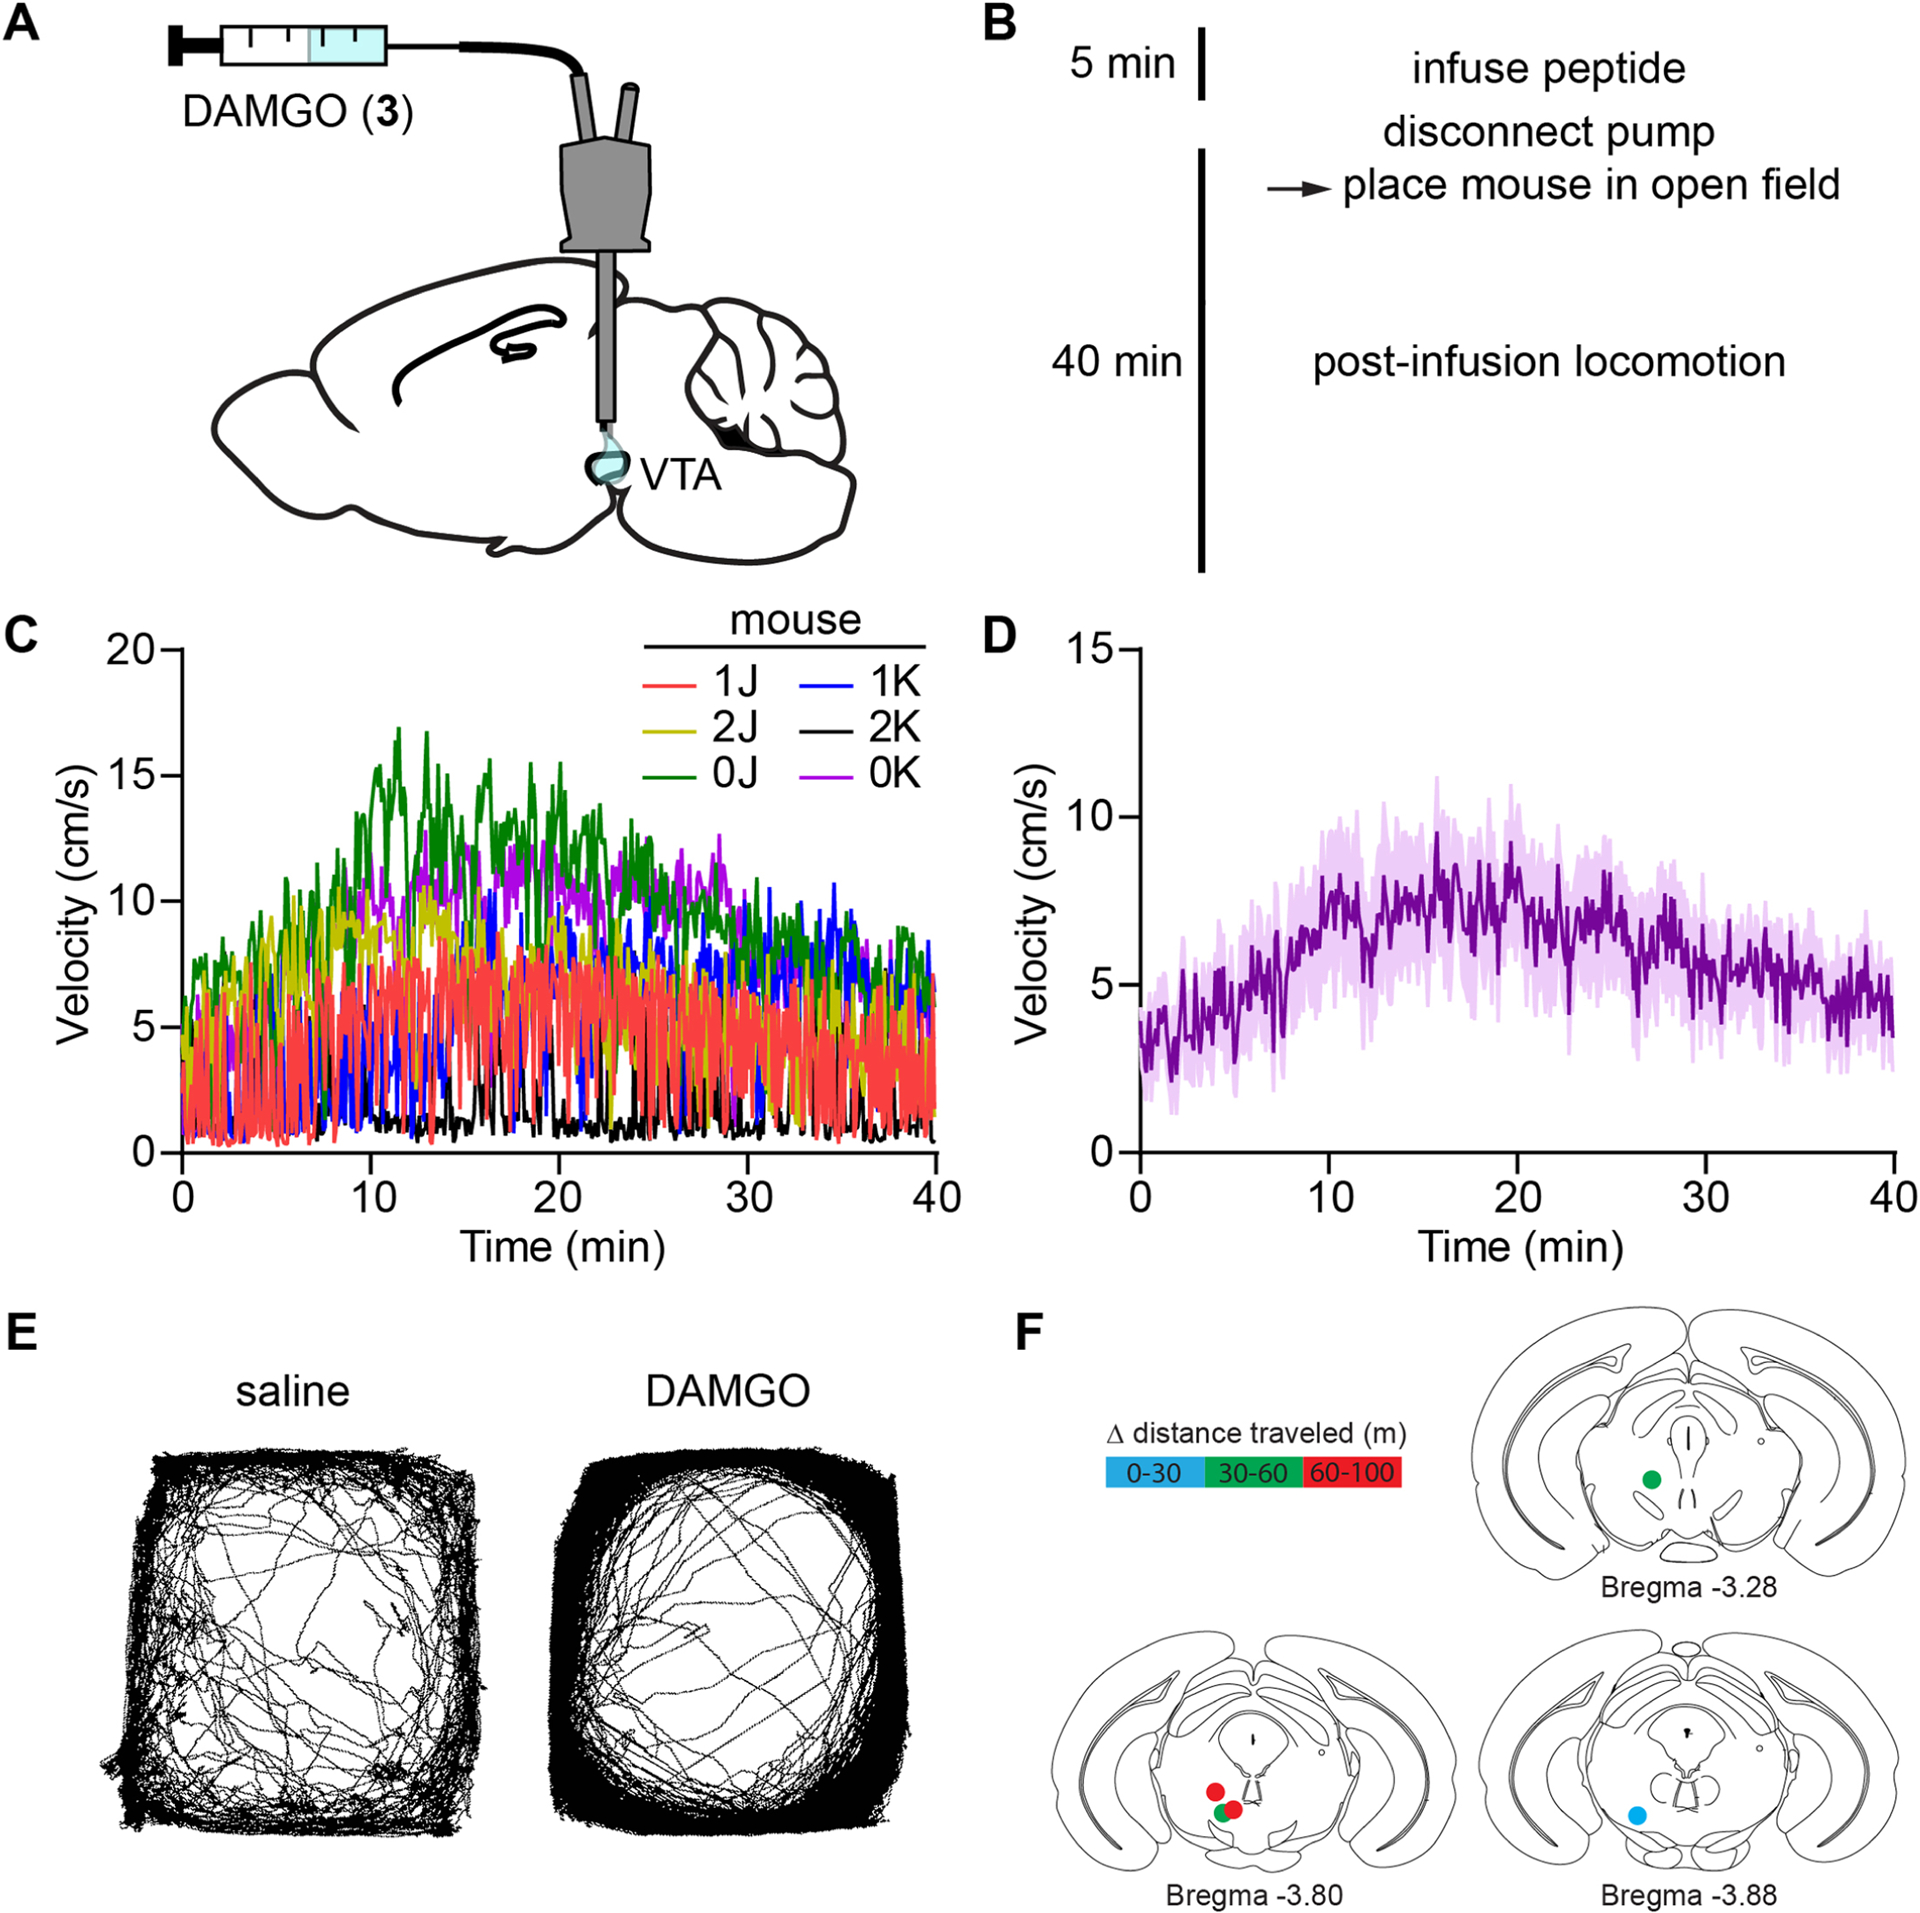
(A) Schematic of the experimental configuration for DAMGO infusion through an optofluidic cannula. (B) Experimental timeline. (C) Movement velocity vs. time in the open field for a cohort of mice after DAMGO (200 μM, 0.5 uL) infusion. (D) Average data from C (n = 6 mice). Data are expressed as the mean ± SEM. (E) Example maps of open field locomotor activity from a single mouse after infusion of either saline or DAMGO. (F) Change in distance traveled (after-before uncaging) mapped to the implant location for the mice shown in Fig. 2g,h.

(A) Design of a caged DAMGO based on caged [Leu5]-enkephalin. (B) Dose-response curves were obtained using a GloSensor assay of cAMP signaling in HEK293T cells (n=3 experimental replicates, each run in quintuplicate). Data were normalized to the maximal response to DAMGO (1 μM) and are expressed as the mean ± SEM. (C) Schematic of the experimental configuration for photouncaging of CNV-Y-DAMGO while recording electrically-evoked inhibitory synaptic transmission from CA1 hippocampal basket cells (BC) impinging on pyramidal cells (PC). (D) Baseline-normalized, average inhibitory post-synaptic current (IPSC) amplitude over time during bath application of DAMGO (1 μM, n = 15 cells from 14 mice) or CNV-Y-DAMGO (1 μM, n = 6 cells from 4 mice). Data are expressed as the mean ± SEM. (E) Representative example of IPSC amplitude over time during bath application of CNV-Y-DAMGO (1 μM) and repeated photolysis using 355 laser flashes (84 mW, 5 ms). Inset: Example IPSCs immediately before (black) and after (purple) CNV-Y-DAMGO uncaging. Scale bars: × = 25 ms, y = 500 pA. (F) Summary data comparing the fraction of baseline IPSC suppression in response to either DAMGO (1 μM) bath application, CNV-Y-DAMGO (1 μM) bath application, CNV-Y-DAMGO uncaging, and CNV-Y-DAMGO uncaging in the presence of the mu-selective antagonist CTAP (1 μM) (DAMGO (n = 15 cells from 14 mice), CNV-Y-DAMGO (n = 6 cells from 4 mice), CNV-Y-DAMGO + UV (n = 6 cells from 4 mice), CNV-Y-DAMGO + UV + CTAP (n = 7 cells from 2 mice)). P values were determined using a two-tailed unpaired t-test. Data are expressed as the mean ± SEM.
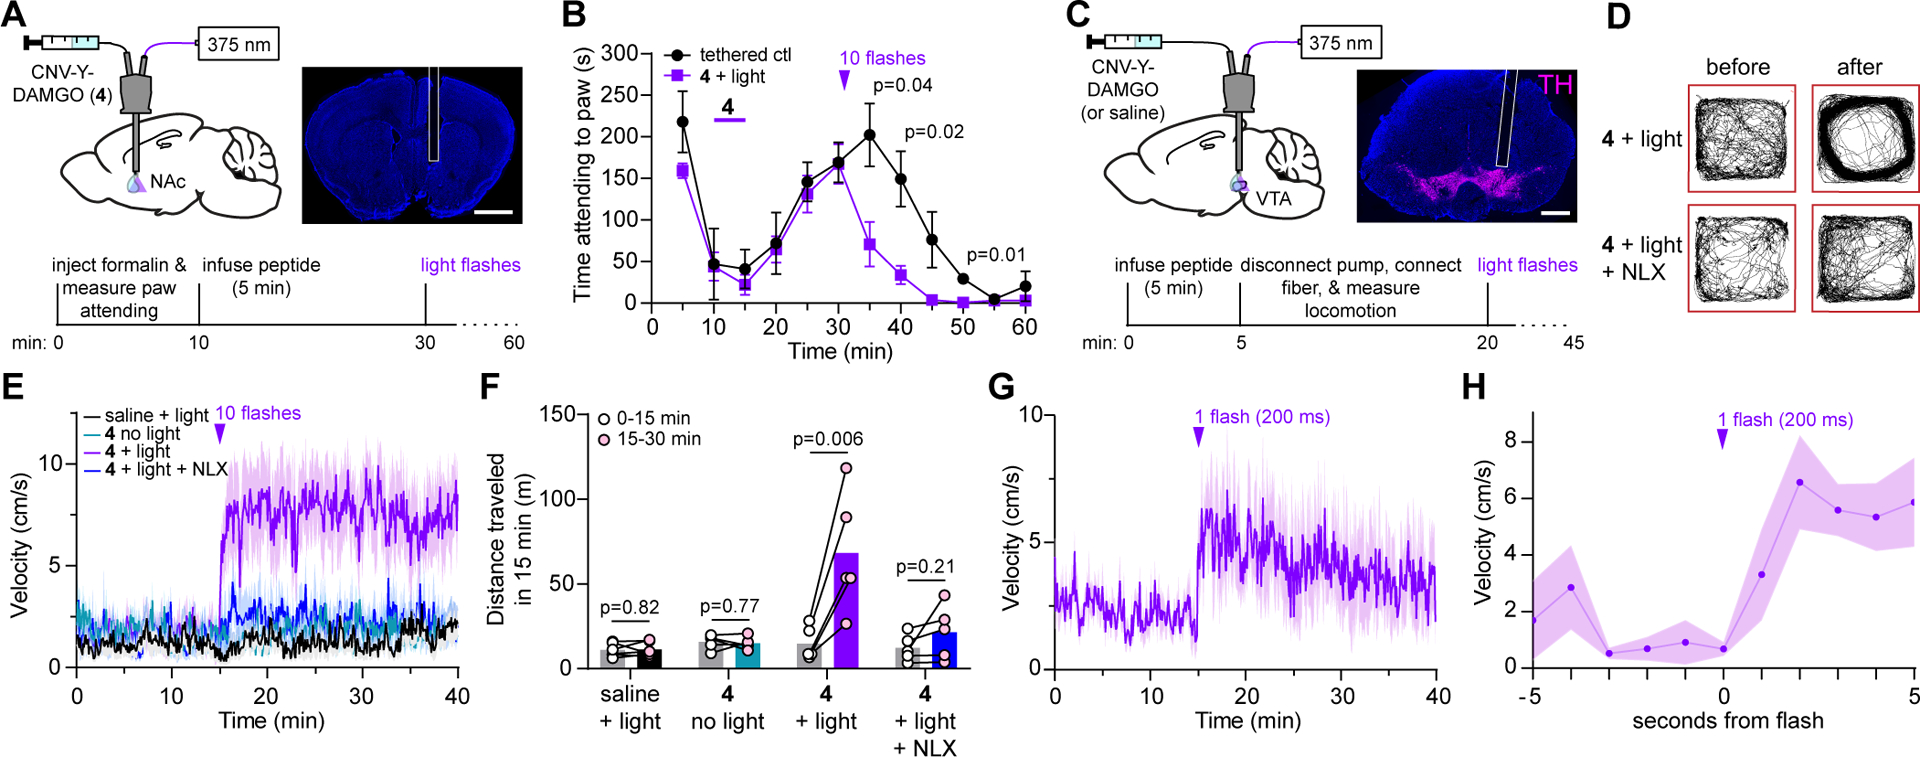
(A) Schematic of the experimental configuration for photo-uncaging through an optofluidic cannula in the NAc-mSh (top left), example image of cannula placement above the NAc-mSh (top right, scale bar = 1 mm), and experimental timeline for uncaging during the formalin assay (bottom). (B) Average time spent attending to the inflamed paw for a cohort of tethered control mice (n=4 mice) and mice treated with CNV-Y-DAMGO and light (n=6 mice). The time of the uncaging stimulus is indicated by the purple arrowhead. P values were determined using a two-tailed Mann Whitney test. Data are expressed as the mean ± SEM. (C) Schematic of the experimental configuration for photo-uncaging in the VTA (top left), example image of cannula placement above the VTA, indicated by immunohistochemical labeling of tyrosine hydroxylase (TH, top right, scale bar = 1 mm), and experimental timeline for uncaging in the open field (bottom). (D) Example maps of open field locomotor activity from a single mouse before and after uncaging. (E) Average movement velocity vs. time for a cohort of mice treated with either saline and light (10 flashes, n=6 mice), CNV-Y-DAMGO without light (n = 5 mice), CNV-Y-DAMGO with light (n = 5 mice), and CNV-Y-DAMGO with light in the presence of the opioid antagonist naloxone (NLX) (n = 5 mice). Data are expressed as the mean ± SEM. (F) Summary data of distance traveled in the 15 minutes before and after application of the 10-flash uncaging stimulus (from the data shown in E). P values were determined using a two-tailed paired t-test. (G) Average movement velocity vs. time upon exposure to a single light flash (n = 5 mice). Data are expressed as the mean ± SEM. (H) Same data as in G, but sampled at 1 Hz and zoomed in around the uncaging stimulus. Data are expressed as the mean ± SEM.
References
Publication types
MeSH terms
Substances
Grants and funding
LinkOut - more resources
Full Text Sources
Research Materials
