. 2023 Apr;20(4):523-535.
doi: 10.1038/s41592-023-01807-0. Epub 2023 Mar 27.

Reliability and accuracy of single-molecule FRET studies for characterization of structural dynamics and distances in proteins

Affiliations

Reliability and accuracy of single-molecule FRET studies for characterization of structural dynamics and distances in proteins

Ganesh Agam et al. Nat Methods. 2023 Apr.

Abstract

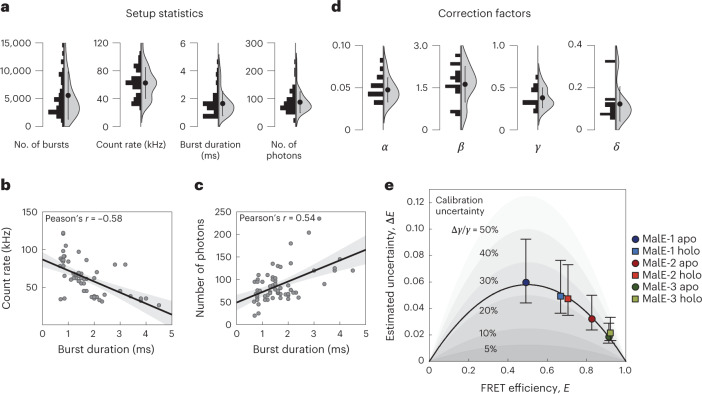
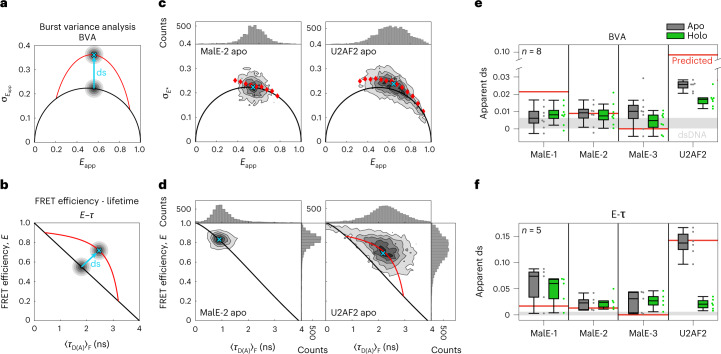
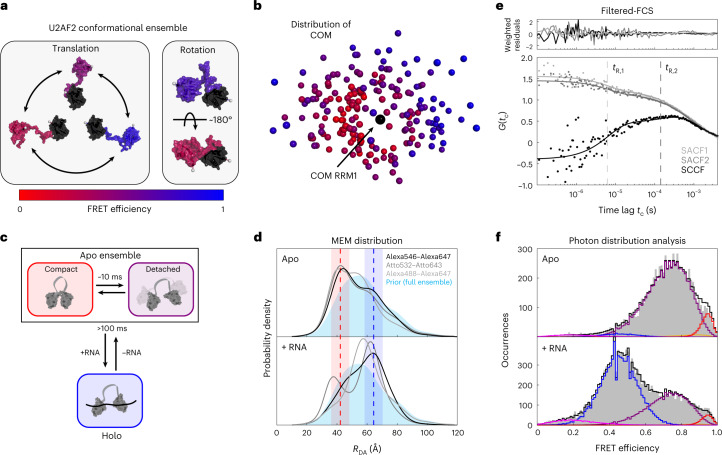
Single-molecule Förster-resonance energy transfer (smFRET) experiments allow the study of biomolecular structure and dynamics in vitro and in vivo. We performed an international blind study involving 19 laboratories to assess the uncertainty of FRET experiments for proteins with respect to the measured FRET efficiency histograms, determination of distances, and the detection and quantification of structural dynamics. Using two protein systems with distinct conformational changes and dynamics, we obtained an uncertainty of the FRET efficiency ≤0.06, corresponding to an interdye distance precision of ≤2 Å and accuracy of ≤5 Å. We further discuss the limits for detecting fluctuations in this distance range and how to identify dye perturbations. Our work demonstrates the ability of smFRET experiments to simultaneously measure distances and avoid the averaging of conformational dynamics for realistic protein systems, highlighting its importance in the expanding toolbox of integrative structural biology.


Conflict of interest statement

T.D.C. and A.N.K. are founders of different companies selling single-molecule fluorescence microscopes (Exciting Instruments, Oxford Nanoimager). The other authors declare no competing interests.

Figures

Fig. 1
Fig. 1. Experimental design of MalE as a protein model system for smFRET studies.
a, Crystal structure of MalE in its ligand-free apo state (PDB ID 1OMP) with domains D1 and D2 linked by flexible beta sheets (highlighted in blue). b, The crystal structure of MalE (rotated by 90° as compared to a in the apo (gray, PDB ID 1OMP) and holo (green, PDB ID 1ANF) states with mutations at K29C-S352C (MalE-1), D87C-A186C (MalE-2) and A134C-A186C (MalE-3) indicated in black. Note, each mutant only contains one cysteine pair and was measured using the Alexa546–Alexa647 FRET pair. The estimated mean position of the fluorophores from AV calculations are shown as red spheres. c, FRET efficiency E histograms for three MalE mutants, MalE-1 (left), MalE-2 (middle) and MalE-3 (right), in the absence and presence of 1 mM maltose (bottom, green) for one exemplary dataset measured in laboratory 1. The distribution is fitted to a Gaussian distribution. The reported mean FRET efficiencies for 16 laboratories are shown below (due to experimental difficulties, the results of three laboratories were excluded; Supplementary Table 1). The mean FRET efficiency and the standard deviation of all 16 laboratories are given by the black line and gray area. d, Individual FRET efficiency differences for each laboratory, between the apo and holo states, EholoEapo, for MalE-1 (left), MalE-2 (middle) and MalE-3 (right). The mean FRET efficiency difference and the standard deviation of all 16 laboratories are given by the black line and gray area. Source data
Fig. 2
Fig. 2. The experimental system of U2AF2 (RRM1, 2) and a comparison of FRET efficiency histograms from seven different laboratories.
a, Schematic of the dynamics of U2AF2. The apo state (in gray, top) undergoes fast exchange between an ensemble of detached structures of which five representative structures are displayed. A slower exchange occurs between the dynamic detached ensemble and a compact conformation (PDB ID 2YHO) shown below. The holo state (in green, PDB ID 2YH1) bound to a U9 RNA ligand (in dark gray) assumes a well-defined, open conformation. Positions of cysteine mutations introduced for labeling (L187 in RRM1 and G326 in RRM2) are depicted as black spheres with the mean dye position determined by AV calculations indicated by red spheres. b,c, SmFRET efficiency histograms reported by the seven participating laboratories for apo (b) and holo (c) measurements of U2AF2. The top shows the individual FRET efficiency histograms and the bottom shows the average FRET efficiency histogram (solid line) with standard deviation (light area). d, SmFRET efficiency E histograms of U2AF2 in the apo state. The top shows a representative 1D FRET efficiency histogram with a Gaussian fit (laboratory 1). The middle shows the reported mean FRET efficiencies reported by seven laboratories. The mean value from all datasets is 0.739 ± 0.029, shown above with the corresponding standard deviation in gray. The bottom shows the extracted mean FRET values after reanalysis of the collected data. After reanalysis, the agreement improved to 0.742 ± 0.008. e, SmFRET efficiency histogram comparisons of U2AF2 in the holo state. 5 µM of U9 RNA was used to obtain the holo state. The top shows a representative 1D FRET efficiency histogram of laboratory 1 fitted to two Gaussian distributions to determine the FRET efficiencies of the different subpopulations, yielding mean FRET efficiencies of 0.44 for RNA-bound and 0.76 for the RNA-free conformation. The middle shows the mean FRET efficiencies reported by the seven laboratories. The mean values from all seven of the datasets were 0.45 ± 0.04 for the RNA-bound conformation (in green) and 0.78 ± 0.04 for the RNA-free conformation (in gray). The bottom shows the reanalysis of the holo measurements yielding values of 0.42 ± 0.02 and 0.77 ± 0.03 for RNA-bound and RNA-free fractions, respectively. Source data
Fig. 3
Fig. 3. Setup-dependent parameters and calibration uncertainty.
a, The distribution of the parameters quantifying the statistics of the measurements and the performance of the setups used for both MalE and U2AF2 measurements are shown as histograms and violin plots for the measurements from eight laboratories. The circle and whiskers in the violin plot indicate the mean and standard deviation (n = 64, averaged over eight samples measured in the eight different laboratories). Sample-dependent distributions of the shown parameters are given in Supplementary Fig. 9. b,c, Pairwise plots of the average count rate (b) and the number of photons (c) against the burst duration. The same datasets are plotted as used for a. While the count rate decreases slightly for longer burst durations, a positive correlation is observed for the acquired number of photons per burst and the burst duration, indicating that larger observation volumes result in a higher accumulated signal per molecule. Correlations between all parameters are shown in Supplementary Fig. 10. Error bands indicate the 95% confidence intervals of the regression. d, The distributions of the four correction factors for the calculation of accurate FRET efficiencies for all the MalE measurements are shown as histograms and violin plots for the measurements from all laboratories. The circle and whiskers in the violin plot indicate the mean and standard deviation (n = 64, averaged over eight samples measured in the eight different laboratories). e, A plot of the standard deviation of the reported FRET efficiencies from 16 laboratories (as a measure of the experimental uncertainty) against the average FRET efficiency for the MalE mutants 1–3 reveals that lower uncertainties are observed for higher FRET efficiencies. The black line represents a fit of the estimated uncertainties under the assumption that the variations arise solely due to uncertainty in the γ factor (equation (1)). The inferred relative uncertainty of the γ factor is around 23%. Shaded areas indicate relative uncertainties of 5–50%. Error bars indicate 95% confidence intervals around the average value. Source data
Fig. 4
Fig. 4. Detection and characterization of conformational dynamics on the submillisecond timescale in MalE and U2AF2.
a,b, Schematic representations of BVA (a) and E–τ (b) plots. The ds is defined as the excess standard deviation compared to the static line (shown in black). Dynamic FRET lines are indicated in red. c, BVA of MalE-2 labeled with Alexa546–Alexa647 without maltose (apo, left) and U2AF2 labeled with Atto532–Atto643 without RNA (apo, right). Here, the BVA is based on a photon binning of five photons. Red diamonds indicate the average standard deviation of all bursts within a FRET efficiency range of 0.05. The mean positions of the populations (cyan crosses) were determined by fitting a two-dimensional Gaussian distribution to the data (Supplementary Note 5). d, The plots of the FRET efficiency E versus intensity-weighted average donor lifetime τD(A)F of the same measurement as in c. The donor-only population was excluded from the plot. For MalE-2, the population falls on the static FRET line, while a clear ds is observed for U2AF2. The endpoints of the dynamic FRET line for U2AF2 were determined from a subensemble analysis of the fluorescence decay. e,f, The apparent ds of the peak of the population was determined graphically from BVA (eight laboratories for MalE and seven laboratories for U2AF2, respectively) (e) and E–τ (five laboratories) (f) plots (Methods). For U2AF2 in the holo state, the ds was assessed only for the low-FRET RNA-bound population. Boxes indicate the median and 25/75% quartiles of the data. Whiskers extend to the lowest or highest data point within 1.5 times the interquartile range. The gray area indicates the ds obtained for the dsDNA used in a previous study based on measurements performed in laboratory 1 for BVA (dsDNA = 0.0033 ± 0.0033) and laboratory 2 for the E–τ plot (dsDNA = 0.0026 ± 0.0044). The horizontal red lines indicate the expected ds for a potential conformational exchange between the apo and holo states. We computed the expected change in FRET efficiency using their structural models in the PDB (Supplementary Note 6 and Supplementary Table 9). Source data
Fig. 5
Fig. 5. Assessing the accuracy of smFRET-derived distances in MalE.
ad, AV calculations and model-based interdye distances. a, Schematic of Alexa546 attached to MalE (PDB 1OMP) showing the parameters needed for the AV calculations using the AV3 model (Supplementary Table 10). b, Fluorescence anisotropy decays of single-cysteine mutants for the donor (Alexa546, left) and acceptor (Alexa647, right) at the labeling positions K29C and S352C. Solid lines represent fits to a model with two or three rotational components (Supplementary Tables 11 and 12 and Supplementary Note 8). c, AV (light color) and ACV (dark color) calculations for Alexa546 (cyan) and Alexa647 (pink) at labeling positions 352 and 29. The zoom-ins show the mean positions of the dyes based on the AV (light shade) and ACV (darker shade) models. d, Comparison of the experimentally obtained FRET-averaged distance RE with the theoretical model distances using the AV (filled squares) and ACV (empty squares) calculations. Errors represent the standard deviation in experimental distances (n = 16 laboratories for MalE mutants 1–3, n = 2 laboratories for MalE mutants 4–5, n = 7 laboratories for U2AF). The solid line represents a 1:1 relation and the gray area indicates an uncertainty of ±3 Å for a Förster radius of R0 = 65 Å. MalE-4 and -5 were measured by two laboratories. e, Detection of dye-specific protein interactions. Top shows the five MalE mutants and U2AF2 labeled with different dye combinations to determine the donor–acceptor-combined residual anisotropy, 〈rc,∞tr,ss (n = 3 laboratories). Bottom shows the distance uncertainty relating to κ2, ΔRappκ2, estimated (Supplementary Note 8). A maximum allowed distance uncertainty of ≤10% (shaded gray region) in ΔRappκ2 leads to a dye-independent threshold of 0.25 for 〈rc,∞〉. f, The apparent dynamic shift 〈ds〉 versus the combined residual anisotropy 〈rc,∞〉 is shown for all measured dye pairs (top left) and individually. Error bars of the apparent ds represent the standard deviation over n = 3 laboratories. For the combined residual anisotropy, the propagated 1σ uncertainty (Supplementary Note 8). g, The structural flexibility of MalE estimated after filtering using the distance uncertainty threshold shown in e (Supplementary Note 12). Error bars represent the 1σ percentiles averaged over all dye pairs (n = 1, MalE-1; n = 7, MalE-2 and MalE-3; n = 4, MalE-4 and n = 5, MalE-5). The residual distance fluctuations obtained from control measurements on dsDNA in one laboratory (dsdsDNA = 0.0026 ± 0.0044) are shown as a black line (gray areas represent confidence intervals of 1σ, 2σ and 3σ). Source data
Fig. 6
Fig. 6. Structural characterization of U2AF2.
a, Structural flexibility of U2AF2 is given by translational (left) and rotational (right) movement of the two domains. Representative structures are taken from the ensemble determined using NMR and SAXS measurements. b, Degeneracy of structural states in FRET measurements. The position of the two domains of U2AF2 is illustrated by the COM of the Cα atoms in RRM2 (residues 260–329, colored) with respect to RRM1 (residues 150–227, black) for the 200 structures of the conformational ensemble. The COM of RRM2 is color-coded according to the FRET efficiency determined using AV3 calculations. c, A schematic of the kinetic model used for the global dynamic PDA of U2AF2 (Supplementary Note 17). d, Distance distributions obtained from a donor fluorescence decay analysis by a model-free MEM approach (Supplementary Note 15). The distance distribution from the NMR–SAXS ensemble (light blue) was used as the prior distribution. The expected interdye distances for the compact apo and open holo states are shown as red and blue dashed lines (PDB 2YH0 and 2YH1). Shaded areas indicate the distance broadening due to the flexible dye linkers of 6 Å. The distribution in the donor–acceptor distance RDA for different dye pairs is shown. e, Filtered-FCS reveals conformational dynamics in the U2AF2 apo ensemble on two timescales, tR,1 = 9 ± 3 and tR,2 = 300 ± 90 µs, average and standard deviation (n = 3, results from laboratory 1 are shown). The two species were defined at the lower and upper edge of the FRET efficiency histogram shown in Fig. 2b, top panel (see Methods and Supplementary Note 16 for details). The species autocorrelation functions (SACFs) and one of the two species cross-correlation functions (SCCFs) are shown. The weighted residuals are shown above. f, The PDA analysis was conducted globally over both apo (top) and holo (bottom) measurements using time windows of 0.5, 1.0, 1.5 and 2.0 ms (the 1.0 ms time window histograms are shown). A relaxation time of roughly 10 ms for the dynamics between the detached ensemble and compact apo state with a small amplitude was determined (orange curve) (Supplementary Fig. 16 and Supplementary Note 17). Source data

References

    1. Lerner E, et al. FRET-based dynamic structural biology: challenges, perspectives and an appeal for open-science practices. eLife. 2021;10:e60416. - PMC - PubMed
    1. Lerner E, et al. Toward dynamic structural biology: two decades of single-molecule Förster resonance energy transfer. Science. 2018;359:eaan1133. - PMC - PubMed
    1. Algar WR, Hildebrandt N, Vogel SS, Medintz IL. FRET as a biomolecular research tool—understanding its potential while avoiding pitfalls. Nat. Methods. 2019;16:815–829. - PubMed
    1. Hildebrandt, N. in FRET—Förster Resonance Energy Transfer (eds Medintz, I. & Hildebrandt, N.) 105–163 (Wiley, 2013).
    1. Muschielok A, et al. A nano-positioning system for macromolecular structural analysis. Nat. Methods. 2008;5:965–971. - PubMed

Publication types

MeSH terms