. 2023 Mar 27;21(1):223.
doi: 10.1186/s12967-023-04056-z.

Comprehensive analysis of scRNA-Seq and bulk RNA-Seq reveals dynamic changes in the tumor immune microenvironment of bladder cancer and establishes a prognostic model

Affiliations

Comprehensive analysis of scRNA-Seq and bulk RNA-Seq reveals dynamic changes in the tumor immune microenvironment of bladder cancer and establishes a prognostic model

Zhiyong Tan et al. J Transl Med. .

Abstract

Background: The prognostic management of bladder cancer (BLCA) remains a great challenge for clinicians. Recently, bulk RNA-seq sequencing data have been used as a prognostic marker for many cancers but do not accurately detect core cellular and molecular functions in tumor cells. In the current study, bulk RNA-seq and single-cell RNA sequencing (scRNA-seq) data were combined to construct a prognostic model of BLCA.

Methods: BLCA scRNA-seq data were downloaded from Gene Expression Omnibus (GEO) database. Bulk RNA-seq data were obtained from the UCSC Xena. The R package "Seurat" was used for scRNA-seq data processing, and the uniform manifold approximation and projection (UMAP) were utilized for downscaling and cluster identification. The FindAllMarkers function was used to identify marker genes for each cluster. The limma package was used to obtain differentially expressed genes (DEGs) affecting overall survival (OS) in BLCA patients. Weighted gene correlation network analysis (WGCNA) was used to identify BLCA key modules. The intersection of marker genes of core cells and genes of BLCA key modules and DEGs was used to construct a prognostic model by univariate Cox and Least Absolute Shrinkage and Selection Operator (LASSO) analyses. Differences in clinicopathological characteristics, immune microenvironment, immune checkpoints, and chemotherapeutic drug sensitivity between the high and low-risk groups were also investigated.

Results: scRNA-seq data were analyzed to identify 19 cell subpopulations and 7 core cell types. The ssGSEA showed that all 7 core cell types were significantly downregulated in tumor samples of BLCA. We identified 474 marker genes from the scRNA-seq dataset, 1556 DEGs from the Bulk RNA-seq dataset, and 2334 genes associated with a key module identified by WGCNA. After performing intersection, univariate Cox, and LASSO analysis, we obtained a prognostic model based on the expression levels of 3 signature genes, namely MAP1B, PCOLCE2, and ELN. The feasibility of the model was validated by an internal training set and two external validation sets. Moreover, patients with high-risk scores are predisposed to experience poor OS, a larger prevalence of stage III-IV, a greater TMB, a higher infiltration of immune cells, and a lesser likelihood of responding favorably to immunotherapy.

Conclusion: By integrating scRNA-seq and bulk RNA-seq data, we constructed a novel prognostic model to predict the survival of BLCA patients. The risk score is a promising independent prognostic factor that is closely correlated with the immune microenvironment and clinicopathological characteristics.

Keywords: Bladder cancer; Bulk RNA-seq; Immune landscape; Prognosis; scRNA-seq.


Conflict of interest statement

The authors declare that they have no competing interests.

Figures

Fig. 1
Fig. 1
Identification of 7 cell clusters with diverse annotations revealing high cellular heterogeneity in BLCA tumors based on single-cell RNA-seq data. A After quality control of scRNA-seq, 13,490 core cells were identified. B The variance diagram shows the variation of gene expression in all cells of BLCA. The red dots represent highly variable genes and the black dots represent non-variable genes. C PCA showed a clear separation of cells in BLCA. D PCA identified the top 20 PCs at P < 0.05. E The umap algorithm was applied to the top 20 PCs for dimensionality reduction, and 19 cell clusters were successfully classified. F Classification of cell clusters in each sample. G All 7 cell clusters in BLCA were annotated with singleR and CellMarker according to the composition of marker genes. H Expression levels of marker genes for each cell cluster
Fig. 2
Fig. 2
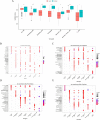
Functional enrichment analysis of marker genes based on 7 key cells. A Differentially expressed cells in BLCA and control samples were obtained by calculating the ssGSEA score of each cluster based on the marker genes. BE Based on the marker genes of differentially expressed cells, ClusterProfiler package for GO and KEGG functional enrichment
Fig. 3
Fig. 3
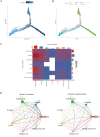
Trajectory and cell–cell communication analysis of three BLCA cell subsets with distinct differentiation patterns. A, B Trajectory analysis revealed three subsets of BLCA cells with distinct differentiation patterns. One of them differentiates into a branch dominated by Endothelial cells, and the other branch is dominated by smooth muscle cells, Fibroblasts cells. C Heatmap visualizes the number of potential ligand-receptor pairs in key cells. D Number and strength of interactions between key cells
Fig. 4
Fig. 4
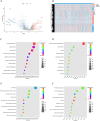
Identification and functional enrichment analysis of DEGs between BLCA patients and controls. A Volcano plot of DEGs between BLCA and control in TCGA. P < 0.05 and |log2FoldChange|> 1 were identified as significant DEGs. The red dots represent upregulated genes and the blue dots represent downregulated genes. B Heatmap of DEGs. C–F Bubble plots of the BP, CC, MF, and KEGG pathways of DEGs
Fig. 5
Fig. 5
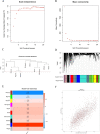
BLCA-related genes were screened by WGCNA. A, B Analysis of the scale-free index for various soft-threshold powers (β). C The minimum number of genes per module is 300, and 10 modules are obtained when MEDissThres is equal to 0.2. D Cluster dendrogram of the co-expression network modules (1-TOM). E Analysis of correlations between the modules and BLCA, p.values are shown. F Scatter plot analysis of the brown module
Fig. 6
Fig. 6
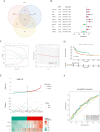
Construction of risk signature in the TCGA cohort. A Intersection of BLCA-related genes, DEGs in key cells, and DEGs in BLCA and controls. B Univariate cox regression analysis of OS. C LASSO regression of OS-related genes. D Kaplan–Meier curve result. E Risk survival status plot. F The AUC of the prediction of 1, 3, and 5-year survival rates of BLCA
Fig. 7
Fig. 7
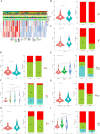
Correlation analysis of risk scores with clinical characteristics. A Heatmap of risk model and clinical characteristics. BI Relationship between age, sex, M stage, N stage, T stage, TMB, tumor stage, and survival status with the analysis model
Fig. 8
Fig. 8
The nomogram model was constructed based on Univariate and multivariate cox regression analyses. A Univariate Cox analysis of risk scores and clinical characteristics. B Multifactorial Cox analysis. C Construction of the nomogram model. D The calibration curve of the nomogram
Fig. 9
Fig. 9
Biological characteristics between high-and low-risk groups. A, B GSEA analysis of GO and KEGG between high- and low-risk groups. C, D GSVA analysis of all genes in the high- and low-risk groups to obtain enriched pathways
Fig. 10
Fig. 10
Analysis of the tumor immune microenvironment in high- and low-risk groups. A Violin plot visualizing the ssGSEA scores of 28 immune cells between high and low-risk groups. B Correlation analysis of risk scores with significantly different immune cells. C Box plot visualizing the expression levels of 18 inflammation-related genes between high and low-risk groups. D Pathway network map of significantly differentially expressed inflammation-related genes. E PPI network of significantly differentially expressed inflammation-related genes. F Expression analysis of PD-1, PD-L1, CTLA-4, and TIGIT between high and low-risk groups. G Assessment of ICB response in high and low-risk groups
Fig. 11
Fig. 11
Mutation landscape analysis in BLCA. A Overall description of the TCGA-BLCA patient mutation landscape. B The tumor mutational burden (TMB) in the high and low‐risk groups was predicted by the risk model
Fig. 12
Fig. 12
Screening of therapeutic agents for BLCA based on risk models. A For the GDSC database, Spearman correlation analysis was performed on BLCA and estimated IC50 values. With a filtering |R| greater than 0.4 and p-value less than 0.05, 12 candidate compounds were identified. B Sensitivity analysis of key drugs in high- and low-risk groups. C AUC values of CTRP compounds were estimated for each BLCA patient and Spearman analysis was performed on BLCA and AUC values. Dotted line plots visualize the 5 compounds with the highest negative correlation coefficients. D The AUC values estimated by the compounds were significantly lower in the high-risk group of BLCA

References

    1. Sung H, Ferlay J, Siegel RL, Laversanne M, Soerjomataram I, Jemal A, et al. Global Cancer Statistics 2020: GLOBOCAN estimates of incidence and mortality worldwide for 36 cancers in 185 countries. CA Cancer J Clin. 2021;71:209–249. doi: 10.3322/caac.21660. - DOI - PubMed
    1. de Jong JJ, Liu Y, Robertson AG, Seiler R, Groeneveld CS, van der Heijden MS, et al. Long non-coding RNAs identify a subset of luminal muscle-invasive bladder cancer patients with favorable prognosis. Genome Med. 2019;11:60. doi: 10.1186/s13073-019-0669-z. - DOI - PMC - PubMed
    1. Babjuk M, Burger M, Capoun O, Cohen D, Compérat EM, Dominguez Escrig JL, et al. European association of urology guidelines on non-muscle-invasive bladder cancer (Ta, T1, and Carcinoma in Situ) Eur Urol. 2022;81:75–94. doi: 10.1016/j.eururo.2021.08.010. - DOI - PubMed
    1. Gakis G, Black PC, Bochner BH, Boorjian SA, Stenzl A, Thalmann GN, et al. Systematic review on the fate of the remnant urothelium after radical cystectomy. Eur Urol. 2017;71:545–557. doi: 10.1016/j.eururo.2016.09.035. - DOI - PMC - PubMed
    1. Witjes JA, Bruins HM, Cathomas R, Compérat EM, Cowan NC, Gakis G, et al. European Association of Urology Guidelines on muscle-invasive and metastatic bladder cancer: summary of the 2020 guidelines. Eur Urol. 2021;79:82–104. doi: 10.1016/j.eururo.2020.03.055. - DOI - PubMed

Publication types