

Historical connectivity and environmental filtering jointly determine the freshwater fish assemblages on Taiwan and Hainan Islands of China
- PMID: 36974143
- PMCID: PMC10039183
- DOI: 10.1093/cz/zoac015
Historical connectivity and environmental filtering jointly determine the freshwater fish assemblages on Taiwan and Hainan Islands of China
Abstract
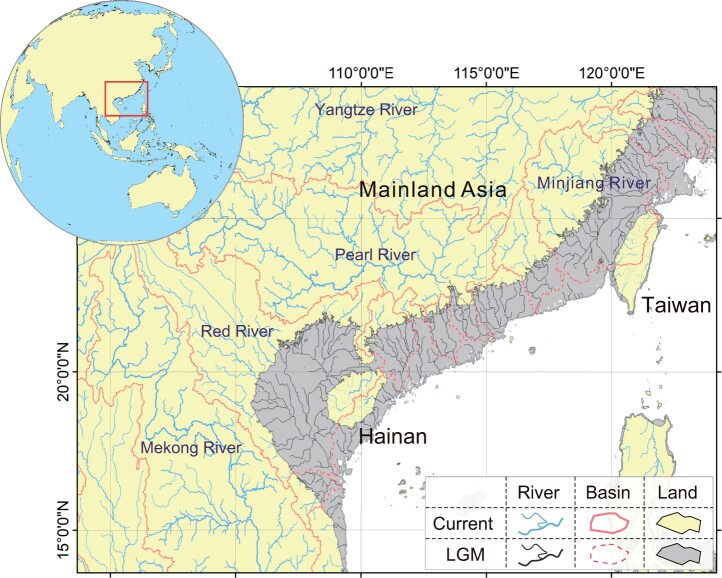
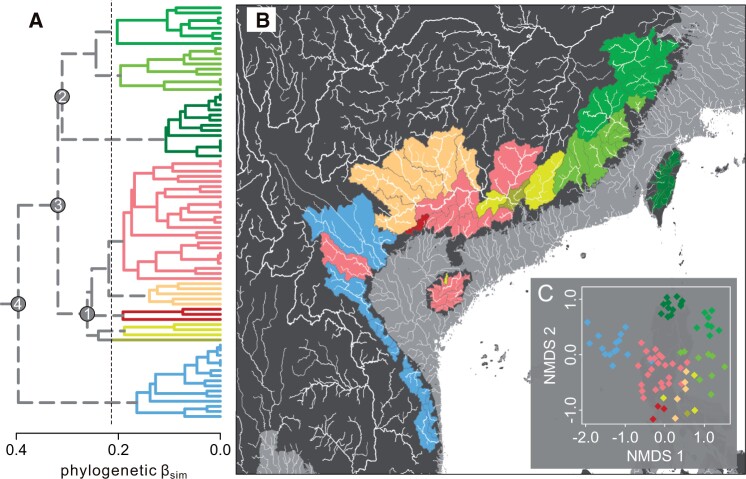
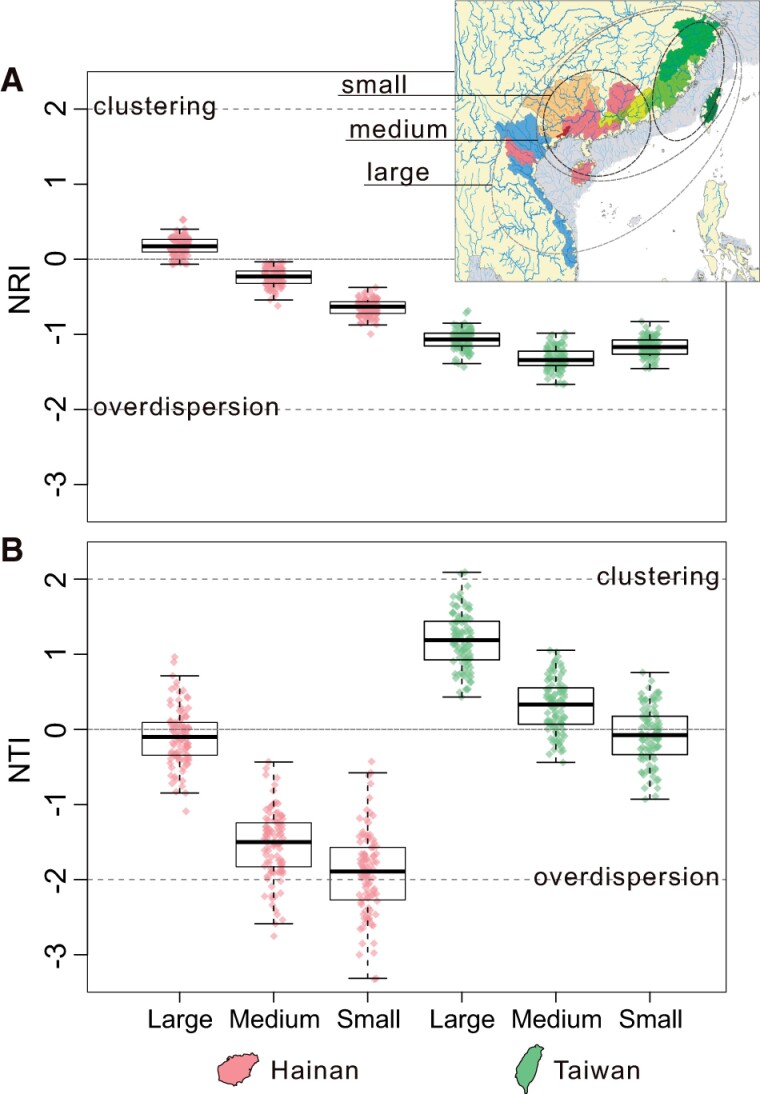
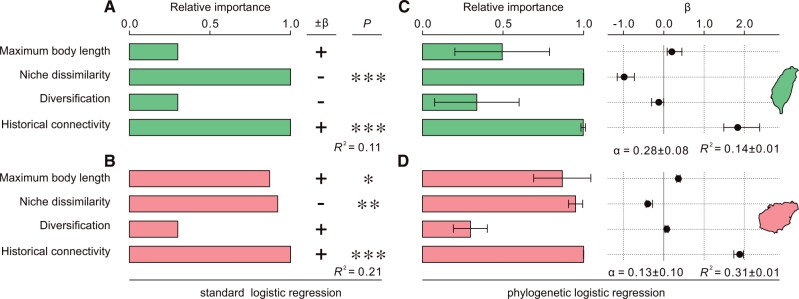
The biotas of Taiwan and Hainan Islands are of continental origin, but the manner with which historical and ecological factors shaped these insular species is still unclear. Here, we used freshwater fish as a model to fill this gap by quantifying the phylogenetic structure of the insular faunas and disentangling the relative contribution of potential drivers. Firstly, we used clustering and ordination analyses to identify regional species pools. To test whether the insular freshwater fish faunas were phylogenetically clustered or overdispersed, we calculated the net relatedness index (NRI) and the nearest taxon index (NTI). Finally, we implemented logistic regressions to disentangle the relative importance of species attributes (i.e., maximum body length, climatic niche dissimilarity [ND], and diversification) and historical connectivity (HC) in explaining the insular faunas. Our results showed that the most possible species pools of Taiwan are Zhejiang and Fujian provinces, and those of Hainan are Guangdong and Guangxi provinces. These insular faunas showed random phylogenetic structures in terms of NRI values. According to the NTI values, however, the Taiwanese fauna displayed more phylogenetic clustering, while the Hainanese one was more overdispersed. Both the standard and phylogenetic logistic regressions identified HC and climatic ND as the 2 top explanatory variables for species assemblages on these islands. Our reconstruction of the paleo-connected drainage basins provides insight into how historical processes and ecological factors interact to shape the freshwater fish fauna of the East Asian islands.
Keywords: biogeography; community assemblage; paleo-drainage; sea level change.
© The Author(s) 2022. Published by Oxford University Press on behalf of Editorial Office, Current Zoology.
Conflict of interest statement
The authors declare that they have no competing interests.
Figures
References
-
- Ali JR, 2017. Islands as biological substrates: Classification of the biological assemblage components and the physical island types. J Biogeogr 44:984–994.
-
- Ali JR, 2018. New explanation for elements of Hainan Island’s biological assemblage may stretch things a little too far. Ecography 41:457–460.
-
- Bartoń K, 2019. MUMIn: multi-model inference. R package version 1.43.15. Available from: https://CRAN.R-project.org/package=MuMIn
-
- Baselga A, Orme CDL, 2012. Betapart: An r package for the study of beta diversity. Methods Ecol Evol 3:808–812.
-
- Bellard C, Leclerc C, Courchamp F, 2014. Impact of sea level rise on the 10 insular biodiversity hotspots. Glob Ecol Biogeogr 23:203–212.
LinkOut - more resources
Full Text Sources
Miscellaneous