. 2023 Apr 4;12(7):e027986.
doi: 10.1161/JAHA.122.027986. Epub 2023 Mar 28.

Pentose Pathway Activation Is Superior to Increased Glycolysis for Therapeutic Angiogenesis in Peripheral Arterial Disease

Affiliations

Pentose Pathway Activation Is Superior to Increased Glycolysis for Therapeutic Angiogenesis in Peripheral Arterial Disease

Abdelrahman A Zaied et al. J Am Heart Assoc. .

Erratum in

Abstract

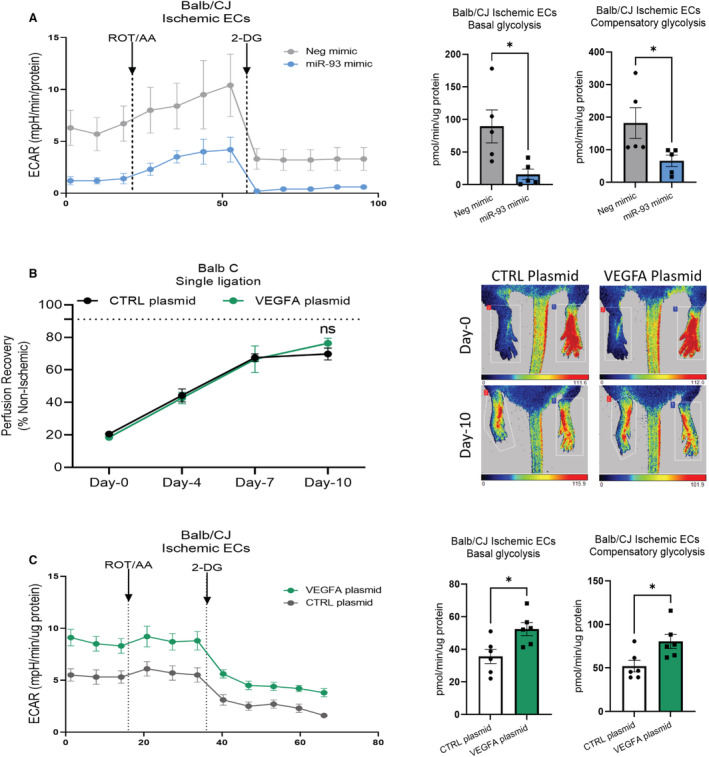
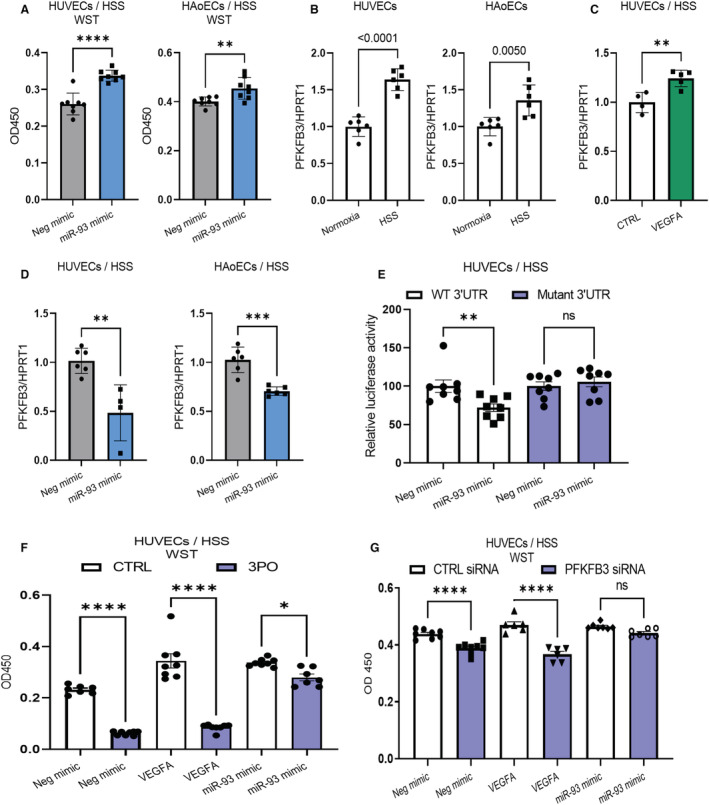
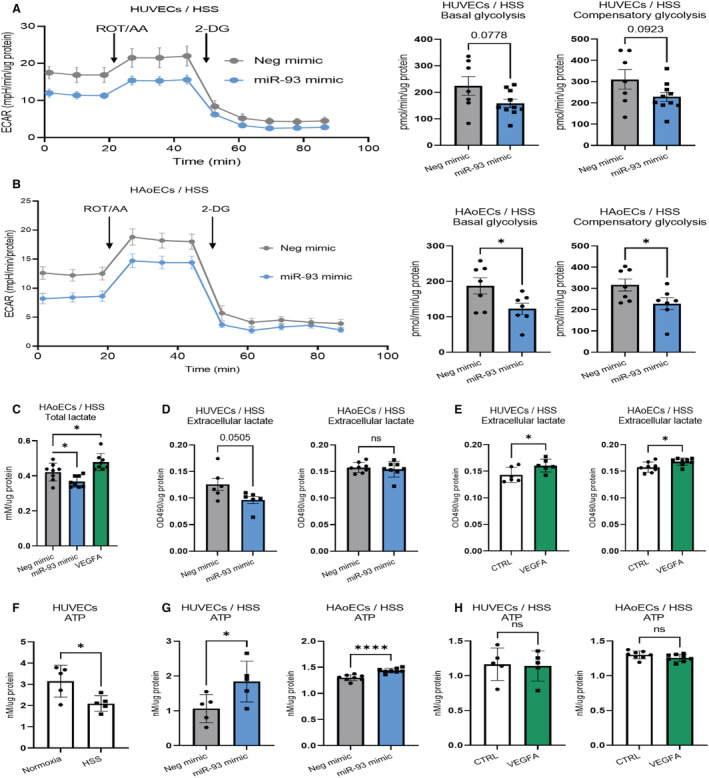
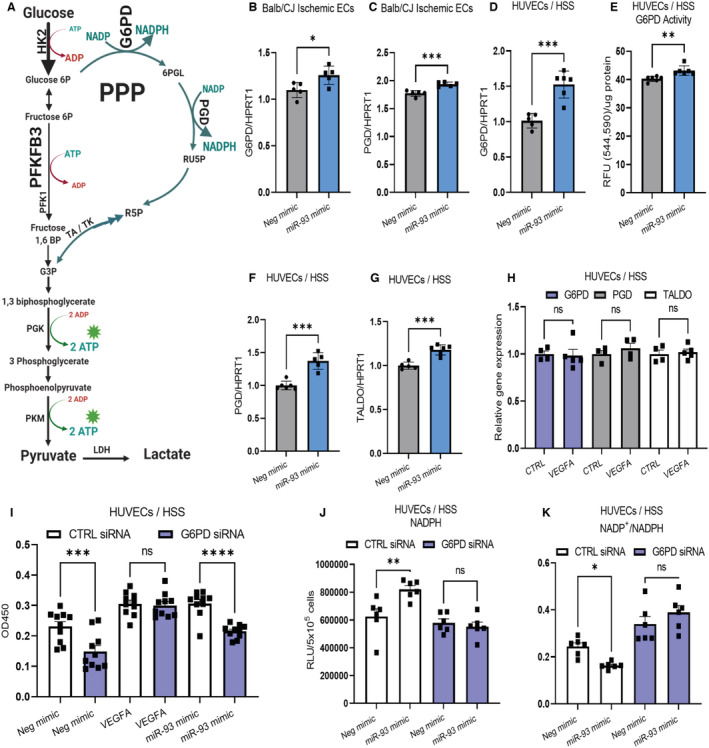
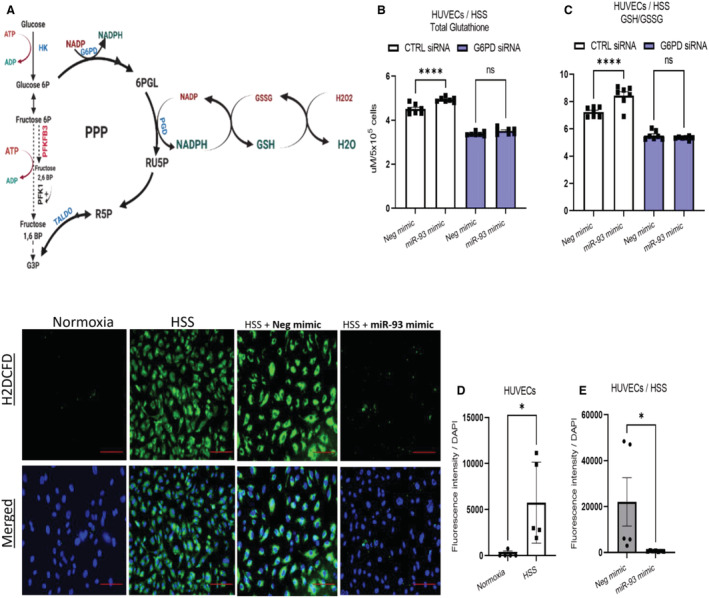
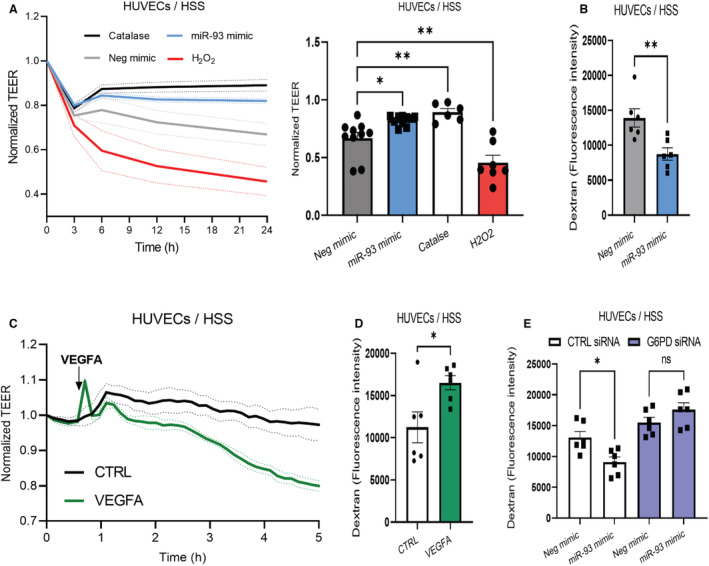
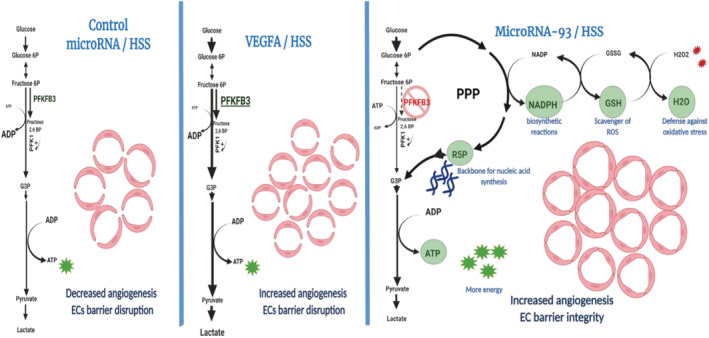
Background In endothelial cells (ECs), glycolysis, regulated by PFKFB3 (6-phosphofructo-2-kinase/fructose-2,6-biphosphatase, isoform-3), is the major metabolic pathway for ATP generation. In preclinical peripheral artery disease models, VEGF165a (vascular endothelial growth factor165a) and microRNA-93 both promote angiogenesis. Methods and Results Mice following hind-limb ischemia (HLI) and ECs with, and without, hypoxia and serum starvation were examined with, and without, microRNA-93 and VEGF165a. Post-HLI perfusion recovery was monitored. EC metabolism was studied using seahorse assay, and the expression and activity of major metabolism genes were assessed. Reactive oxygen species levels and EC permeability were evaluated. C57Bl/6J mice generated a robust angiogenic response to HLI, with ECs from ischemic versus nonischemic muscle demonstrating no increase in glycolysis. Balb/CJ mice generated a poor angiogenic response post-HLI; ischemic versus nonischemic ECs demonstrated significant increase in glycolysis. MicroRNA-93-treated Balb/CJ mice post-HLI showed better perfusion recovery, with ischemic versus nonischemic ECs showing no increase in glycolysis. VEGF165a-treated Balb/CJ mice post-HLI showed no improvement in perfusion recovery with ischemic versus nonischemic ECs showing significant increase in glycolysis. ECs under hypoxia and serum starvation upregulated PFKFB3. In ECs under hypoxia and serum starvation, VEGF165a versus control significantly upregulated PFKFB3 and glycolysis, whereas miR-93 versus control demonstrated no increase in PFKFB3 or glycolysis. MicroRNA-93 versus VEGF165a upregulated glucose-6-phosphate dehydrogenase expression and activity, activating the pentose phosphate pathway. MicroRNA-93 versus control increased reduced nicotinamide adenine dinucleotide phosphate and virtually eliminated the increase in reactive oxygen species. In ECs under hypoxia and serum starvation, VEGF165a significantly increased and miR-93 decreased EC permeability. Conclusions In peripheral artery disease, activation of the pentose phosphate pathway to promote angiogenesis may offer potential therapeutic advantages.

Keywords: VEGFA; endothelial metabolism; glycolysis; hypoxia dependent angiogenesis; microRNA‐93; pentose phosphate pathway; vascular permeability.


Figures

Figure 1
Figure 1. Effect of miR‐93 versus VEGFA on glycolysis in ECs from Balb/CJ mice post‐HLI.
A, In Balb/CJ mice ECs, seahorse glycolytic rate shows significant decrease in basal and compensatory glycolysis in ECs from ischemic limbs in mice treated with miR‐93 vs negative mimic (basal: 15.9±7.9 vs 89.4±25.3, P<0.05; compensatory: 66.4±17.4 vs 182.2±46.9 pmol/min per μg protein, P<0.05, n=5). B, Laser speckle perfusion imaging of Balb/CJ mice shows comparable perfusion recovery (% of nonischemic) in VEGFA vs control (CTRL) plasmid‐treated mice at day 0, 4, 7, and 10 post HLI (% ischemic: nonischemic limb at day 10: 76.4±3.1 vs 69.8±3.6, VEGFA vs CTRL, P=ns, n=10). C, In Balb/CJ mouse ECs, seahorse glycolytic rate shows significant increase in basal and compensatory glycolysis in ECs from ischemic limbs in mice treated with VEGFA vs CTRL plasmid (basal: 52.4±4.0 vs 35.6±4.3, P<0.05; compensatory: 80.5±8.1 vs 52.3±6.6 pmol/min per μg protein, P<0.05, n=6). Data represent mean±SEM for all experiments. Statistical analysis for (A and C) was done using unpaired t test, and analysis for (B) was done using repeated‐measures ANOVA. ns P>0.05, *P<0.05. 2‐DG indicates 2‐deoxy‐D‐glucose; EC, endothelial cell; ECAR, extracellular acidification rate; ROT/AA, rotenone antimycin‐A; and VEGFA, vascular endothelial growth factor A.
Figure 2
Figure 2. MicroRNA‐93 promotes hypoxia‐dependent angiogenesis by blocking PFKFB3 upregulation.
A, In HUVECS and HAoECs, the WST assay shows that overexpression of miR‐93 increased cell viability (HUVECs: OD 450: 0.33±0.01 vs 0.26±0.01, P<0.001, n=8; HAoECs: 0.45±0.01 vs 0.40±0.01, P<0.01, n=8). B, In HUVECS and HAoECs, qPCR shows that HSS increases PFKFB3 relative expression (HUVECs: 1.6±0.1 vs 1.0±0.1, P<0.0001, n=6; HAoECs: 1.35±0.1 vs 1.0±0.1, P<0.01, n=6). C, In HUVECs under HSS, qPCR shows that VEGF165a treatment further increased PFKFB3 expression (1.24±0.03 vs 1.00±0.05, P<0.01, n=5). D, In HUVECs and HAoECs under HSS, qPCR shows that miR‐93 overexpression decreases PFKFB3 gene expression (HUVECs: 0.64±0.04 vs 1.00±0.05, P<0.001, n=4–6; HAoECs: 0.70±0.01 vs 1.00±0.05, P<0.001, n=6). E, Dual luciferase assay in HUVECs under HSS shows that miR‐93 decreases luciferase signal by 28% in the WT 3'UTR group, with no significant change between miR‐93 and control in the mutant 3'UTR group n=8. F, WST assay shows that 3PO decreases HUVEC viability in the negative mimic (73%) and VEGF165a group (75%) compared with minimal effect (15%) on miR‐93‐treated cells (n=7–8). G, WST assay shows that PFKFB3 knockdown decreases HUVEC viability in negative mimic (OD450: 0.38±0.01 vs 0.43±0.01, P<0.0001, n=8) and VEGF165a groups (0.36±0.01 vs 0.47±0.01, P<0.0001, n=6), whereas no significant difference was observed between PFKFB3 and control (CTRL) siRNA in miR‐93‐treated cells (0.46±0.01 vs 0.44±0.01, P=ns, n=7). Data represent mean±SEM for all experiments. Statistical analysis for (A, B, C, and D) was done using unpaired t test, and analysis for (E, F, and G) was done using 1‐way ANOVA. ns P>0.05, *P<0.05, **P<0.01, ***P<0.001, ****P<0.0001. 2‐DG indicates 2‐deoxy‐D‐glucose; 3PO, 3‐(3‐pyridinyl)‐1‐(4‐pyridinyl)‐2‐propen‐1‐one; 3'UTR, three prime untranslated region; HAoECs, human aortic endothelial cells; HPRT1, hypoxanthine phosphoribosyltransferase 1; HSS, hypoxia and serum starvation; HUVECs, human umbilical vein endothelial cells; OD, optical density; PFKFB3, 6‐phosphofructo‐2‐kinase/fructose‐2,6‐biphosphatase; qPCR, quantitative polymerase chain reaction; ROT/AA, rotenone antimycin‐A; VEGF, vascular endothelial growth factor; WST, water‐soluble tetrazolium; and WT, wild type.
Figure 3
Figure 3. MiR‐93 does not require induction of glycolysis to promote hypoxia‐dependent angiogenesis in vitro.
A, In HUVECs under HSS, seahorse glycolytic rate shows decreased extracellular acidification rate (ECAR) and basal and compensatory glycolysis with miR‐93 treatment (basal: 158.2±15.2 vs 223.7±35.5, P=0.07; compensatory: 227.9±21.3 vs 310.4±46.1 pmol/min per μg protein, P=0.09, n=7–10). B, In HAoECs under HSS, seahorse glycolytic rate shows that miR‐93 decreased ECAR and basal and compensatory glycolysis vs control (basal: 122.4±15.7 vs 187.3±22.8, compensatory 228.3±27.9 vs 316.3±28.0 pmol/min per μg protein, P<0.05, n=7). C, L‐lactate assay shows that VEGF165a increases and miR‐93 decreases combined intracellular and extracellular lactate concentration in HUVECs under HSS compared with control treatment (0.48±0.02 vs 0.36±0.01 vs 0.42±0.02 mmol/L per μg protein, P<0.05, n=8). D, L‐lactate assay shows no significant difference in extracellular lactate between miR‐93 and control in HUVECs or HAoECs under HSS (HUVECs: 0.10±0.01 vs 0.13±0.01 OD490/μg protein, P=0.05, n=6; HAoECs 0.15±0.01 vs 0.16±0.01 OD490/μg protein, P=ns, n=6). E. L‐lactate assay showed increased lactate concentration with VEGF165a treatment in HUVECs and HAoECs under HSS (HUVECs: 0.161±0.004 vs 0.143±0.005, P<0.05, n=6; and HAoECs: 0.168±0.002 vs 0.157±0.003, P<0.05, n=8). F, In HUVECS, quantitative bioluminescence assay for ATP using a recombinant firefly luciferase shows that 24 hours of HSS decreases ATP (2.1±0.1 vs 3.1±0.3 nmol/L per μg protein, P<0.05, n=5). G. In HUVECs and HAoECs under HSS, ATP assay shows increase in the amount of ATP with miR‐93 (HUVECs: 1.8±0.2 vs 0.9±0.2, P<0.05, n=5; HAoECs: 1.43±0.01 vs 1.30±0.01 nmol/L per μg protein, P<0.0001, n=8). H, In HUVECS/HAoECs under HSS, no difference in ATP with VEGF165a treatment (HUVECs: 1.11±0.09 vs 1.16±0.10, P=ns, n=5; HAoECs: 1.25±0.01 vs 1.30±0.01 nmol/L per μg protein, P=ns, n=8). Data represent mean±SEM for all experiments. Statistical analysis for (A, B, C, D, F, G, and H) was done using unpaired t test, and analysis for (E) was done using 1‐way ANOVA. ns P>0.05, *P<0.05, **P<0.01, ****P<0.0001, ****P<0.0001. 2‐DG indicates 2‐deoxy‐D‐glucose; HAoECs, human aortic endothelial cells; HSS, hypoxia and serum starvation; HUVECs, human umbilical vein endothelial cells; OD, optical density; ROT/AA, rotenone antimycin‐A; and VEGF, vascular endothelial growth factor.
Figure 4
Figure 4. In HDA, mir‐93 promotes activity of the pentose phosphate pathway.
A, Schematic shows glycolysis and pentose phosphate pathway. B and C, In ECs isolated from ischemic Balb/CJ hindlimb skeletal muscles, qPCR shows miR‐93 treatment increased gene expression of G6PD (1.25±0.04 vs 1.01±0.03, P<0.05, n=5) and PGD (1.93±0.01 vs 1.77±0.02, P<0.001, n=5). D, In HUVECs under HSS, qPCR shows miR‐93 increased G6PD gene expression (1.52±0.07 vs 1.00±0.04, P<0.001, n=5–6). E. In HUVECs under HSS, G6PD activity assay shows miR‐93 increased G6PD activity (43.1±0.6 vs 40.2±0.3 RFU/μg protein, P<0.01, n=4). F and G. qPCR shows miR‐93 increased gene expression of PGD (1.37±0.05 vs 1.00±0.02) and TALDO1 (1.18±0.02 vs 1.00±0.01) in HUVECs under HSS (P<0.001, n=5–6). H, qPCR shows no change in gene expression of G6PD, PGD, and TALDO1 with VEGF165a treatment in HUVECs under HSS, n=4–5. I, WST viability assay in HUVECs under HSS shows that G6PD siRNA decreased HUVEC viability in the negative mimic (OD450: 0.15±0.02 vs 0.23±0.02, P<0.001, n=10) and miR‐93 (OD450: 0.21±0.01vs 0.31±0.01, P<0.001, n=10) groups with no significant decrease in the VEGF165a group (OD450:0.30±0.01 vs 0.31±0.01, P=ns, n=10). J, NADPH assay shows increased levels of NADPH in miR‐93‐treated HUVECs under HSS (≈1.3 fold P<0.01, n=6). In G6PD knockdown, there was no difference between miR‐93 and negative mimic, n=6. K, Ratio of NADP/ NADPH shows that miR‐93 overexpression decreased ratio of NADP to NADPH in HUVECs under HSS by ≈34% (P<0.05, n=6). In G6PD knockdown, there was no difference between miR‐93 and negative mimic, n=6. Data represent mean±SEM for all experiments. Statistical analysis for (B, C, D, E, F, G, and H) was done using unpaired t test, and analysis for (I, J, and K) was done using 1‐way ANOVA. ns P>0.05, *P<0.05, **P<0.01, ***P<0.001. 6PGL indicates 6‐phosphogluconolactonase; CRTL, control; EC, endothelial cell; G6PD, glucose 6‐phosphate dehydrogenase; HSS, hypoxia and serum starvation; HUVECs, human umbilical vein endothelial cells; NADP, nicotinamide adenine dinucleotide phosphate; NADPH, reduced nicotinamide adenine dinucleotide phosphate; OD, optical density; PFKFB3, 6‐phosphofructo‐2‐kinase/fructose‐2,6‐biphosphatase; PGD, phosphogluconate dehydrogenase; qPCR, quantitative polymerase chain reaction; RSP, ribulose S‐phosphate; RUSP, ribulose 5‐phosphate; TALDO1, transaldolase 1; VEGF, vascular endothelial growth factor; WST, water‐soluble tetrazolium. Schematic in panel A was created with BioRender.com.
Figure 5
Figure 5. MiR‐93 activates NADPH/glutathione axis and decreases reactive oxygen species.
A, Schematic shows how the activation of PPP and more NADPH production lead to increased reduced glutathione and improve defense against oxidative stress. B, In HUVECs under HSS, total glutathione assay shows increased levels of total glutathione with miR‐93 treatment (4.93±0.04 vs 4.50±0.08 μmol/L per μg protein, P<0.0001, n=7). With G6PD knockdown, there is no difference between miR‐93 and negative mimic, n=6. C, In HUVECs under HSS, glutathione/glutathione disulfide assay shows higher ratio of reduced to oxidized glutathione with miR‐93 treatment (8.4±0.2 vs 7.2±0.1, P<0.0001, n=7). With G6PD knockdown, there is no difference between miR‐93 and negative mimic, n=7. D, CM‐H2DCFDA assay shows higher ROS levels when challenging HUVECs with HSS (5738±1968 vs 152±150 RFU/DAPI, P<0.05 n=3). Scale bar=100 μm. E, In HUVECs under HSS, CM‐H2DCFDA assay shows that overexpression of miR‐93 leads to dramatic decrease in ROS generation (576±94 vs 22 051±10 510 RFU/DAPI, P<0.05, n=3). Scale bar=100 μm. Data represent mean±SEM for all experiments. Statistical analysis for (B) and (C) was done using 1‐way ANOVA, and analysis for (D) and (E) was done using unpaired t test. *P<0.05, ****P<0.0001. 6PGL indicates 6‐phosphogluconolactonase; G6PD, glucose 6‐phosphate dehydrogenase; GSH, glutathione; GSSG, glutathione disulfide; H2DCFDA, 2′,7′‐dichlorodihydrofluorescein diacetate; HSS, hypoxia and serum starvation; HUVECs, human umbilical vein endothelial cells; NADP, nicotinamide adenine dinucleotide phosphate; NADPH, reduced nicotinamide adenine dinucleotide phosphate; PPP, pentose phosphate pathway; RSP, ribulose S‐phosphate; ROS, reactive oxygen species; and RUSP, ribulose 5‐phosphate. Schematic in panel A was created with BioRender.com.
Figure 6
Figure 6. In HDA, miR‐93 does not result in loss of barrier integrity or increased EC permeability.
A, In HUVECs under HSS, TEER was measured at 3, 6, 12, and 24 hours after challenging with HSS; miR‐93 increases the resistance of HUVECs monolayer vs negative mimic. Data indicate mean±SEM of the resistance values at 24 hours of HSS (miR‐93 vs negative mimic: 0.82±0.01 vs 0.66±0.04 normalized TEER, P<0.05, n=10). Values are normalized to resistance values before transfection of microRNA. B, Dextran permeability in HUVECs under HSS shows that miR‐93 decreases EC monolayer permeability to dextran (8744±885 vs 13 911±1311 fluorescence intensity, P<0.01, n=6). C, In HUVECs under HSS, TEER shows that VEGF165a decreases the resistance of HUVEC monolayer vs control. Data indicate mean±SEM of the resistance values at 24 hours of HSS (VEGFA vs CTRL: 0.89±0.01 vs 0.99±0.01 normalized TEER, P<0.05, n=4). Values are normalized to resistance values before challenging with HSS. D, Dextran permeability in HUVECs under HSS shows that VEGF165a increases EC monolayer permeability to dextran (16 512±843 vs 11 235±1819 fluorescence intensity, P<0.05, n=6). E, Dextran permeability in HUVECs under HSS shows that G6PD knockdown blocked miR‐93 effect on EC monolayer permeability (17 595±1132 vs 15 501±859 florescence intensity, P=ns, n=6). Data represent mean±SEM for all experiments. Statistical analysis for (A) and (E) was done using 1‐way ANOVA, and analysis for (B) and (D) was done using unpaired t test. *P<0.05, **P<0.01. G6PD indicates glucose 6‐phosphate dehydrogenase; CTRL, control; EC, endothelial cell; HDA, hypoxia‐dependent angiogenesis; HSS, hypoxia and serum starvation; HUVECs, human umbilical vein endothelial cells; TEER, transendothelial electrical resistance; and VEGF, vascular endothelial growth factor.
Figure 7
Figure 7. Schematic shows the metabolic pathways used by ECs under basal HSS conditions versus VEGF165a (VEGFA) treatment versus miR‐93 treatment.
EC indicates endothelial cell; GSH, glutathione; GSSG, glutathione disulfide; HSS, hypoxia and serum starvation; NADP, nicotinamide adenine dinucleotide phosphate; NADPH, reduced nicotinamide adenine dinucleotide phosphate; PFKFB3, 6‐phosphofructo‐2‐kinase/fructose‐2,6‐biphosphatase; PPP, pentose phosphate pathway; RSP, ribulose S‐phosphate; and VEGF, vascular endothelial growth factor. Schematic was created with BioRender.com.

Similar articles

Cited by

References

    1. De Bock K, Georgiadou M, Schoors S, Kuchnio A, Wong Brian W, Cantelmo Anna R, Quaegebeur A, Ghesquière B, Cauwenberghs S, Eelen G, et al. Role of PFKFB3‐driven glycolysis in vessel sprouting. Cell. 2013;154:651–663. doi: 10.1016/j.cell.2013.06.037 - DOI - PubMed
    1. Eilken HM, Adams RH. Dynamics of endothelial cell behavior in sprouting angiogenesis. Curr Opin Cell Biol. 2010;22:617–625. doi: 10.1016/j.ceb.2010.08.010 - DOI - PubMed
    1. Yetkin‐Arik B, Vogels IMC, Nowak‐Sliwinska P, Weiss A, Houtkooper RH, Van Noorden CJF, Klaassen I, Schlingemann RO. The role of glycolysis and mitochondrial respiration in the formation and functioning of endothelial tip cells during angiogenesis. Sci Rep. 2019;9:12608. doi: 10.1038/s41598-019-48676-2 - DOI - PMC - PubMed
    1. Wu J, Ke X, Fu W, Gao X, Zhang H, Wang W, Ma N, Zhao M, Hao X, Zhang Z. Inhibition of hypoxia‐induced retinal angiogenesis by specnuezhenide, an effective constituent of Ligustrum lucidum Ait., through suppression of the HIF‐1α/VEGF signaling pathway. Molecules. 2016;21:1756. doi: 10.3390/molecules21121756 - DOI - PMC - PubMed
    1. Cao R, Jensen LDE, Söll I, Hauptmann G, Cao Y. Hypoxia‐induced retinal angiogenesis in zebrafish as a model to study retinopathy. PLoS One. 2008;3:e2748. doi: 10.1371/journal.pone.0002748 - DOI - PMC - PubMed

Publication types

Substances