. 2023 Apr 17:12:e82364.
doi: 10.7554/eLife.82364.

Longitudinal fundus imaging and its genome-wide association analysis provide evidence for a human retinal aging clock

Affiliations

Longitudinal fundus imaging and its genome-wide association analysis provide evidence for a human retinal aging clock

Sara Ahadi et al. Elife. .

Abstract

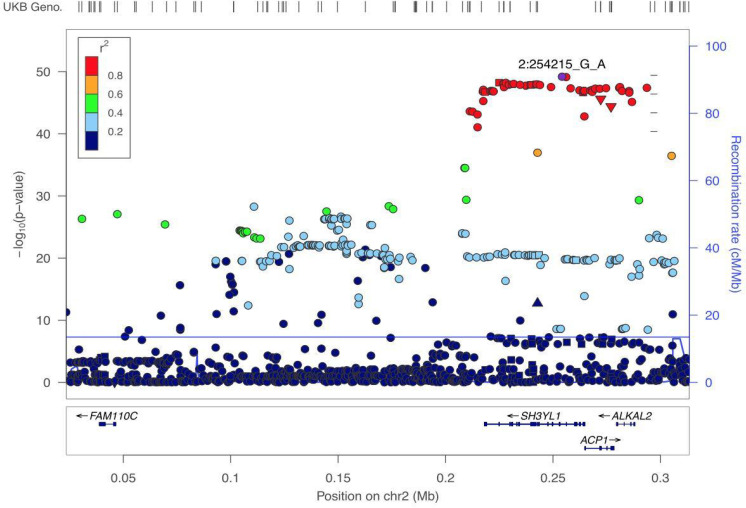
Biological age, distinct from an individual's chronological age, has been studied extensively through predictive aging clocks. However, these clocks have limited accuracy in short time-scales. Here we trained deep learning models on fundus images from the EyePACS dataset to predict individuals' chronological age. Our retinal aging clocking, 'eyeAge', predicted chronological age more accurately than other aging clocks (mean absolute error of 2.86 and 3.30 years on quality-filtered data from EyePACS and UK Biobank, respectively). Additionally, eyeAge was independent of blood marker-based measures of biological age, maintaining an all-cause mortality hazard ratio of 1.026 even when adjusted for phenotypic age. The individual-specific nature of eyeAge was reinforced via multiple GWAS hits in the UK Biobank cohort. The top GWAS locus was further validated via knockdown of the fly homolog, Alk, which slowed age-related decline in vision in flies. This study demonstrates the potential utility of a retinal aging clock for studying aging and age-related diseases and quantitatively measuring aging on very short time-scales, opening avenues for quick and actionable evaluation of gero-protective therapeutics.

Keywords: D. melanogaster; aging clock; biological age; computational biology; deep learning; fundus imaging; human; longitudinal sampling; systems biology.


Conflict of interest statement

SA, AB is not currently affiliated with Google Research, however work for this manuscript was conducted while affiliated with Google Research. The author has no other competing interests to declare, KW, AK, EC, RL, JS No competing interests declared, BB, CM, AV is affiliated with Google Health. The author has no other competing interests to declare, DB, OP, MB is affiliated with Google Research. The author has no other competing interests to declare, PK Reviewing editor, eLife

Figures

Figure 1.
Figure 1.. Schematic of analysis pipeline.
EyePACS images were split into train and tune sets based on the patient. The model was then trained with the final model step being selected via the tune set. Prediction results on the EyePACS tune set were used for longitudinal analysis of aging. After filtering for image quality, inference was performed with the same model on the UK Biobank dataset and filtering for image quality, and the resulting eyeAgeAccel was used for GWAS analysis. Enrichment analysis was performed on the GWAS hits with a homolog of the top gene (ALKAL2) validated experimentally in Drosophila.
Figure 2.
Figure 2.. Longitudinal analysis of patients with exactly two visits in the EyePACS cohort.
(A) Changes of PPR (positive prediction ratio: the ratio of data whose eyeAge increased between subsequent visits) and MAE (mean absolute error) calculated on the same individual in relationship to chronological age at the first visit (left) and time between longitudinal visits (right). (B) Scatter plots representing correlation between eyeAge Gap (difference between predicted age and chronological age) of two consecutive visits from an individual (Same) or two consecutive visits from two different individuals (Random). (C) Correlation of eyeAge and chronological age between left and right and two consecutive visits of the same individual. (D) Scatter plots representing the correlation of left and right eyeAge Gap from the same or two random individuals.
Figure 2—figure supplement 1.
Figure 2—figure supplement 1.. Scatter plot of eyeAge with chronological age (Pearson ⍴=0.96).
Figure 2—figure supplement 2.
Figure 2—figure supplement 2.. Scatterplot showing the time elapsed (x-axis) vs. the difference between time elapsed and change in eyeAge (y-axis).
Figure 2—figure supplement 3.
Figure 2—figure supplement 3.. Positive prediction ratio and MAE for random, time-matched individuals.
Plots shown in relationship to chronological age (left) and time between longitudinal visits (right).
Figure 3.
Figure 3.. Relationships between eyeAge, phenoAge, and chronological age in the UK Biobank cohort.
(A) Correlation between eyeAge and chronological age (Pearson ⍴=0.86). (B) Correlation between phenoAge and chronological age (Pearson ⍴=0.82). (C) Correlation between eyeAgeAcceleration and phenoAgeAcceleration (Pearson ⍴=0.12). (D) Forest plot of all-cause mortality hazard ratios (diamonds) and confidence intervals (lines) for the UK Biobank dataset. Purple lines are adjusted only for sex; orange lines are adjusted for sex and age; blue lines are adjusted for sex, age, and phenoAge.
Figure 3—figure supplement 1.
Figure 3—figure supplement 1.. Scatter plot of eyeAge and phenoAge (Pearson ⍴=0.71).
Figure 3—figure supplement 2.
Figure 3—figure supplement 2.. eyeAge hazard ratio adjusted with and without visual acuity.
Figure 4.
Figure 4.. GWAS analyses and experimental validation.
(A) Manhattan plot representing significant genes associated with eyeAgeAcceleration. (B) p-Values for enriched pathways: Macular thickness, ADHD (attention deficit hyperactivity disorder), AMD (age-related macular degeneration), spherical equivalent, and refractive error. (C) Assessment of visual performance of transgenic and control flies with age. p-Value is relative to control (*=p < 0.05). p-Value for ALK RNAi vs. control is 0.009; p-value for UAS-ALK-DN vs. control is 0.006. Error bars show standard deviation between 3 biological replicates. n = 100 flies per replicate.
Figure 4—figure supplement 1.
Figure 4—figure supplement 1.. eyeAgeAcceleration qq-plot.
Figure 4—figure supplement 2.
Figure 4—figure supplement 2.. Zoom in on significant locus covering three genes in a highly significant LD block.
This block includes the three genes: SH3YL1, ACP1, and ALKAL2.

Update of

  • doi: 10.1101/2022.07.25.501485

References

    1. Ahadi S, Zhou W, Schüssler-Fiorenza Rose SM, Sailani MR, Contrepois K, Avina M, Ashland M, Brunet A, Snyder M. Personal aging markers and ageotypes revealed by deep longitudinal profiling. Nature Medicine. 2020;26:83–90. doi: 10.1038/s41591-019-0719-5. - DOI - PMC - PubMed
    1. Ahadi S. Cmclean/eye_age.patch. swh:1:rev:ba002c0a6edddd13814ecc9e07ec14249b2375f4Software Heritage. 2023 https://archive.softwareheritage.org/swh:1:dir:64dfbc1c9ab27bbd009f57e14...
    1. Alipanahi B, Hormozdiari F, Behsaz B, Cosentino J, McCaw ZR, Schorsch E, Sculley D, Dorfman EH, Foster PJ, Peng LH, Phene S, Hammel N, Carroll A, Khawaja AP, McLean CY. Large-Scale machine-learning-based phenotyping significantly improves genomic discovery for optic nerve head morphology. American Journal of Human Genetics. 2021;108:1217–1230. doi: 10.1016/j.ajhg.2021.05.004. - DOI - PMC - PubMed
    1. Archibald NK, Clarke MP, Mosimann UP, Burn DJ. The retina in Parkinson’s disease. Brain. 2009;132:1128–1145. doi: 10.1093/brain/awp068. - DOI - PubMed
    1. Bocklandt S, Lin W, Sehl ME, Sánchez FJ, Sinsheimer JS, Horvath S, Vilain E. Epigenetic predictor of age. PLOS ONE. 2011;6:e14821. doi: 10.1371/journal.pone.0014821. - DOI - PMC - PubMed

Publication types