

PM2.5 promotes lung cancer progression through activation of the AhR-TMPRSS2-IL18 pathway
- PMID: 36975376
- PMCID: PMC10245036
- DOI: 10.15252/emmm.202217014
PM2.5 promotes lung cancer progression through activation of the AhR-TMPRSS2-IL18 pathway
Abstract
Particulate matter 2.5 (PM2.5) is a risk factor for lung cancer. In this study, we investigated the molecular mechanisms of PM2.5 exposure on lung cancer progression. We found that short-term exposure to PM2.5 for 24 h activated the EGFR pathway in lung cancer cells (EGFR wild-type and mutant), while long-term exposure of lung cancer cells to PM2.5 for 90 days persistently promoted EGFR activation, cell proliferation, anchorage-independent growth, and tumor growth in a xenograft mouse model in EGFR-driven H1975 cancer cells. We showed that PM2.5 activated AhR to translocate into the nucleus and promoted EGFR activation. AhR further interacted with the promoter of TMPRSS2, thereby upregulating TMPRSS2 and IL18 expression to promote cancer progression. Depletion of TMPRSS2 in lung cancer cells suppressed anchorage-independent growth and xenograft tumor growth in mice. The expression levels of TMPRSS2 were found to correlate with nuclear AhR expression and with cancer stage in lung cancer patient tissue. Long-term exposure to PM2.5 could promote tumor progression in lung cancer through activation of EGFR and AhR to enhance the TMPRSS2-IL18 pathway.
Keywords: AhR; EGFR; PM2.5; TMPRSS2; lung cancer.
© 2023 The Authors. Published under the terms of the CC BY 4.0 license.
Conflict of interest statement
The authors declare that they have no conflict of interest.
Figures
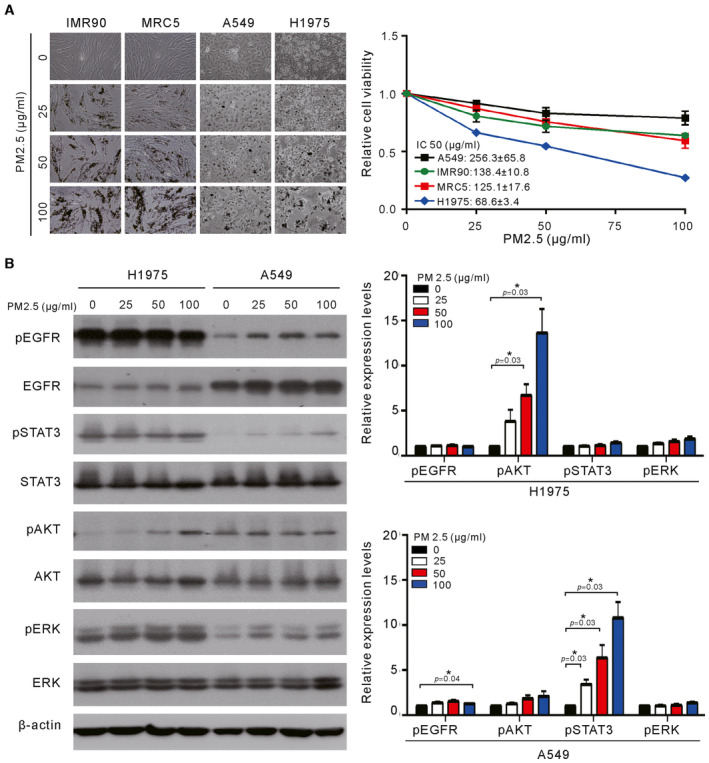
Normal lung cells (IMR90 and MRC5) and lung cancer cells (A549 and H1975) were treated with various concentrations of PM2.5 for 24 h, and cell viability was assessed by a Trypan blue assay. The values are the mean ± SD of three independent experiments.
H1975 and A549 cells were treated with various concentrations of PM2.5 for 24 h, and their cell lysates were analyzed for phosphor‐ERK (pERK), phosphor‐AKT (pAKT), phosphor‐STAT3 (pSTAT3), phosphor‐EGFR (pEGFR), ERK, AKT, STAT3, and EGFR by Western blotting. β‐actin served as the loading control. The results shown are from one of three similar experiments (left panel). The relative expression levels of pEGFR, pAKT, pSTAT3, and pERK were quantified by normalizing with β‐actin and are shown in the right panel. The values are the mean ± SD of three independent experiments. *P < 0.05, as analyzed with one‐sample t‐test and compared with untreated cells.
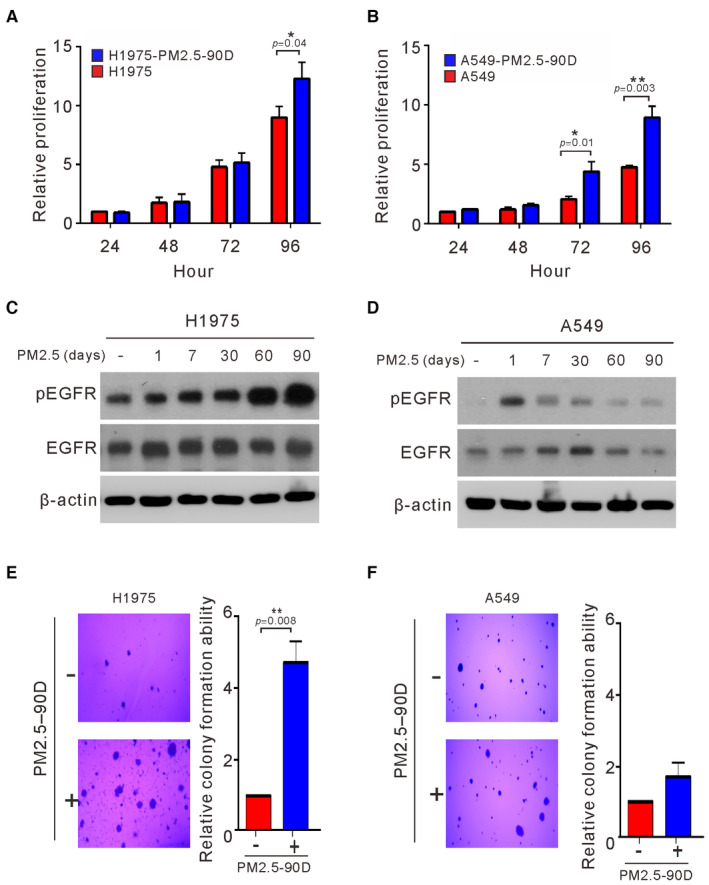
- A, B
H1975 and A549 cells were treated with PM2.5 at 50 μg/ml for 90 days, and the proliferation of the treated cells was assessed by Trypan blue assays.
- C, D
H1975 and A549 cells were exposed to PM2.5 at 50 μg/ml for different lengths of time, and the cell lysates of treated cells were assessed for phosphorylated EGFR (pEGFR) and EGFR by Western blotting. β‐actin served as the loading control.
- E, F
H1975 and A549 cells were treated with PM2.5 at 50 μg/ml for 90 days. The anchorage‐independent growth was assessed by a soft agar colony formation assay. The number of colonies was scored, and the data are presented as the relative colony formation ability.
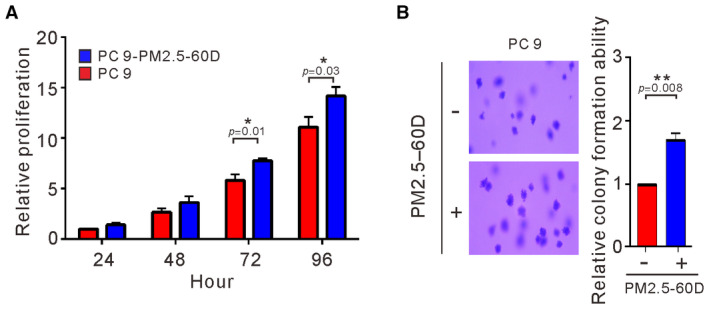
- A, B
PC9 cells were treated with PM2.5 at 50 μg/ml for 60 days. The proliferation of treated cells was assessed by Trypan blue assay (A). The anchorage‐independent growth was assessed by a soft agar colony formation assay (B). The data shown are the means ± SDs from three independent experiments. *P < 0.05 and **P < 0.01, compared with untreated cells. (A) P‐values were determined by two‐sample t‐test. (B) P‐values were determined by one‐sample t‐test.
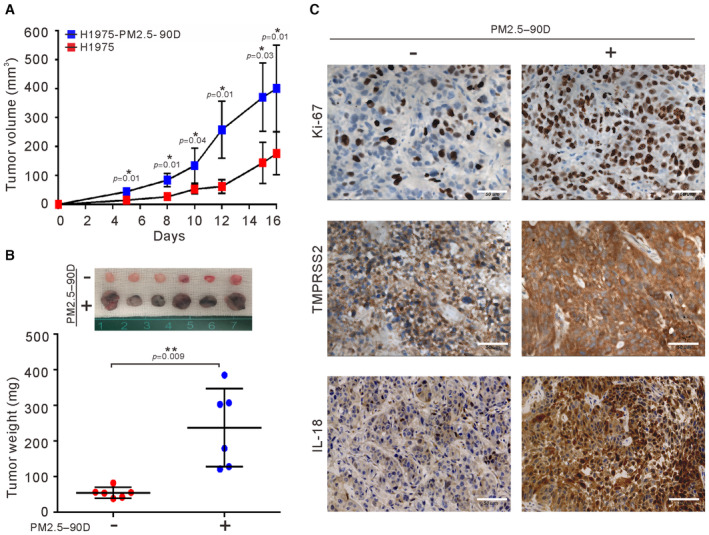
- A, B
The tumor volume and excised tumor weight were measured. The sizes of tumors excised from each group are shown at the top of (B).
- C
IHC staining of excised tumors for Ki‐67, IL18, and TMPRSS2 is shown in (C). Scale bars, 50 μm.
- A, B
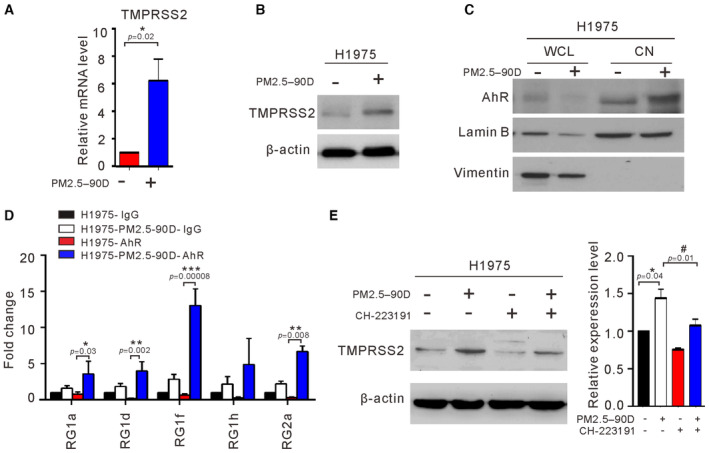
H1975 cells were treated with 50 μg/ml PM2.5 for 90 days, and the expression levels of TMPRSS2 mRNA and protein were determined by real‐time RT–PCR (A) and Western blotting (B), respectively.
- C
The proteins from whole cell lysates (WCL) and nuclear fractions (CN) were analyzed for AhR, lamin B (nuclei marker), and vimentin (cytoplasm marker) by Western blotting.
- D
ChIP–qPCR analysis of AhR binding to the promoter of the TMPRSS2 locus. The chromatin of untreated or treated H1975 cells was immunoprecipitated using AhR antibody. Precipitated genomic DNA was amplified for the five sites (RG1a, 1d, 1f, 1 h, and 2a) in the proximal promoter of the TMPRSS2 locus by real‐time PCR. Data were normalized to the input and expressed as “Fold change” relative to the IgG control of H1975 cells.
- E
Western blot analysis of TMPRSS2 expression in cells treated with CH223191 at 10 μM for 48 h. The relative expression level of TMPRSS2 was quantified by normalizing with β‐actin and is shown in the right panel.
- A
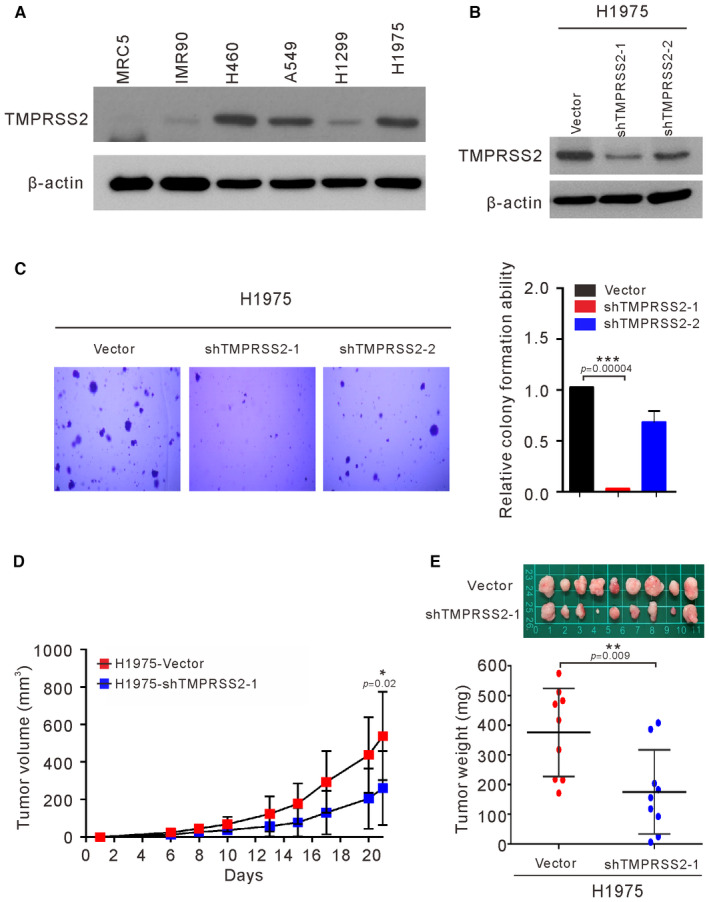
Expression of TMPRSS2 was examined by Western blots of four lung cancer cell lines (H460, A546, H1299, and H1975) and two normal fibroblasts (MRC5 and IMR90).
- B, C
H1975 cells were infected with sh‐TMPRSS2 (sh‐TMPRSS2‐1 and sh‐TMPRSS2‐2) or empty vector (Vector). The stable clones of TMPRSS2 knockdown cells were analyzed for the expression of TMPRSS2 by Western blots (B) and their ability to perform anchorage‐independent growth in soft agar (C).
- D, E
H1975‐shTMPRSS2‐1 cells were injected subcutaneously into mice (n = 9 per group), and the tumor growth of the implanted cells was measured (D). The excised tumors and their weights are shown in (E).
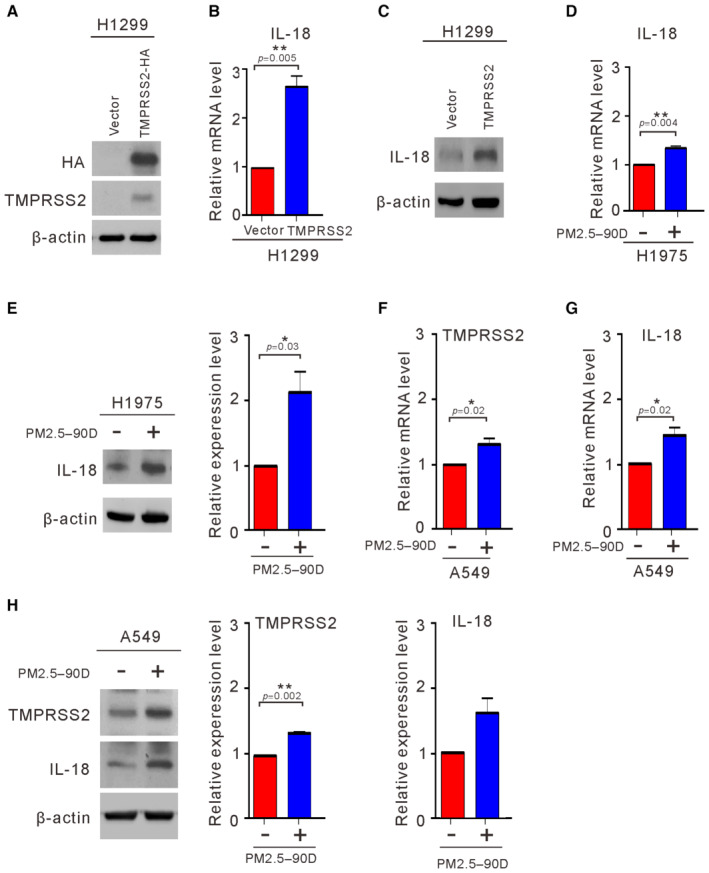
- A–C
H1299 cells were transfected with TMPRSS2‐HA or the empty vector (Vector). After 48 h, the transfected cells were assayed for the expression of TMPRSS2 (A) and the induction of IL18 by qRT–PCR (B) and Western blotting (C).
- D–H
The expression level of IL18 was examined in H1975 cells (D, E) and A549 cells (F–H) exposed to PM2.5 at 50 μg/ml for 90 days by qRT–PCR (D, F, and G) and Western blotting (E and H).
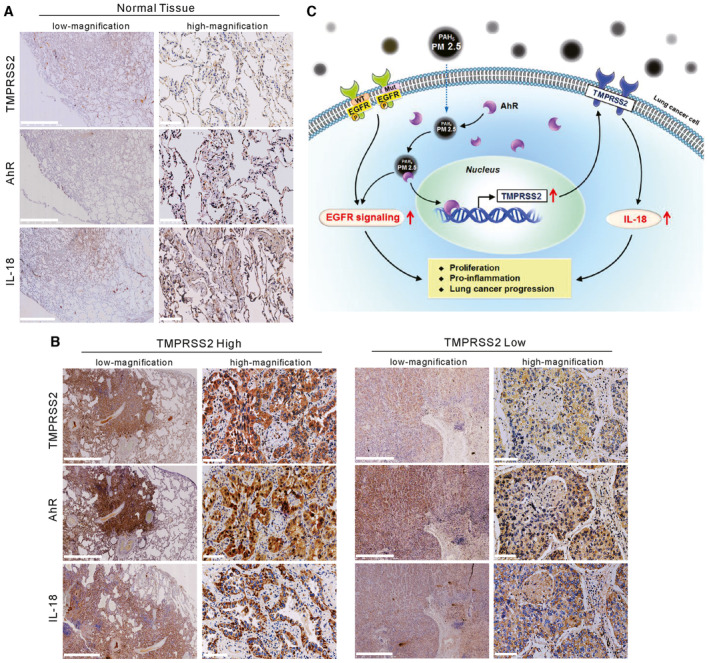
IHC staining of TMPRSS2, IL18, and nuclear AhR in a representative normal lung tissue section. Scale bars, 2.5 mm (low magnification) and 100 μm (high magnification).
IHC staining of TMPRSS2, IL18, and nuclear AhR in lung cancer tissues that displayed high or low expression of TMPRSS2. Scale bars, 2.5 mm (low magnification) and 100 μm (high magnification).
A schematic representation summarizing the mechanism by which particulate matter upregulates TMPRSS2 to promote lung cancer progression.
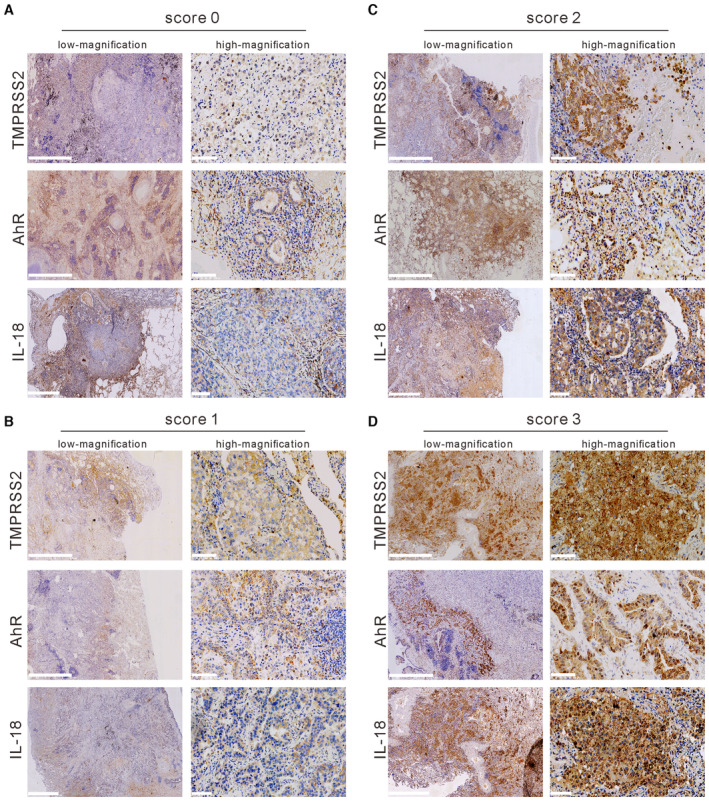
- A–D
(A) Score 0, (B) score 1, (C) score 2, and (D) score 3 of TMPRSS2, IL18, and AhR in lung cancer tissue. Scale bars, 2.5 mm (low magnification) and 100 μm (high magnification).
References
-
- Al‐Hamdan AZ, Albashaireh RN, Al‐Hamdan MZ, Crosson WL (2017) The association of remotely sensed outdoor fine particulate matter with cancer incidence of respiratory system in the USA. J Environ Sci Health A Tox Hazard Subst Environ Eng 52: 547–554 - PubMed
-
- Bazyar J, Pourvakhshoori N, Khankeh H, Farrokhi M, Delshad V, Rajabi E (2019) A comprehensive evaluation of the association between ambient air pollution and adverse health outcomes of major organ systems: a systematic review with a worldwide approach. Environ Sci Pollut Res Int 26: 12648–12661 - PubMed
-
- Chen CY, Chiou SH, Huang CY, Jan CI, Lin SC, Hu WY, Chou SH, Liu CJ, Lo JF (2009) Tid1 functions as a tumour suppressor in head and neck squamous cell carcinoma. J Pathol 219: 347–355 - PubMed
-
- Chen CY, Jan CI, Lo JF, Yang SC, Chang YL, Pan SH, Wang WL, Hong TM, Yang PC (2013) Tid1‐L inhibits EGFR signaling in lung adenocarcinoma by enhancing EGFR Ubiquitinylation and degradation. Cancer Res 73: 4009–4019 - PubMed
Publication types
MeSH terms
Substances
LinkOut - more resources
Full Text Sources
Medical
Molecular Biology Databases
Research Materials
Miscellaneous
