. 2023 Apr 25;14(2):e0339622.
doi: 10.1128/mbio.03396-22. Epub 2023 Mar 28.

Tuberculostearic Acid Controls Mycobacterial Membrane Compartmentalization

Affiliations

Tuberculostearic Acid Controls Mycobacterial Membrane Compartmentalization

Malavika Prithviraj et al. mBio. .

Abstract

The intracellular membrane domain (IMD) is a laterally discrete region of the mycobacterial plasma membrane, enriched in the subpolar region of the rod-shaped cell. Here, we report genome-wide transposon sequencing to discover the controllers of membrane compartmentalization in Mycobacterium smegmatis. The putative gene cfa showed the most significant effect on recovery from membrane compartment disruption by dibucaine. Enzymatic analysis of Cfa and lipidomic analysis of a cfa deletion mutant (Δcfa) demonstrated that Cfa is an essential methyltransferase for the synthesis of major membrane phospholipids containing a C19:0 monomethyl-branched stearic acid, also known as tuberculostearic acid (TBSA). TBSA has been intensively studied due to its abundant and genus-specific production in mycobacteria, but its biosynthetic enzymes had remained elusive. Cfa catalyzed the S-adenosyl-l-methionine-dependent methyltransferase reaction using oleic acid-containing lipid as a substrate, and Δcfa accumulated C18:1 oleic acid, suggesting that Cfa commits oleic acid to TBSA biosynthesis, likely contributing directly to lateral membrane partitioning. Consistent with this model, Δcfa displayed delayed restoration of subpolar IMD and delayed outgrowth after bacteriostatic dibucaine treatment. These results reveal the physiological significance of TBSA in controlling lateral membrane partitioning in mycobacteria. IMPORTANCE As its common name implies, tuberculostearic acid is an abundant and genus-specific branched-chain fatty acid in mycobacterial membranes. This fatty acid, 10-methyl octadecanoic acid, has been an intense focus of research, particularly as a diagnostic marker for tuberculosis. It was discovered in 1934, and yet the enzymes that mediate the biosynthesis of this fatty acid and the functions of this unusual fatty acid in cells have remained elusive. Through a genome-wide transposon sequencing screen, enzyme assay, and global lipidomic analysis, we show that Cfa is the long-sought enzyme that is specifically involved in the first step of generating tuberculostearic acid. By characterizing a cfa deletion mutant, we further demonstrate that tuberculostearic acid actively regulates lateral membrane heterogeneity in mycobacteria. These findings indicate the role of branched fatty acids in controlling the functions of the plasma membrane, a critical barrier for the pathogen to survive in its human host.

Keywords: fatty acids; lipidomics; membrane domain; phospholipids; transposon sequencing.


Conflict of interest statement

The authors declare no conflict of interest.

Figures
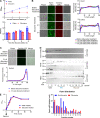
FIG 1
FIG 1
Dibucaine specifically delocalizes the subpolar enrichment of IMD proteins in M. smegmatis. (A) Cells expressing mCherry-GlfT2 and Ppm1-mNeonGreen from the endogenous loci were incubated with or without dibucaine for 9 h, and the OD600 and CFU were determined every 3 h in biological triplicates. Averages and standard deviations or individual data points are shown. (B) Effect of dibucaine on IMD-associated proteins. IMD-marker proteins, mCherry-GlfT2 and Ppm1-mNeonGreen, were observed every hour during dibucaine treatment (left). Representative images from biological triplicates are shown. Scale bar = 5 μm. Fluorescence intensity profiles along the long axis of the cells were quantified using Oufti (right). Ppm1: n = 237 (before), 121 (1 h), 289 (2 h), and 172 (3 h). GlfT2: n = 127 (before), 119 (1 h), 287 (2 h), or 169 (3 h). (C) The polar localization of DivIVA, a PM-CW marker protein, was examined before and after dibucaine treatment. Representative images from biological duplicates are shown. n = 36 (before) or 37 (3 h). (D) Sucrose gradient fractionation of cell lysates of the strain expressing mCherry-GlfT2 and Ppm1-mNeonGreen. The strain was treated with or without dibucaine. Ppm1-mNeonGreen (indicated by asterisks) was visualized by in-gel fluorescence after SDS-PAGE. The fluorescence intensity of each band was quantified and shown in a bar graph. Anti-PimB′ antibody sometimes detects a cytoplasmic protein migrating slightly lower than PimB′, and we do not know the nature of this protein (8). PimB′ and MptC (indicated by asterisks) were visualized by Western blotting using rabbit anti-PimB′ and anti-MptC antibodies. PimB′, an IMD marker; MptC, a PM-CW marker, which was unaffected by dibucaine treatment. Representative results from biological duplicates are shown. (E) Recovery from dibucaine treatment. The same strain expressing mCherry-GlfT2 and Ppm1-mNeonGreen was treated with dibucaine for 3 h, washed, and recovered in a fresh Middlebrook 7H9 medium. The growth recovery was monitored by OD600. Time 0 corresponds to the beginning of the recovery period. Representative results from biological duplicates are shown.
FIG 2
FIG 2
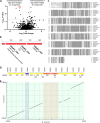
Tn-seq identifies cfa as a gene critical for surviving or recovering from dibucaine treatment. (A) The transposon mutant library was treated with dibucaine or water, washed, and recovered for ~16 h. Genes underrepresented or overrepresented in cells treated with dibucaine versus water are shown in the volcano plot. P values were calculated by Mann-Whitney U-test from 3 independent experiments. The horizontal gray line indicates P = 0.05; the vertical gray lines indicate 2-fold change. (B) The operon structure of cfa and the upstream gene encoding FAD-binding reductase in M. smegmatis. (C) Alignment of Cfa proteins. Cfa proteins from M. smegmatis mc2155, M. marinum, M. chlorophenolicum, M. abscessus, M. tuberculosis H37Rv, M. avium, and M. leprae were aligned using UniProt Align. (D) Map of the genome region surrounding the cfa gene, spanning region 6340496 to 6353816 in M. smegmatis (sequence ID: CP000480.1). (E) Pairwise alignment of the region 6340496 to 6353816 of M. smegmatis genome and the region 6782643 to 6796036 of M. gordonae genome (sequence ID: CP070973.1). The genome regions of M. smegmatis shaded in blue and brown correspond to MSMEG_6278 and MSMEG_6283-6284, respectively. These genes were missing from the syntenic region of the M. gordonae genome.
FIG 3
FIG 3
SAM-dependent enzyme activity of Cfa. (A) Purification of Cfa-6xHis by affinity column chromatography. Crude cell lysate, flowthrough, washes, and eluates were analyzed with SDS-PAGE and stained with Coomassie blue. Cfa-6xHis (expected molecular weight, 52.18 kDa) was prepared from eluate fractions 5 through 9. (B) Cfa-6xHis-dependent production of SAH in the presence of 80 μM PG C16:0/C18:1. (C) Kinetics of Cfa reaction. The rate of the SAH product formation increased with increasing concentrations of PG C16:0/C18:1 substrate. PG C16:0/C16:0 was ineffective as a substrate. All enzymatic assays were performed in triplicate.
FIG 4
FIG 4
Phenotype of Δcfa and subcellular localization of Cfa. (A) Growth curve for each strain grown at 37°C in Middlebrook 7H9 medium, measured by OD600. WT, wild type. (B) Fluorescence microscopy of the IMD marker strain, expressing Cfa-Dendra2-FLAG from the attB site of mycobacteriophage L5 and the IMD marker mCherry-GlfT2 from the endogenous locus. Scale bar = 5 μm. (C) Density gradient fractionation of a cell lysate of the IMD marker strain producing Cfa-Dendra2-FLAG. Cyto, cytoplasm. Anti-hemagglutinin (HA) antibody was used to detect mCherry-GlfT2, which has an N-terminal HA epitope tag (8). (D) HPTLC analysis of phospholipids visualized by molybdenum blue staining. CL, cardiolipin; PE, phosphatidylethanolamine; PI, phosphatidylinositol. (E) HPTLC analysis of glycopeptidolipids (GPLs) and trehalose dimycolate (TDM) visualized by orcinol staining. (F) HPTLC analysis of PIMs visualized by orcinol staining. HPTLC bands were assigned based on our previously published analyses (9, 56, 65, 66).
FIG 5
FIG 5
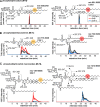
Comparative lipidomes from wild-type M. smegmatis, Δcfa, and its genetic complement, indicating the absence of TBSA in Δcfa. (A) Schematic of a lipidomic comparison and volcano plot of lipid ions differentially accumulating in Δcfa versus the wild type and Δcfa c detected by negative-mode HPLC-MS. Open circles indicate individual ions. (B) Model for Cfa enzymatic function consistent with the observed mass differences. (C) Mass versus retention time for 62 nearly co-eluting lipid pairs identified based on a CH4 mass change. Red circles indicate lipids enriched in the wild type and Δcfa c, while orange circles indicate lipids enriched in Δcfa. Lipid pairs differing by a CH4 mass change and <1.5-min retention time are connected by line segments. Inset, expansion of the plot area indicated by the black rectangle in the main plot showing mass values matching an [M-H] of C19:0, C16:0 PI (observed m/z 851.5653; red closed-over asterisk with red label), and its cognate C18:1, C16:0 PI pair (observed m/z 835.5333; orange closed-over asterisk). Pairs of a chain length variant, an unsaturation variant, and isotopes (open) are labeled. Mass intervals are also shown by a y axis marginal rug plot.
FIG 6
FIG 6
Targeted analysis of lipids regulated by cfa. (A) Ion chromatograms of PI containing C18:1, C16:0 (left) or C19:0, C16:0 (right) showing opposite effects of cfa deletion on the proposed precursor and product of Cfa. CID-MS interpreted collisional diagrams in each panel show the fragments observed by CID-MS within 10 ppm of the expected exact mass and are diagnostic for identification. Positions of fatty acid attachment, unsaturation (orange circle) and methylation (red circle) are inferred from the literature. (B) Ion chromatograms of PE. (C) Ion chromatograms of AcPIM2.
FIG 7
FIG 7
Δcfa shows delayed recovery after dibucaine treatment. (A) CFU were calculated in biological triplicate to determine the survival of Δcfa during dibucaine treatment. There were no statistically significant differences (indicated as ns) as determined by two-way analysis of variance (ANOVA) followed by Tukey’s multiple-comparison test. (B and C) Growth after washing out dibucaine (B) or benzyl alcohol (C) was monitored by OD600.
FIG 8
FIG 8
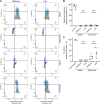
Membrane permeability barrier and proton gradient formation are largely unaffected in Δcfa. (A) Wild-type or Δcfa bacteria were stained with a membrane potential sensor [DiOC2(3)] and a membrane permeability sensor (TO-PRO-3) with or without dibucaine. Membrane potential was assessed by the fluorescence ratio (red/green) of DiOC2(3). Carbonyl cyanide m-chlorophenyl hydrazone (CCCP) was used to disrupt the membrane potential. Heat (65°C, 1 h) was used to permeabilize the membrane. The data set is a representative result from 5 experiments. (B and C) A population of wild-type or Δcfa cells that were negative for membrane potential [measured by the fluorescence ratio (red/green) of DiOC2(3)] (B) or positive for membrane permeability (measured by TO-PRO-3 stains) (C) was plotted. Each color shows a set of data from a single replicate. Statistical significances were determined by the Kruskal-Wallis test, followed by Dunn’s multiple comparison test. ns, not statistically significant.
FIG 9
FIG 9
Δcfa is defective in restoring subpolar membrane partitioning. (A) Western blotting of density gradient fractions of Δcfa cell lysates. Before or after 3-h dibucaine treatment, log-phase cells were lysed and fractionated by sucrose density gradient sedimentation. PimB′, an IMD marker; MptC, a PM-CW marker. (B) Recovery of the subpolar localization of the IMD marker mCherry-GlfT2 (mCh-GlfT2) expressed from the endogenous locus in wild-type (WT) or Δcfa cells. Cells were treated with 200 μg/mL dibucaine for 3 h, washed, and recovered for up to 12 h. Images were taken at 3, 6, and 12 h. Scale bar = 5 μm. (C) Profiles of relative fluorescence intensities from images taken as in panel B. Note that the wild-type cells are in a late log phase by 12 h post-dibucaine washout: the reduced level of subpolar enrichment at 12 h is likely due to the shift in growth phase, as reported before (13). Wild type: n = 46 (water), 93 (3 h), 54 (6 h), or 92 (12 h). Δcfa: n = 75 (water), 205 (3 h), 138 (6 h), or 77 (12 h).

References

    1. Batt SM, Minnikin DE, Besra GS. 2020. The thick waxy coat of mycobacteria, a protective layer against antibiotics and the host’s immune system. Biochem J 477:1983–2006. doi:10.1042/BCJ20200194. - DOI - PMC - PubMed
    1. Dulberger CL, Rubin EJ, Boutte CC. 2020. The mycobacterial cell envelope: a moving target. Nat Rev Microbiol 18:47–59. doi:10.1038/s41579-019-0273-7. - DOI - PubMed
    1. Jackson M, Stevens CM, Zhang L, Zgurskaya HI, Niederweis M. 2021. Transporters involved in the biogenesis and functionalization of the mycobacterial cell envelope. Chem Rev 121:5124–5157. doi:10.1021/acs.chemrev.0c00869. - DOI - PMC - PubMed
    1. Rahlwes KC, Sparks IL, Morita YS. 2019. Cell walls and membranes of Actinobacteria. Subcell Biochem 92:417–469. doi:10.1007/978-3-030-18768-2_13. - DOI - PubMed
    1. Bansal-Mutalik R, Nikaido H. 2014. Mycobacterial outer membrane is a lipid bilayer and the inner membrane is unusually rich in diacyl phosphatidylinositol dimannosides. Proc Natl Acad Sci USA 111:4958–4963. doi:10.1073/pnas.1403078111. - DOI - PMC - PubMed

Publication types

LinkOut - more resources