. 2023 Jul 3;220(7):e20222052.
doi: 10.1084/jem.20222052. Epub 2023 Mar 28.

The interweaved signatures of common-gamma-chain cytokines across immunologic lineages

Affiliations

The interweaved signatures of common-gamma-chain cytokines across immunologic lineages

Alev Baysoy et al. J Exp Med. .

Abstract

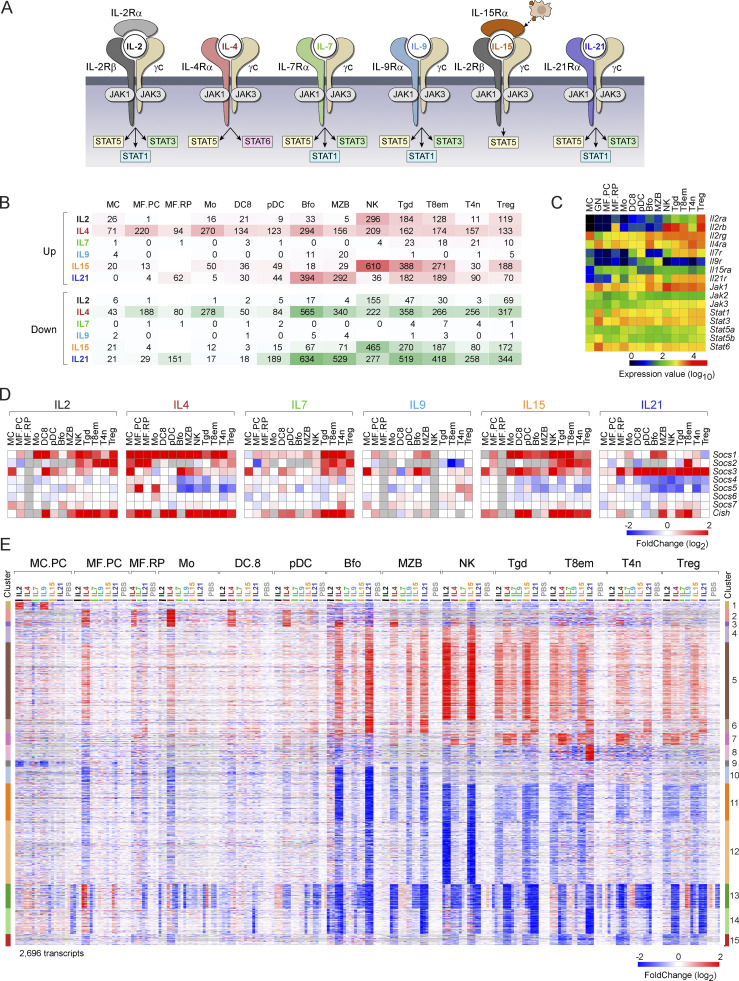
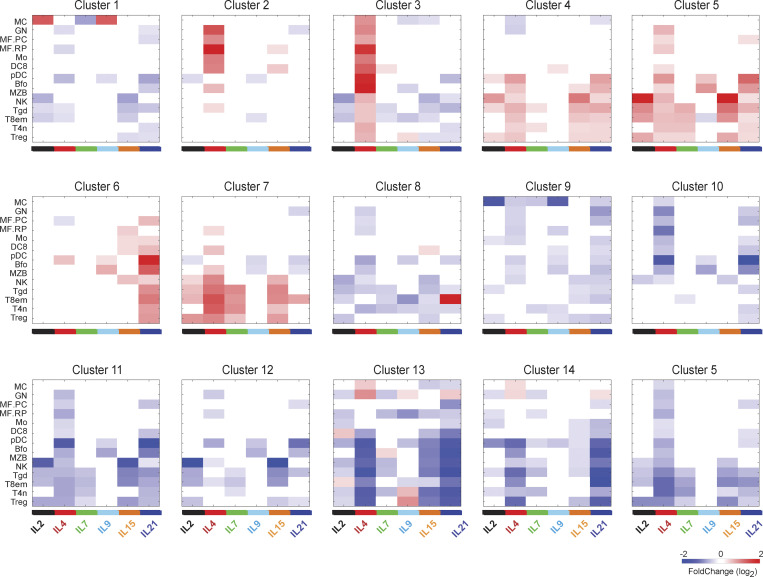
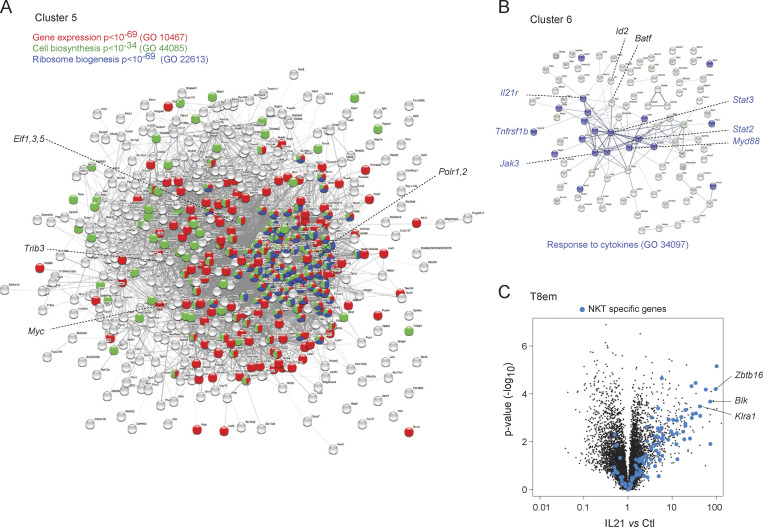
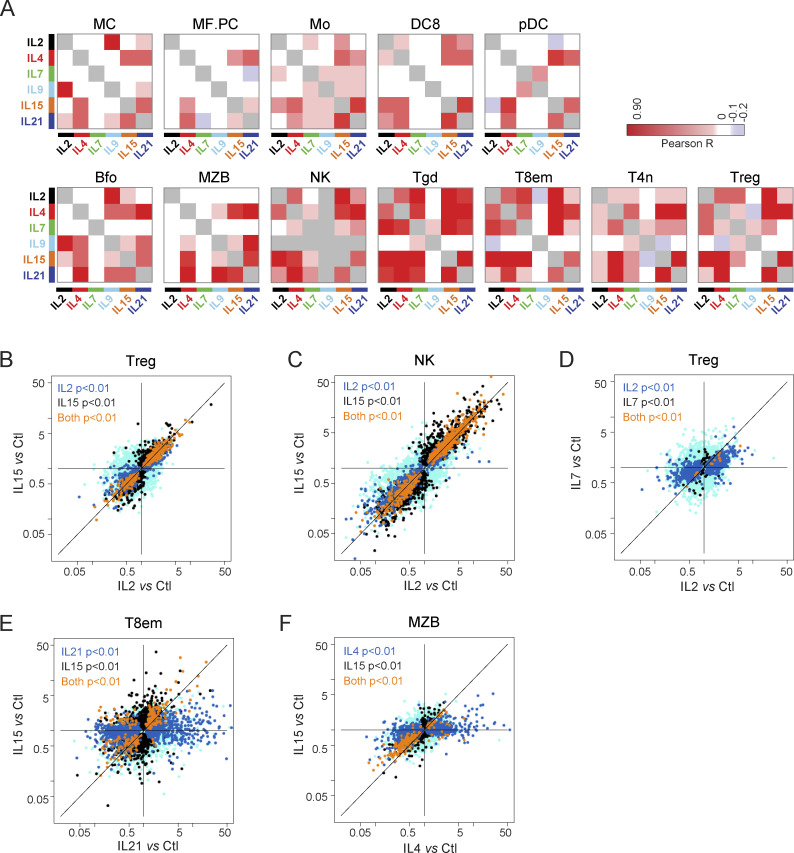
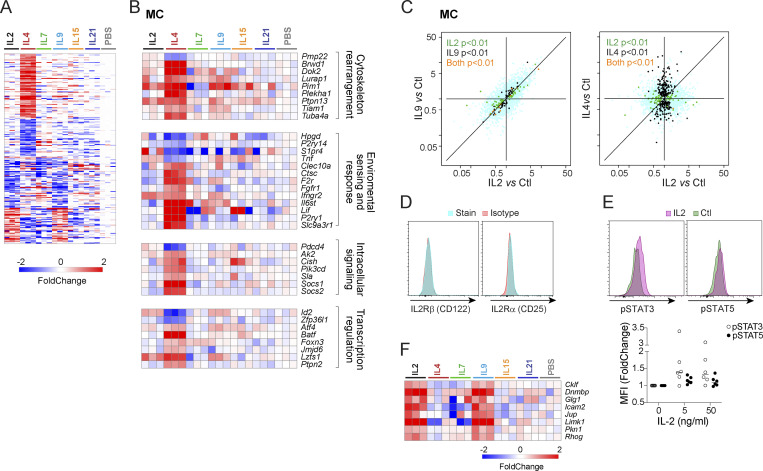
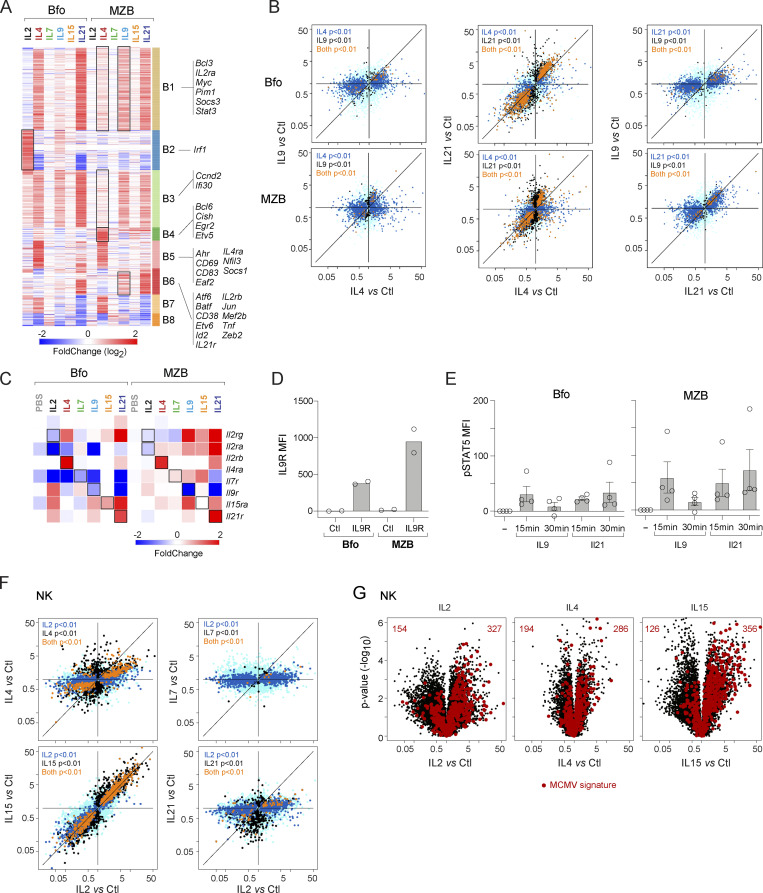
"γc" cytokines are a family whose receptors share a "common-gamma-chain" signaling moiety, and play central roles in differentiation, homeostasis, and communications of all immunocyte lineages. As a resource to better understand their range and specificity of action, we profiled by RNAseq the immediate-early responses to the main γc cytokines across all immunocyte lineages. The results reveal an unprecedented landscape: broader, with extensive overlap between cytokines (one cytokine doing in one cell what another does elsewhere) and essentially no effects unique to any one cytokine. Responses include a major downregulation component and a broad Myc-controlled resetting of biosynthetic and metabolic pathways. Various mechanisms appear involved: fast transcriptional activation, chromatin remodeling, and mRNA destabilization. Other surprises were uncovered: IL2 effects in mast cells, shifts between follicular and marginal zone B cells, paradoxical and cell-specific cross-talk between interferon and γc signatures, or an NKT-like program induced by IL21 in CD8+ T cells.


Conflict of interest statement

Disclosures: D.F. Dwyer reported grants from Blueprint Medicines outside the submitted work. No other disclosures were reported.

Figures

Figure 1.
Figure 1.
Overview of early responses to γc cytokines. (A) A summary of the receptor and primary signal transducers for the γc cytokines used here (from Leonard et al., 2019). (B) Tally of the number of genes up- or downregulated (at arbitrary FC threshold of 2), 2 h after administration of indicated cytokines. See Table S2 for acronyms. (C) Expression of key receptors and signal transducers in the profiled cell-types (DEseq2 normalized values). (D) Induction of cytokine signal downregulators of the SOCS family (as FC relative to the mean of PBS controls in the matched experiments); gray cells: insufficient data. (E) Complete overview of 2,696 genes that significantly change in response to one or more γc cytokines, across all cell types. Activated and repressed clusters at right.
Figure S1.
Figure S1.
Response of cluster genes to individual cytokines. Average of changes in gene expression in cell/cytokine pairs for the responsive clusters defined in Fig. 1 E. See Table S2 for acronyms.
Figure 2.
Figure 2.
Composition of major response clusters. (A) Interaction map (String) of the main metabolic/biosynthetic Cluster 5 (from Fig. 1 E), annotated for major functional categories. (B) Cytokine signaling transcripts of Cluster 6. (C) Responses in CD8 T cells to IL21 (corresponding to Cluster 8), highlighted for transcripts that distinguish NKT from other CD4+ T cells. GO, GeneOntology.
Figure 3.
Figure 3.
Cell-type-specific relationship between responses to γc cytokines. (A) Correlation matrices between responses to γc cytokines in different cell types. (B–F) FC/FC plots relating changes induced by two cytokines in the same cell. Transcripts whose changes meet a t test P value <0.01 (uncorrected) in one or both treatment conditions are highlighted in different colors. See Table S2 for acronyms.
Figure S2.
Figure S2.
Short-term responses to IL2/anti-IL2 complexes. Comparison of changes induced by pure recombinant mIL2 injected alone or complexed with two anti-IL2 antibodies (JES6 and S4B6) that allow IL2 signaling with preference for the CD25 or CD122 forms. Complexes were formed under the conditions of Spangler et al. (2015b), but we cannot be sure that no free IL2 dissociates after injection, possibly explaining the surprisingly similar profiles.
Figure 4.
Figure 4.
Overlap between responses to Type-I IFN and γc cytokines. (A) Volcano plot of the response to IL2 in Tregs, with IFN signature genes (from Mostafavi et al., 2016) highlighted. (B) FC/FC plots comparing Treg responses to IL2 and IL21, with IFN signature genes highlighted. (C) As B, IL4, and IL21 in naive CD4+ T conventional cells. (D) Mean FC of IFN signature genes in all cytokine/cell pairs. See Table S2 for acronyms. (E) Volcano plots of responses to IL4 and IL21 in B cells, IFN signature genes highlighted. (F) As B, comparing responses to IL2 in Treg and NK cells.
Figure 5.
Figure 5.
Molecular mechanisms underlying responses to γc cytokines. Chromatin immunoprecipitation and sequencing (CUT&RUN) was used to analyze chromatin structure in Bfo, 2 h after in vivo administration of IL4 (or PBS control). (A) Integrated signal for H3.K36me3 across gene bodies, plotting mean signal vs. IL4/control FC at each locus. Red highlights: genes with IL4-induced mRNA >4-fold; blue: genes with IL4-repressed mRNA <0.25-fold. (B) Representative tracks across three genes whose mRNAs are induced by IL4 for H3.K4me3 (promoters), H3.K36me3, and H3.K27ac; precipitation with non-specific IgG shown as a control. (C) As B, for a representative repressed gene. (D) Relative changes in H3.K27ac (active enhancer) and H3.K27me3 (closed enhancer) after IL4 treatment. (E) Over-representation, computed with reference to oRNAment tables, in sequence motifs for RNA-binding proteins in the 3′UTRs of genes repressed by γc cytokines (1,055 Cluster 10–13 genes, Fig. 1 E), relative to 2,979 IL4-neutral taken as background reference. P value of the difference in frequencies. (F) Expression of transcripts encoding the RNA-binding proteins from E, shown as orange highlights, in Bfo and NK cells, treated with IL4 or IL21, and IL2 or IL15, respectively.
Figure S3.
Figure S3.
IL4-induced changes in marks of promoter and enhancer activity. H3K4me3 and H3K27ac signals were integrated over the −2,000 to +200 bp region around genes’ transcription start site. Their IL4-induced changes (y-axis) were plotted against corresponding changes in mRNA abundance.
Figure 6.
Figure 6.
Unexpected responses to γc cytokines in MCs. (A) Heatmap of all significant changes (FC < 0.5 or > 2, with t test P < 0.01) induced by at least one γc cytokine in MCs, as log2 FC. (B) As A, focused on responses to IL4. (C) FC/FC plot comparing changes induced by IL2, IL9, and IL4 in MCs; t test P values color-coded as in Fig. 3 B. (D) Flow cytometric analysis of both chains of the conventional IL2 receptor on peritoneal MCs. (E) Flow cytometric detection of phosphorylated-STAT3 or STAT5, 30 min after in vitro treatment of peritoneal MCs with IL2 (5 ng/ml); control are parallel culture wells with no IL2; the results from several experiments are compiled at right (change in Mean Fluorescence Intensity [MFI] relative to untreated cells). (F) Focused heatmap of IL2 and IL9 responsive transcripts in MCs.
Figure 7.
Figure 7.
Unexpected responses to γc cytokines in B and NK cells. (A) Reclustered heatmap of all significant upregulations (FC > 2, with t test P < 0.01) induced by at least one γc cytokine in Bfo or MZB. Black squares indicate clusters differentially induced in Bfo and MZB. (B) FC/FC plots relating changes induced by two cytokines in either Bfo or MZB cells; color-coding of statistical significance as in Fig. 3 B. (C) Profound changes induced in transcripts encoding cytokine receptors in Bfo or MZB. (D) Flow cytometric detection (shown as MFI) of IL9R on Bfo or MZB cells—each dot is an independent experiment. (E) Flow cytometric detection of phosphorylated STAT5 after in vitro treatment of splenic B cells with IL9 or IL21. Control (no cytokine) MFI was subtracted from the test sample value. Each dot is an independent experiment. (F) FC/FC plot comparing changes induced by IL2 and other γc cytokines in NK cells; t test P values color-coded as in Fig. 3 B. (G) Changes elicited by γc cytokines in NK cells, with highlights corresponding to the signature of MCMV infection in NK (from Bezman et al., 2012).

References

    1. Angkasekwinai, P., and Dong C.. 2021. IL-9-producing T cells: potential players in allergy and cancer. Nat. Rev. Immunol. 21:37–48. 10.1038/s41577-020-0396-0 - DOI - PubMed
    1. Barata, J.T., Durum S.K., and Seddon B.. 2019. Flip the coin: IL-7 and IL-7R in health and disease. Nat. Immunol. 20:1584–1593. 10.1038/s41590-019-0479-x - DOI - PubMed
    1. Benoit Bouvrette, L.P., Bovaird S., Blanchette M., and Lécuyer E.. 2020. oRNAment: A database of putative RNA binding protein target sites in the transcriptomes of model species. Nucleic Acids Res. 48:D166–D173. 10.1093/nar/gkz986 - DOI - PMC - PubMed
    1. Berglund, L.J., Avery D.T., Ma C.S., Moens L., Deenick E.K., Bustamante J., Boisson-Dupuis S., Wong M., Adelstein S., Arkwright P.D., et al. . 2013. IL-21 signalling via STAT3 primes human naive B cells to respond to IL-2 to enhance their differentiation into plasmablasts. Blood. 122:3940–3950. 10.1182/blood-2013-06-506865 - DOI - PMC - PubMed
    1. Bezbradica, J.S., and Medzhitov R.. 2009. Integration of cytokine and heterologous receptor signaling pathways. Nat. Immunol. 10:333–339. 10.1038/ni.1713 - DOI - PubMed

Publication types