. 2023 Jul 5;21(7):631-647.
doi: 10.1158/1541-7786.MCR-22-0745.

Disruption of the MYC Superenhancer Complex by Dual Targeting of FLT3 and LSD1 in Acute Myeloid Leukemia

Affiliations

Disruption of the MYC Superenhancer Complex by Dual Targeting of FLT3 and LSD1 in Acute Myeloid Leukemia

William M Yashar et al. Mol Cancer Res. .

Abstract

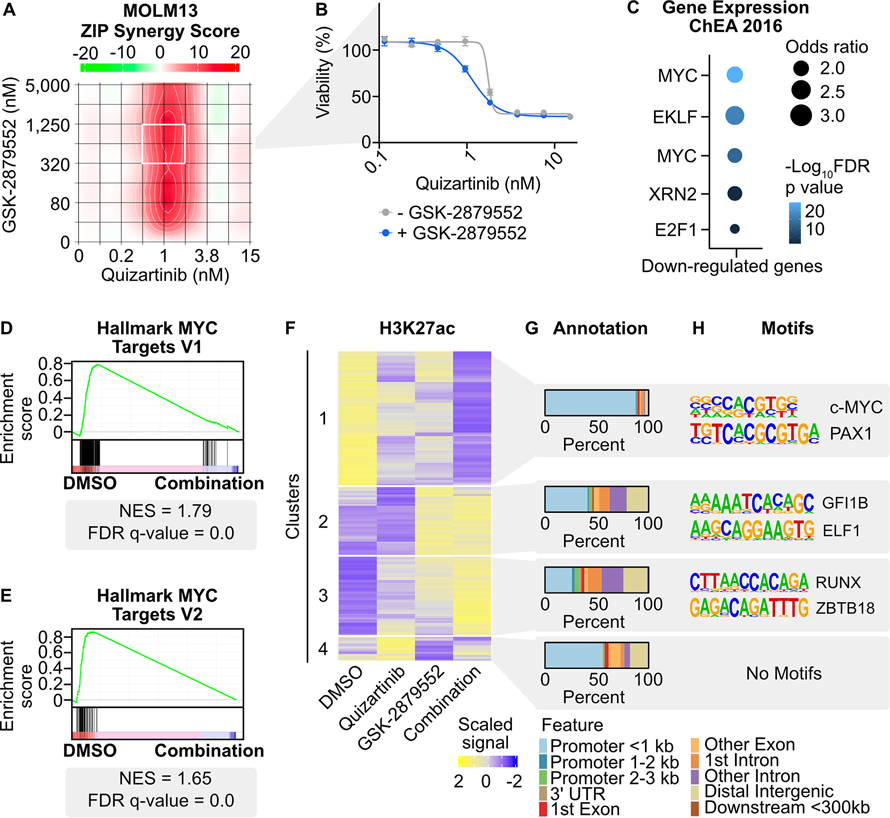
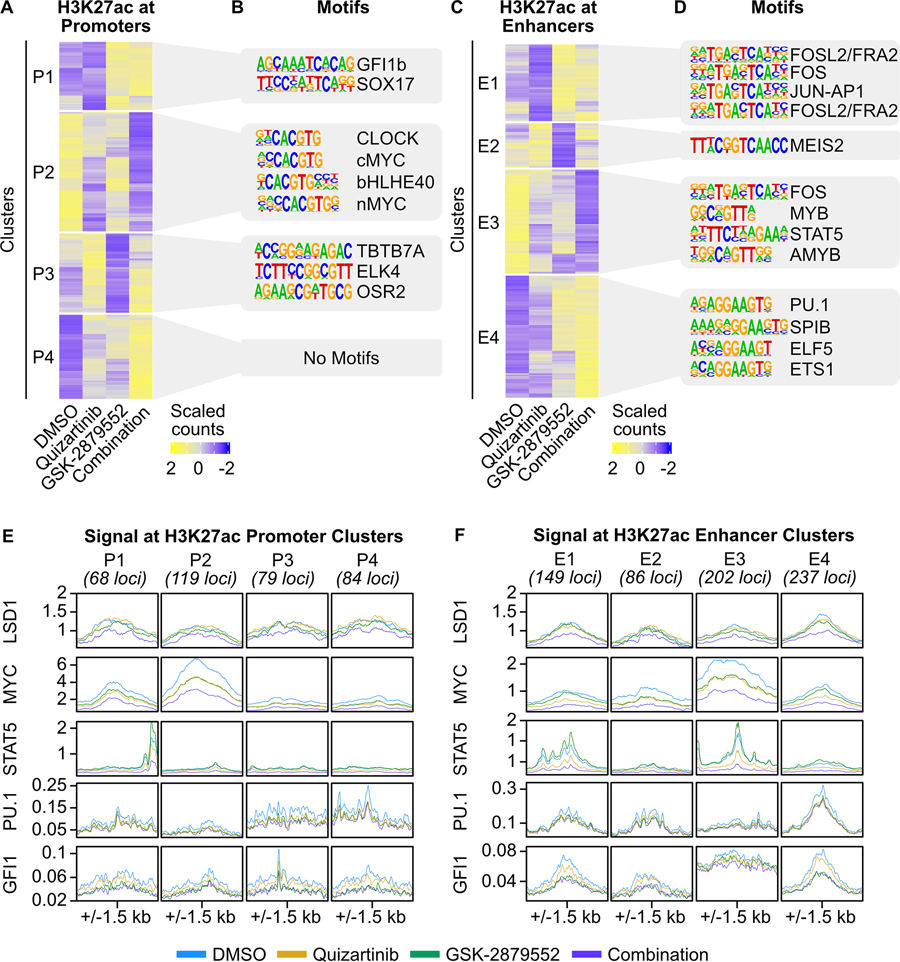
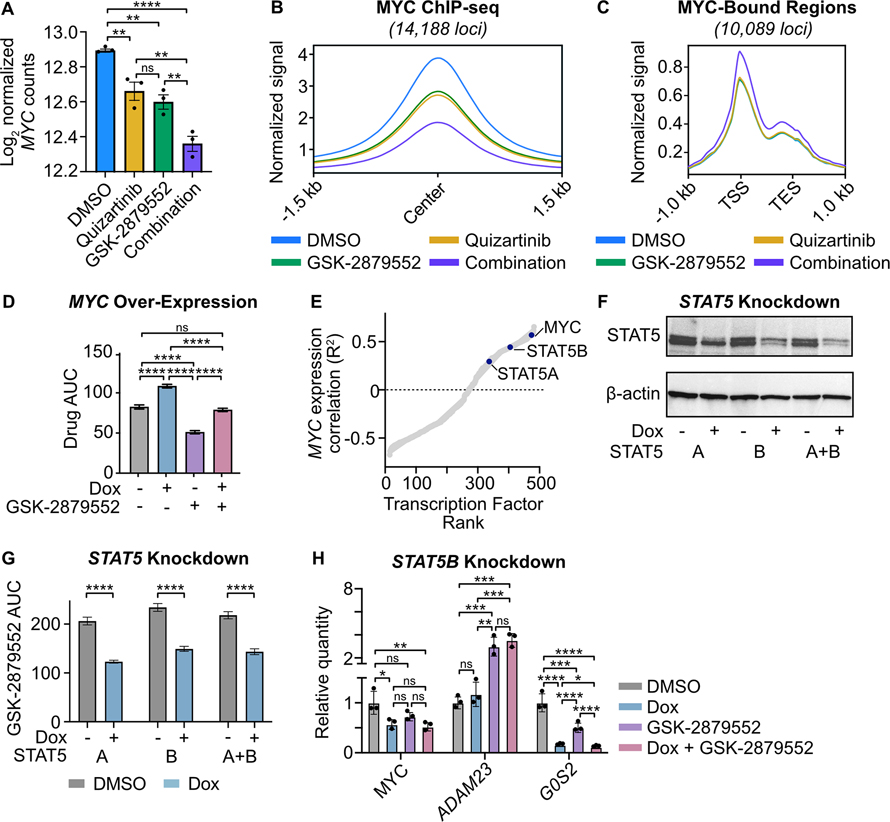
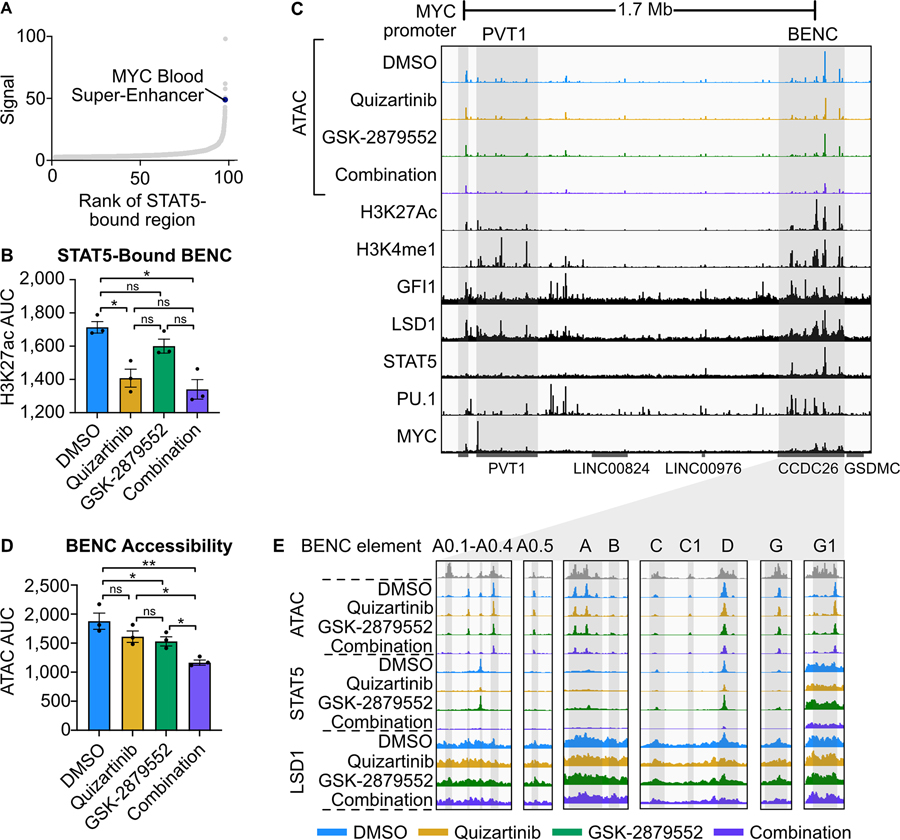
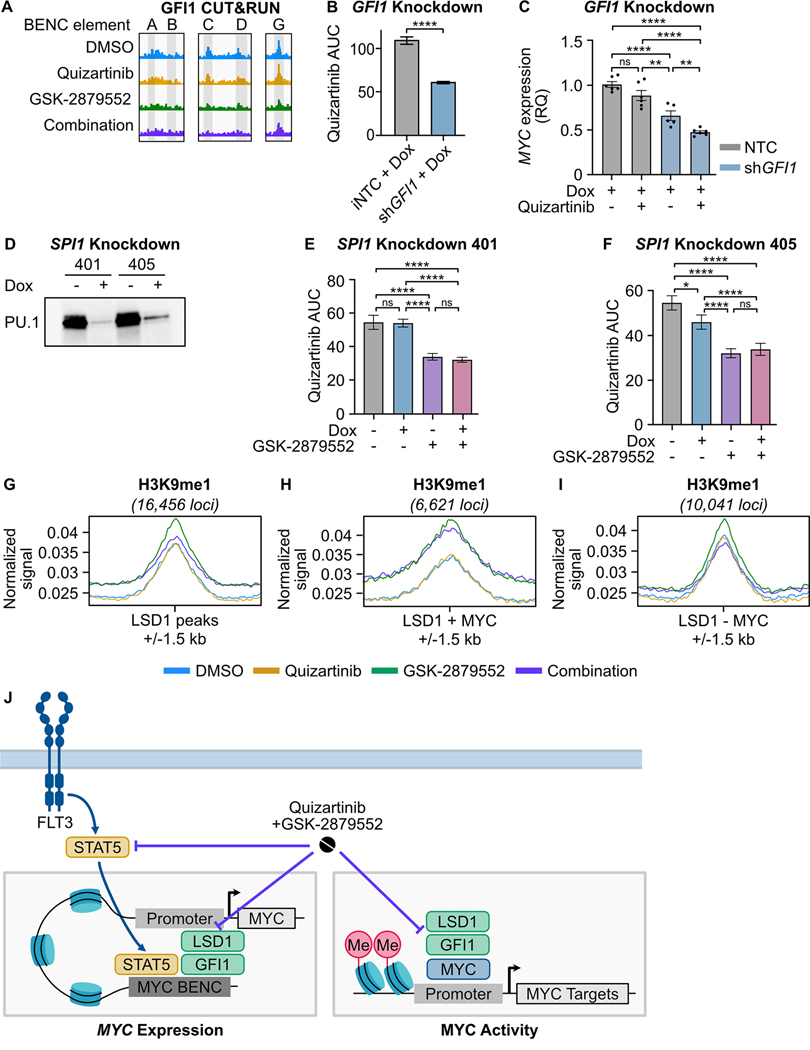
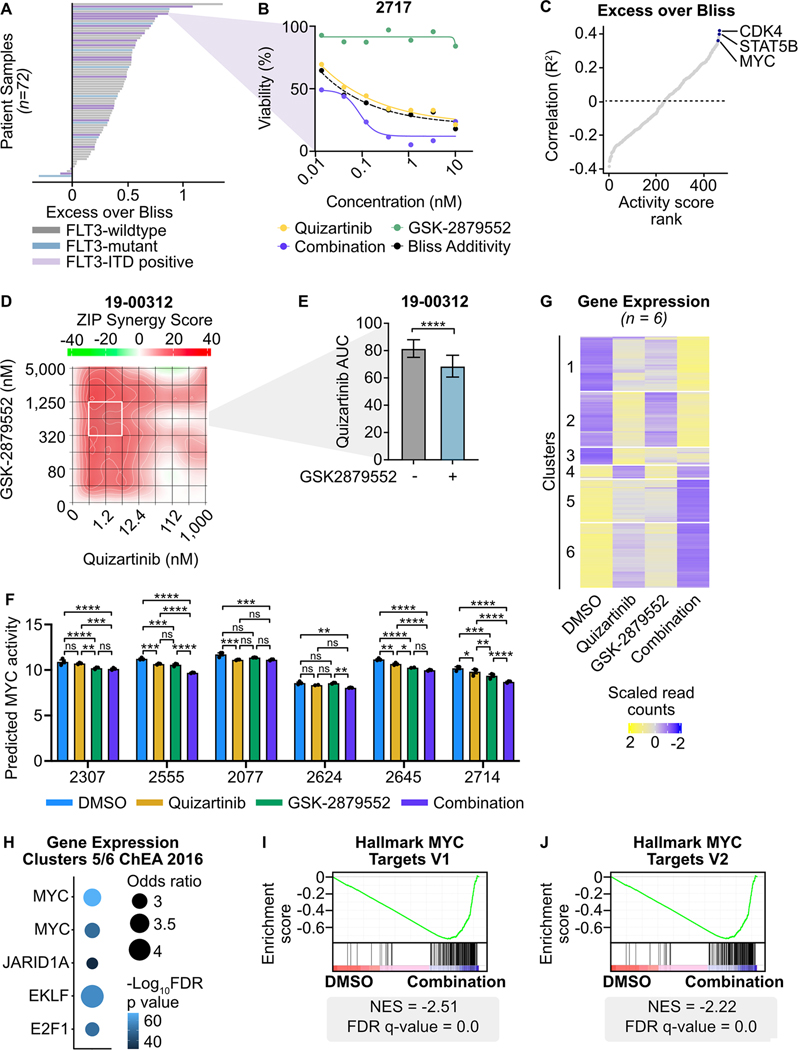
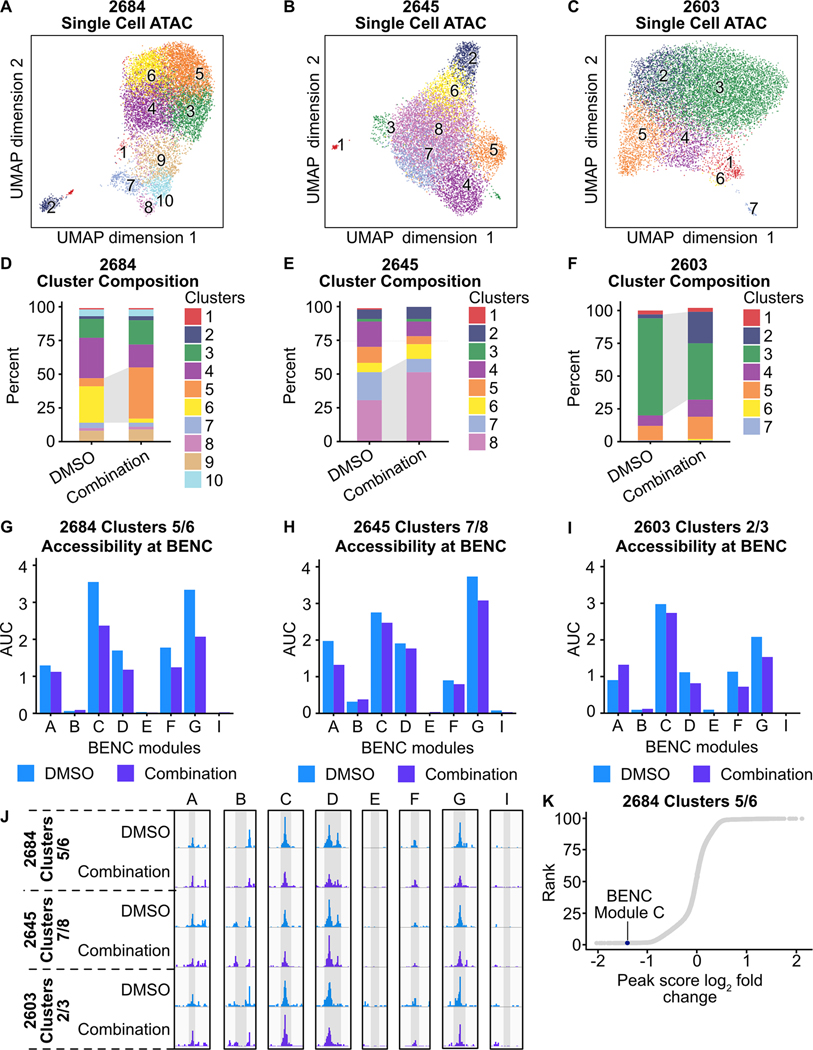
Mutations in Fms-like tyrosine kinase 3 (FLT3) are common drivers in acute myeloid leukemia (AML) yet FLT3 inhibitors only provide modest clinical benefit. Prior work has shown that inhibitors of lysine-specific demethylase 1 (LSD1) enhance kinase inhibitor activity in AML. Here we show that combined LSD1 and FLT3 inhibition induces synergistic cell death in FLT3-mutant AML. Multi-omic profiling revealed that the drug combination disrupts STAT5, LSD1, and GFI1 binding at the MYC blood superenhancer, suppressing superenhancer accessibility as well as MYC expression and activity. The drug combination simultaneously results in the accumulation of repressive H3K9me1 methylation, an LSD1 substrate, at MYC target genes. We validated these findings in 72 primary AML samples with the nearly every sample demonstrating synergistic responses to the drug combination. Collectively, these studies reveal how epigenetic therapies augment the activity of kinase inhibitors in FLT3-ITD (internal tandem duplication) AML.

Implications: This work establishes the synergistic efficacy of combined FLT3 and LSD1 inhibition in FLT3-ITD AML by disrupting STAT5 and GFI1 binding at the MYC blood-specific superenhancer complex.


Conflict of interest statement

Conflict of Interest

W.M. Yashar is a former employee of Abreos Biosciences, Inc. and was compensated in part with common stock options. Pursuant to the merger and reorganization agreement between Abreos Biosciences, Inc. and Fimafeng, Inc., W.M.Y. surrendered all of his common stock options in 03/2021. J.E. Maxson discloses a collaboration with Ionis pharmaceuticals, research funding from Gilead Sciences, research funding from Kura Oncology and research funding from Blueprint Medicines. J.W. Tyner has received research support from Acerta, Agios, Aptose, Array, AstraZeneca, Constellation, Genentech, Gilead, Incyte, Janssen, Kronos, Meryx, Petra, Schrodinger, Seattle Genetics, Syros, Takeda, and Tolero. B.J. Druker potential competing interests-- SAB: Adela Bio, Aileron Therapeutics (inactive), Therapy Architects/ALLCRON (inactive), Cepheid, DNA SEQ, Nemucore Medical Innovations, Novartis, RUNX1 Research Program; SAB & Stock: Aptose Biosciences, Blueprint Medicines, Enliven Therapeutics, Iterion Therapeutics, GRAIL, Recludix Pharma; Board of Directors & Stock: Amgen, Vincerx Pharma; Board of Directors: Burroughs Wellcome Fund, CureOne; Joint Steering Committee: Beat AML LLS; Advisory Committee: Multicancer Early Detection Consortium; Founder: VB Therapeutics; Sponsored Research Agreement: Enliven Therapeutics, Recludix Pharma; Clinical Trial Funding: Novartis, Astra-Zeneca; Royalties from Patent 6958335 (Novartis exclusive license) and OHSU and Dana-Farber Cancer Institute (one Merck exclusive license, one CytoImage, Inc. exclusive license, and one Sun Pharma Advanced Research Company non-exclusive license); US Patents 4326534, 6958335, 7416873, 7592142, 10473667, 10664967, 11049247. T.P. Braun has received research support from AstraZeneca, Blueprint Medicines as well as Gilead Sciences and is the institutional PI on the FRIDA trial sponsored by Oryzon Genomics. The authors certify that all compounds tested in this study were chosen without input from any of our industry partners. The other authors do not have competing interests, financial or otherwise.

Figures

Fig. 1:
Fig. 1:. Transcriptional and chromatin dynamics in response to combined FLT3/LSD1 inhibition in FLT3-ITD-positive AML.
A, MOLM13 cells were treated in triplicate with an 8×8 dose matrix of quizartinib and GSK-2879552 for 72 hours prior to viability assessment by CellTiter Aqueous colorimetric assay. Zero interaction potency (ZIP) synergy scores were calculated on the average values for each drug dose. The white box indicates the quizartinib and GSK-2879552 concentrations corresponding to maximal synergy. B, Quizartinib response curves with and without GSK-2879552 (638 nM, which is the concentration corresponding to maximal synergy in (A)). The GSK-2879552 response curve with and without quizartinib is shown in Supplementary Fig. 1. C, MOLM13 cells were treated with quizartinib (1 nM), GSK-2879552 (100 nM), the combination, or an equal volume of DMSO vehicle for 24 hours prior to RNA sequencing. Analysis was performed on genes with decreased expression with the drug combination relative to DMSO. D, E, GSEA was performed comparing the drug combination to DMSO. F, MOLM13 cells were treated with quizartinib (1 nM), GSK-2879552 (100 nM), the combination, or an equal volume of DMSO vehicle for 2 hours prior to CUT&Tag for H3K27ac. Unsupervised hierarchical clustering of regions with differential signal following drug treatment. G, Annotation of regions in clusters from (F). H, Motif enrichment of regions with differential H3K27ac signal. Top two de novo motifs with p-value <10−12 are shown.
Fig. 2:
Fig. 2:. Discrete components of the response to FLT3/LSD1 inhibition are mediated by promoters and enhancers.
A, MOLM13 cells were treated with quizartinib (1 nM), GSK-2879552 (100 nM), the combination, or an equal volume of DMSO vehicle for 6 hours prior to CUT&Tag for H3K27ac, H3K4me1, and H3K4me3. On the basis of these marks, chromatin was segmented into promoters and enhancers. Unsupervised hierarchical clustering of differential H3K27ac signal at promoters. B, Motif enrichment of promoters with differential H3K27ac signal. Top four de novo motifs with p-value <10−12 are shown. C, D, Same analyses as (A) and (B) were performed at enhancers. E, MOLM13 cells were treated with quizartinib (1 nM), GSK-2879552 (100 nM), the combination, or an equal volume of DMSO for 6 hours. LSD1, MYC, and STAT5 binding was assessed by ChIP-seq. PU.1 and GFI1 binding was assessed by CUT&RUN. Transcription factor binding profiles at promoters with differential H3K27ac identified in (A). F, Transcription factor profiles at enhancers with differential H3K27ac identified in (C).
Fig. 3:
Fig. 3:. MYC expression is suppressed by combined FLT3/LSD1 inhibition and is associated with STAT5 regulatory activity.
A, Normalized MYC counts from RNA-seq presented in Fig. 1. Statistical significance was determined by two-way ANOVA with a Holm-Šidák post-test correction. B, MYC binding profile at consensus peaks from MOLM13 ChIP-seq presented in Fig. 2. C, MOLM13 cells were treated with quizartinib (1 nM), GSK-2879552 (100 nM), the combination, or an equal volume of DMSO vehicle for 6 hours prior to CUT&Tag for RBP1. RBP1 binding profile at RBP1 and MYC co-bound regions. D, MOLM13 cells were transduced with lentiviral particles harboring a doxycycline-inducible MYC expression vector. Cells were treated with doxycycline (1 μg/mL) or DMSO for 48 hours and then plated in an 8×8 matrix of quizartinib and GSK-2879552 for 72 hours prior to viability assessment by CellTiter Aqueous colorimetric assay. AUC data from the 311 nM GSK-2979552 isoline (the concentration corresponding to maximal synergy in the MYC over-expressed MOLM13 cells) is shown. Dose responses and synergy over the entire drug matrix is shown in Supplementary Fig. 4. Statistical significance was determined by two-way ANOVA with a Holm-Šidák post-test correction. E, Spearman’s correlation of normalized MYC gene counts and predicted transcription factor activity scores. Activity scores were inferred from baseline RNA-seq performed on patients in the BeatAML cohort. Transcription factors are ranked by goodness of fit (R2). F, MOLM13 cells were transduced with lentiviral particles harboring a doxycycline-inducible STAT5 short hairpin RNA (shRNA) knockdown vector. Western blot for STAT5 and β-actin following treatment with doxycycline (1 μg/mL) or DMSO for 48 hours. G, GSK-2879552 AUC of MOLM13 STAT5 knockdown cells treated with doxycycline (1 μg/mL) or DMSO for 72 hours. The GSK-2879552 response curves are shown in Supplementary Fig. 5. Statistical significance was determined by Student’s t-test. H, qPCR assessment of gene expression in MOLM13 cells expressing a doxycycline-inducible STAT5B shRNA. Cells were treated with doxycycline (1 μg/mL) for 48 hours prior to the addition of GSK-2879552 (100 nM) for 24 hours. Expression was normalized to GUSB as an endogenous control. Statistical significance was determined by two-way ANOVA with a Holm-Šidák post-test correction. ns = not significant, * = p < 0.05, ** = p < 0.01, *** = p < 0.001, **** = p < 0.0001, TSS = transcription start site, TES = transcription end site.
Fig. 4:
Fig. 4:. FLT3-Inhibition represses MYC expression through a loss of STAT5 binding to the MYC blood super-enhancer cluster.
A, STAT5-bound regions from Fig. 2 ranked by ChIP-seq signal. B, H3K27ac CUT&Tag signal AUC at STAT5-bound BENC elements. H3K27ac signal data is from MOLM13 cells in Fig. 1 whereas the STAT5 signal data is from MOLM13 cells in Fig. 2. Statistical significance was determined by two-way ANOVA with a Holm-Šidák post-test correction. C, ATAC-seq was performed on MOLM13 cells quizartinib (1 nM), GSK-2879552 (100 nM), the combination, or an equal volume of DMSO for 24 hours. Representative histone modification and transcription factor tracks (from DMSO conditions in Fig. 2) shown at the extended MYC locus. D, ATAC signal AUC at all MYC BENC modules. Statistical significance was determined by two-way ANOVA with a Holm-Šidák post-test correction. E, ATAC, STAT5 ChIP-seq, and LSD1 ChIP-seq signal at twelve BENC modules. ns = not significant, * = p < 0.05, ** = p < 0.01, *** = p < 0.001, **** = p < 0.0001.
Fig. 5:
Fig. 5:. LSD1 inhibition disrupts GFI1 binding at the MYC BENC and induces a gain of H3K9me1 binding at MYC-bound promoters.
A, GFI1 CUT&RUN signal from Fig. 2 at five BENC modules. B, MOLM13 cells were transduced with lentiviral particles harboring a doxycycline-inducible non-targeting codon (NTC) or GFI1 shRNA knockdown vector. Quizartinib AUC of cells treated with doxycycline (1 μg/mL) or DMSO for 72 hours. Substantial knockdown was observed in the absence of doxycycline treatment, so only doxycycline-treated samples were compared. The quizartinib response curves are shown in Supplementary Fig. 7. Statistical significance was determined by Student’s t-test. C, qPCR assessment of gene expression in cells treated with doxycycline (1 μg/mL) for 48 hours prior to the addition of quizartinib (1 nM) for 24 hours. Expression was normalized to GUSB as an endogenous control. Statistical significance was determined by two-way ANOVA with a Holm-Šidák post-test correction. D, MOLM13 cells were transduced with lentiviral particles harboring a doxycycline-inducible SPI1 shRNA knockdown vector. Western blot for PU.1, which is encoded by SPI1, in cells treated with doxycycline (1 μg/ml) or an equivalent volume of DMSO for 48 hours. E, F, Cells were treated with doxycycline (1 μg/mL) or DMSO for 48 hours and then plated in an 8×8 matrix of quizartinib and GSK-2879552 for 72 hours prior to viability assessment. AUC data from the 311 nM GSK-2979552 isoline (the concentration corresponding to maximal synergy in the SPI1 knockdown MOLM13 cells) is shown. Dose responses and synergy over the entire drug matrix is shown in Supplementary Fig. 9. Statistical significance was determined by two-way ANOVA with a Holm-Šidák post-test correction. G-I, MOLM13 cells were treated with quizartinib (1 nM), GSK-2879552 (100 nM), or the combination for 6 hours prior to CUT&Tag for H3K9me1. Normalized signal for H3K9me1 at LSD1-bound regions, LSD1 and MYC co-bound regions, and at regions bound by LSD1 but not MYC. J, Schematic describing the drug combination mechanism. ns = not significant, * = p < 0.05, ** = p < 0.01, *** = p < 0.001, **** = p < 0.0001.
Fig. 6:
Fig. 6:. Combined FLT3/LSD1 inhibition drives synergistic cell death by repressing a MYC-dependent transcriptional network in primary AML blasts.
A, Primary AML blasts from 72 total samples (18 FLT3-ITD-positive) were cultured for 72 hours along a 7-point curve with either quizartinib, GSK-2879552, or equimolar amounts of the drug combination. Cell viability was assessed by CellTiter Aqueous colorimetric assay. Excess over Bliss was calculated using cell viability at corresponding drug concentrations. Each bar represents the mean excess over Bliss across all concentrations. Bar color indicates FLT3 mutation status. B, Dose response curves for quizartinib, GSK-2879552, and the drug combination in a FLT3-ITD-positive AML sample from (A). C, Spearman’s correlation of excess over Bliss and predicted transcription factor activity. Transcription factors were ranked by goodness of fit (R2). D, Primary blasts from a FLT3-ITD-positive AML sample were treated in triplicate with an 8×8 dose matrix of quizartinib and GSK-2879552 for 72 hours prior to viability assessment by CellTiter Aqueous colorimetric assay. ZIP synergy scores were calculated on the average values for each drug dose. E, AUC data from the 628 nM GSK-2979552 isoline (the concentration corresponding to maximal synergy in (D)) is shown. Statistical significance was determined by Student’s t-test. F, Bulk RNA-seq was performed on six FLT3-ITD-positive patient samples treated in triplicate with 500 nM quizartinib, 500 nM GSK-2879552, both drugs in combination, or an equivalent volume of DMSO for 24 hours. MYC transcription factor activity was inferred from RNA-seq. Statistical significance was determined by two-way ANOVA with a Holm-Šidák post-test correction. G, Unsupervised hierarchical clustering of differentially expressed genes following drug treatment. H, Transcription factor target enrichment from clusters in (G). I, J, GSEA was performed comparing the drug combination to DMSO. ns = not significant, * = p < 0.05, ** = p < 0.01, *** = p < 0.001, **** = p < 0.0001.
Fig. 7:
Fig. 7:. Dual FLT3/LSD1 inhibition results in a shift from a MYC super-enhancer-high to a MYC super-enhancer-low cell state in primary AML blasts.
A-C, Single cell ATAC-seq was performed on three AML patient samples following treatment with quizartinib (500 nM) and GSK-2879552 (500 nM) or an equivalent volume of DMSO for 24 hours. UMAP of DMSO-treated and drug-treated cells colored by cluster. D-F, Percent of cells assigned to each cluster. Dynamic clusters were identified as the populations that shift between DMSO-treated and drug-treated conditions. Dynamic clusters are highlighted with gray shading between bars. G-I, AUC of accessibility at each BENC module. J, Psuedo-bulked accessibility at the MYC BENC modules separated by treatment condition. K, Peak score fold change was calculated between peaks in DMSO-treated and combination-treated cells within dynamic clusters. Peaks are ranked by log2(peak score fold change).

References

    1. Tyner JW, Tognon CE, Bottomly D, Wilmot B, Kurtz SE, Savage SL, et al. Functional genomic landscape of acute myeloid leukaemia. Nature. 2018;562:526–31. - PMC - PubMed
    1. Kennedy VE, Smith CC. FLT3 Mutations in Acute Myeloid Leukemia: Key Concepts and Emerging Controversies. Front Oncol [Internet]. 2020. [cited 2021 May 7];10. Available from: 10.3389/fonc.2020.612880 - DOI - PMC - PubMed
    1. Herold T, Rothenberg-Thurley M, Grunwald VV, Janke H, Goerlich D, Sauerland MC, et al. Validation and refinement of the revised 2017 European LeukemiaNet genetic risk stratification of acute myeloid leukemia. Leukemia [Internet]. Nature Publishing Group; 2020. [cited 2022 Apr 21];34:3161–72. Available from: https://www.nature.com/articles/s41375-020-0806-0 - PMC - PubMed
    1. Stone RM, Mandrekar SJ, Sanford BL, Laumann K, Geyer S, Bloomfield CD, et al. Midostaurin plus Chemotherapy for Acute Myeloid Leukemia with a FLT3 Mutation. New England Journal of Medicine. Massachusetts Medical Society; 2017;377:454–64. - PMC - PubMed
    1. Perl AE, Martinelli G, Cortes JE, Neubauer A, Berman E, Paolini S, et al. Gilteritinib or Chemotherapy for Relapsed or Refractory FLT3-Mutated AML. New England Journal of Medicine. Massachusetts Medical Society; 2019;381:1728–40. - PubMed

Publication types

MeSH terms