. 2023 May 8;8(9):e163864.
doi: 10.1172/jci.insight.163864.

Loss of Dnmt3a impairs hematopoietic homeostasis and myeloid cell skewing via the PI3Kinase pathway

Affiliations

Loss of Dnmt3a impairs hematopoietic homeostasis and myeloid cell skewing via the PI3Kinase pathway

Lakshmi Reddy Palam et al. JCI Insight. .

Abstract

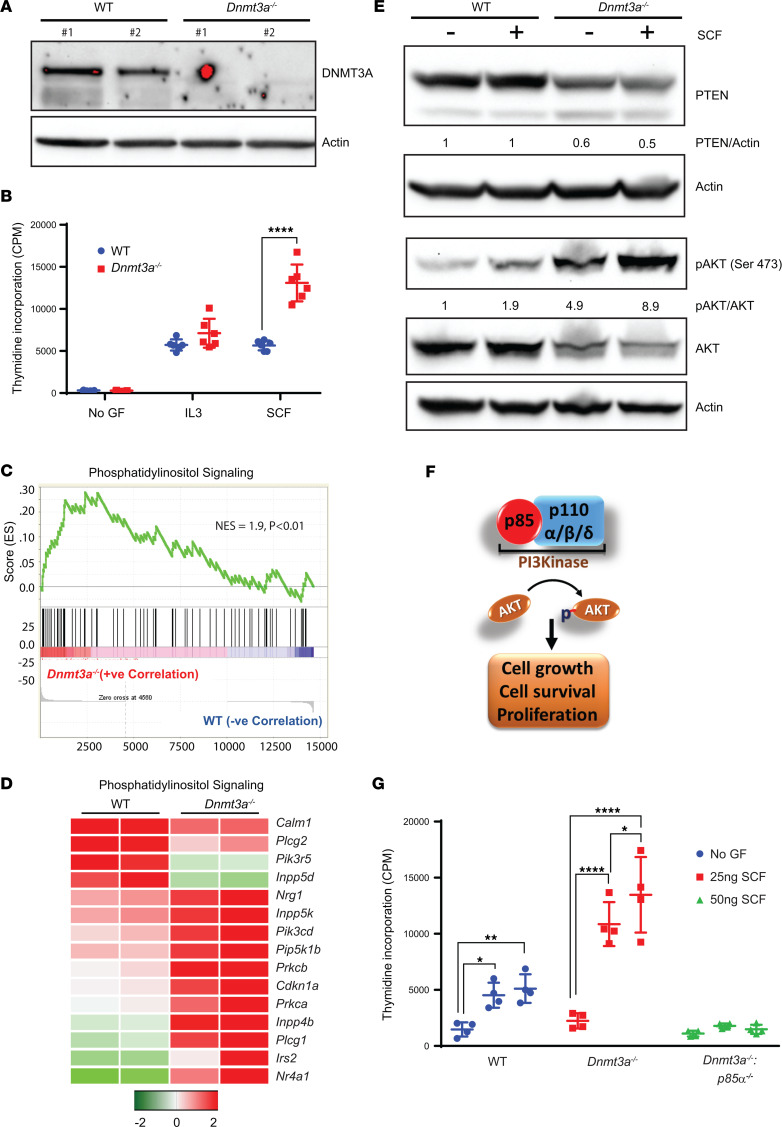
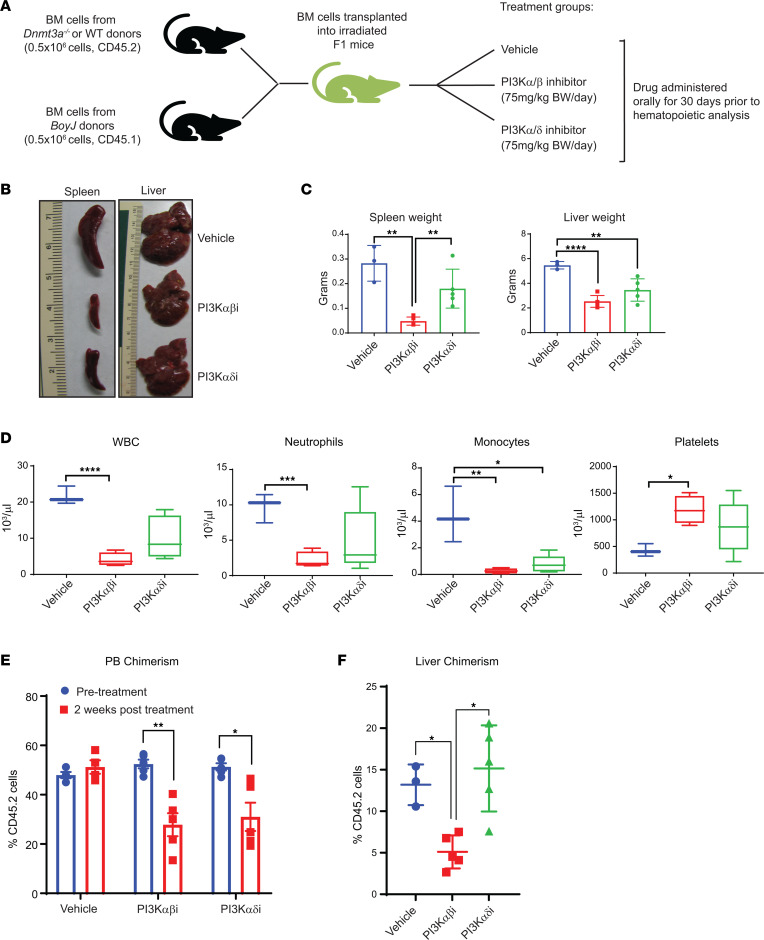
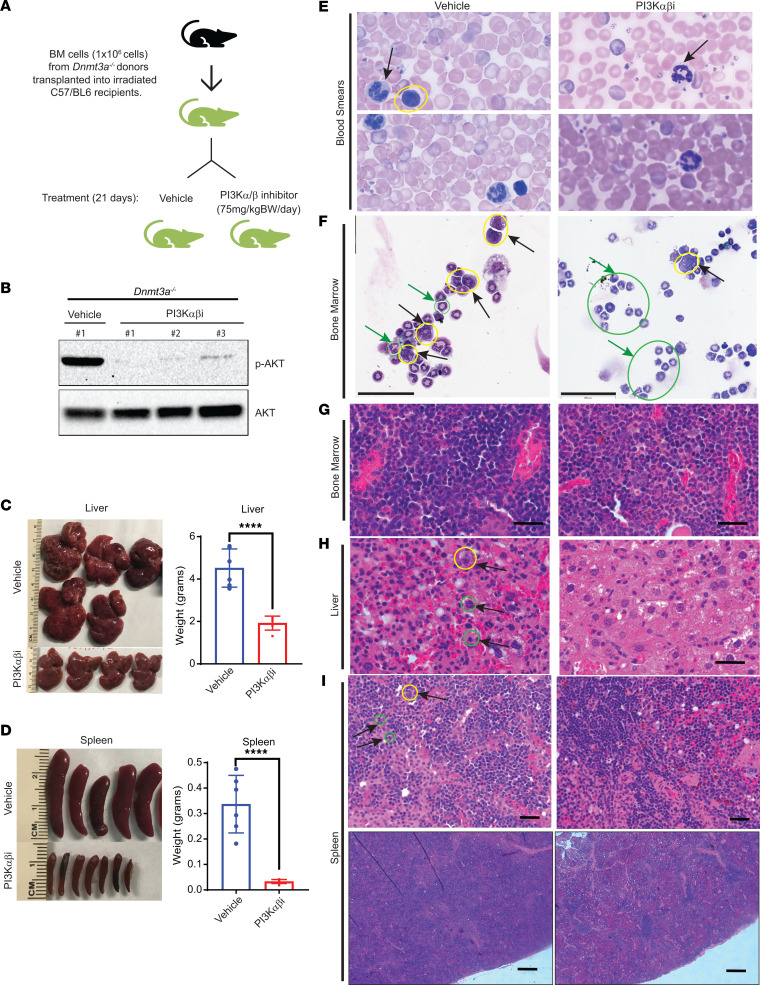
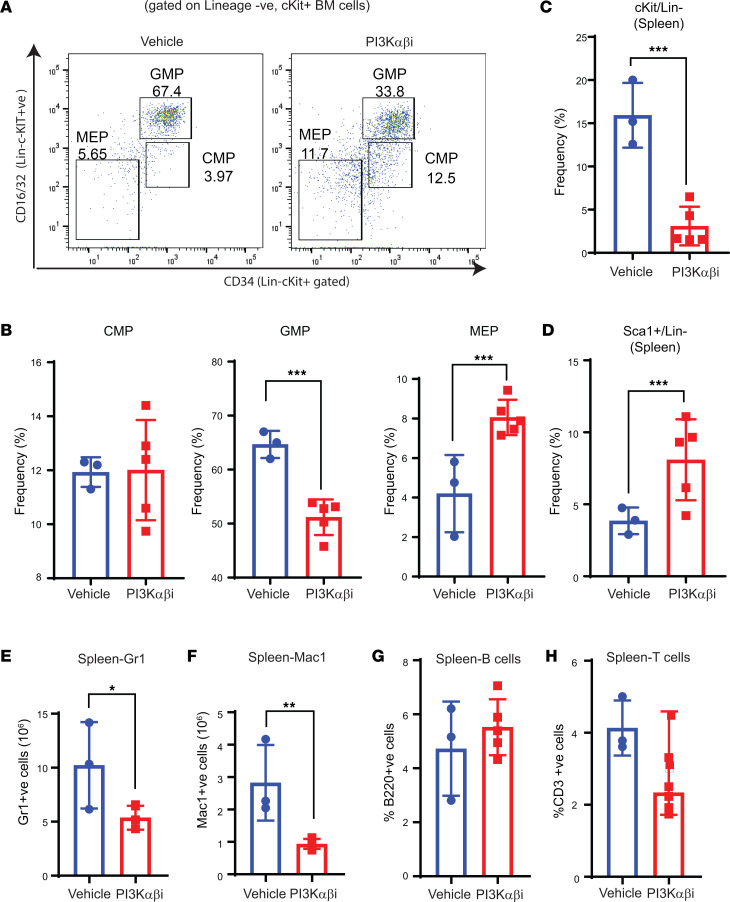
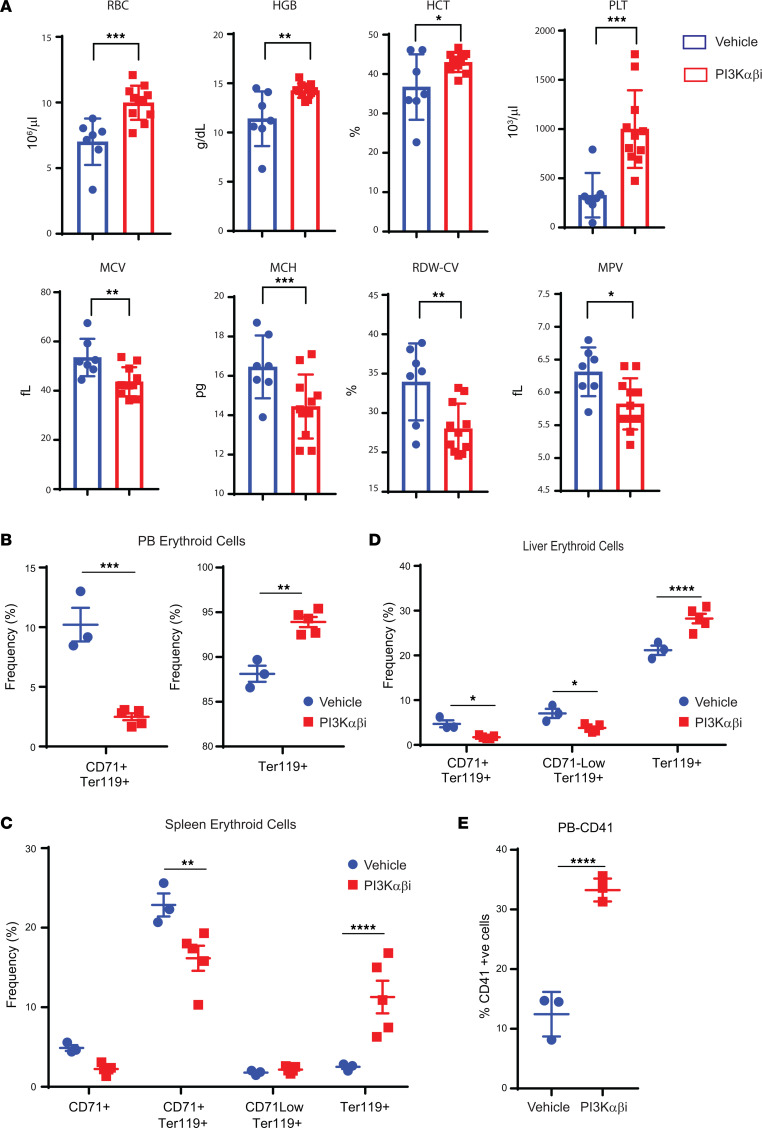
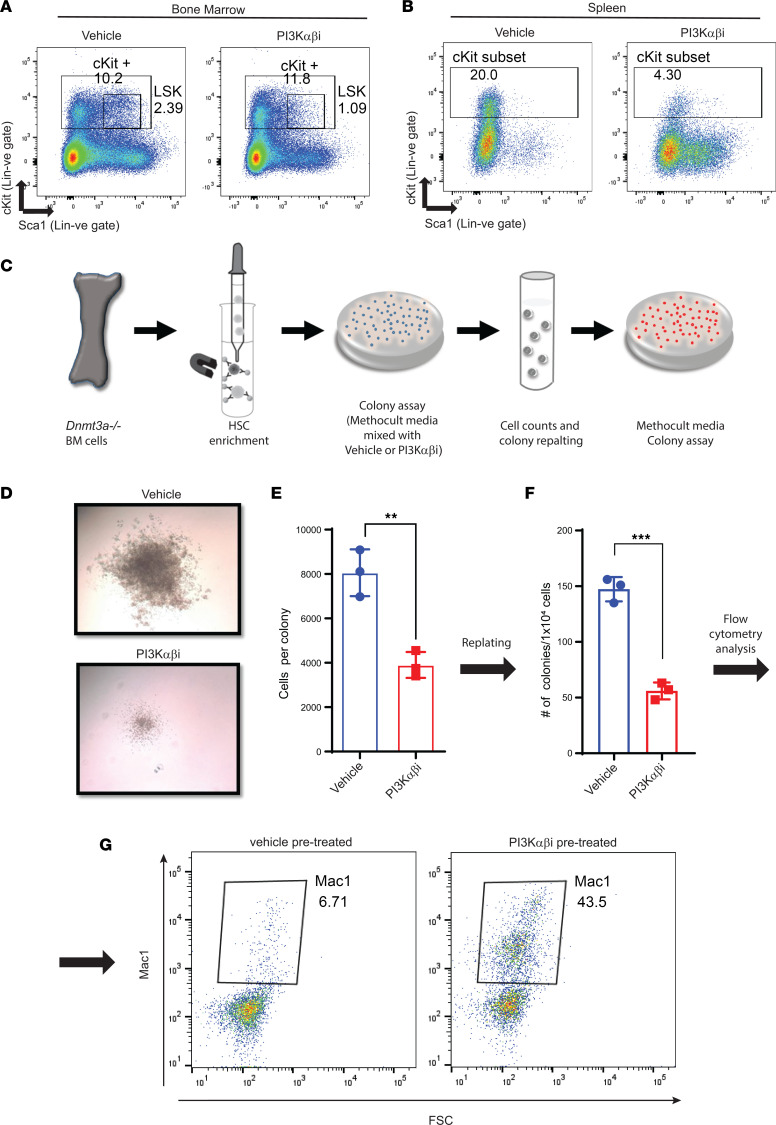
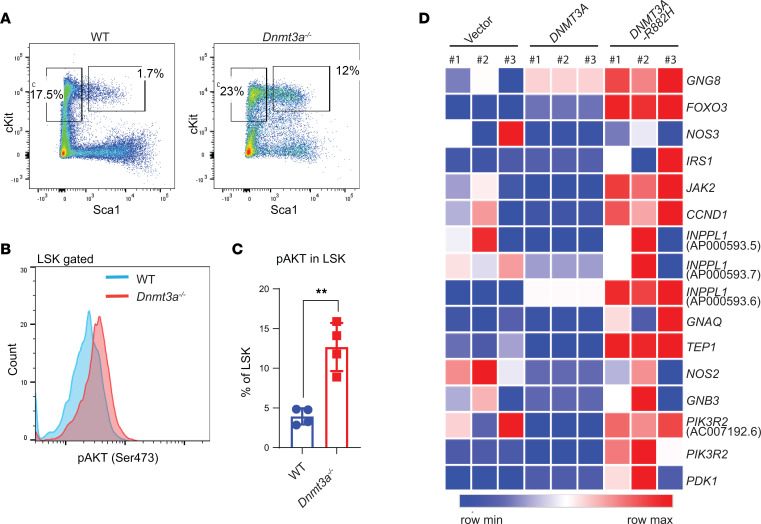
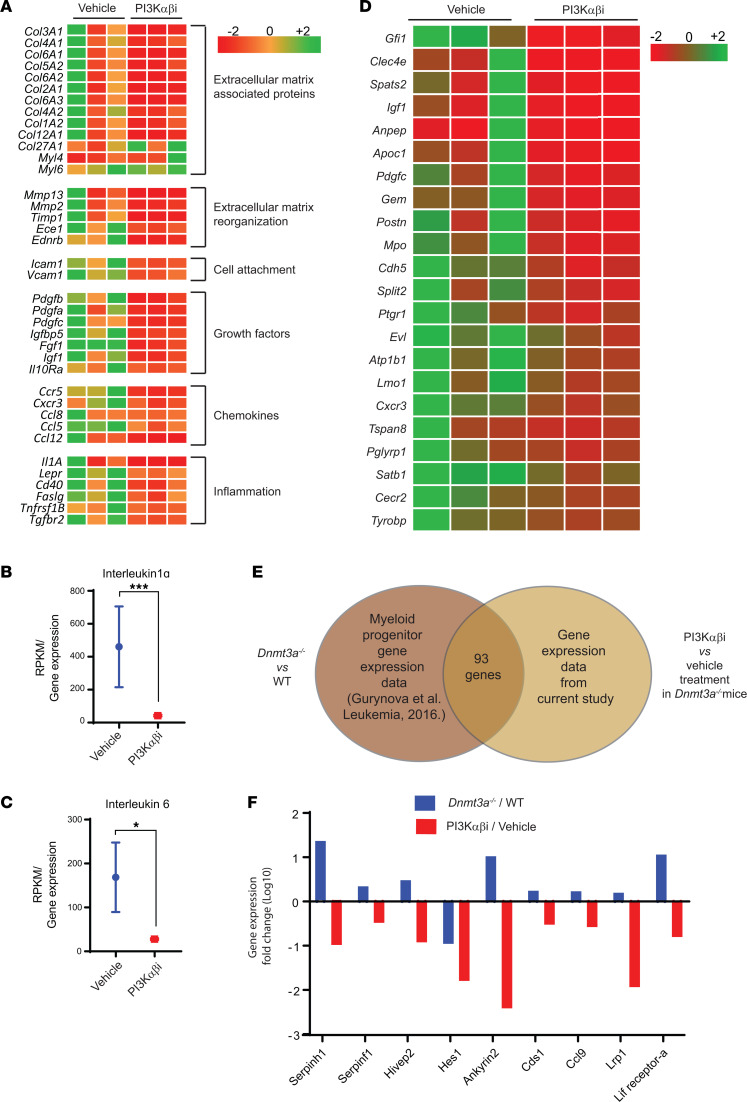
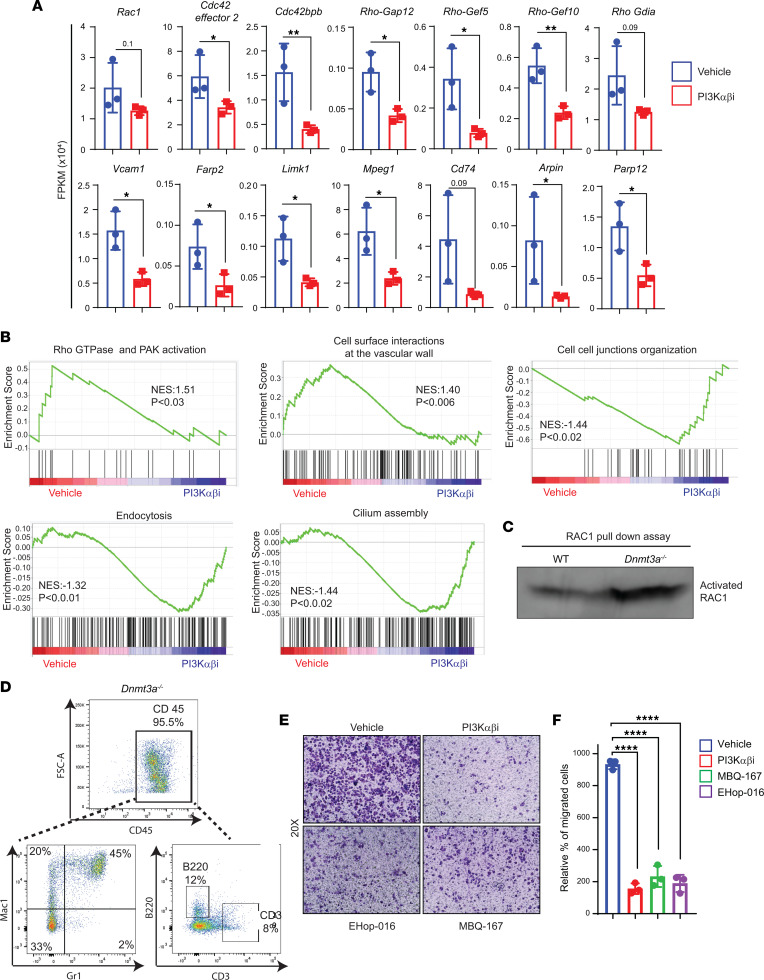
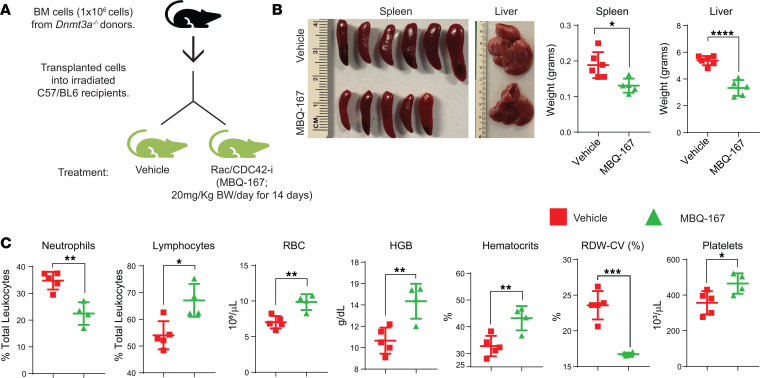
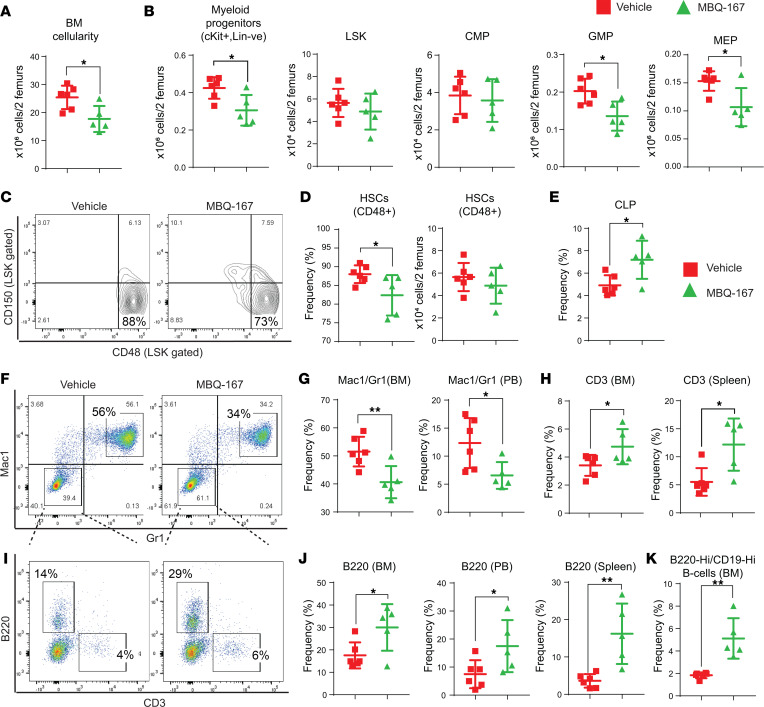
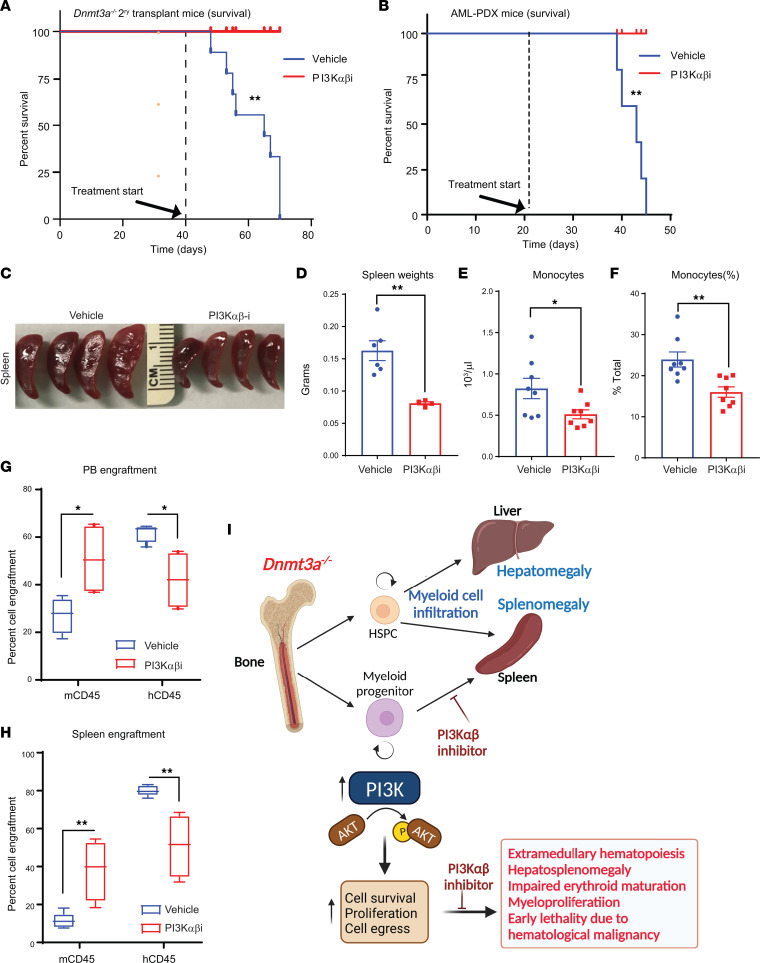
Loss-of-function mutations in the DNA methyltransferase 3A (DNMT3A) are seen in a large number of patients with acute myeloid leukemia (AML) with normal cytogenetics and are frequently associated with poor prognosis. DNMT3A mutations are an early preleukemic event, which - when combined with other genetic lesions - result in full-blown leukemia. Here, we show that loss of Dnmt3a in hematopoietic stem and progenitor cells (HSC/Ps) results in myeloproliferation, which is associated with hyperactivation of the phosphatidylinositol 3-kinase (PI3K) pathway. PI3Kα/β or the PI3Kα/δ inhibitor treatment partially corrects myeloproliferation, although the partial rescue is more efficient in response to the PI3Kα/β inhibitor treatment. In vivo RNA-Seq analysis on drug-treated Dnmt3a-/- HSC/Ps showed a reduction in the expression of genes associated with chemokines, inflammation, cell attachment, and extracellular matrix compared with controls. Remarkably, drug-treated leukemic mice showed a reversal in the enhanced fetal liver HSC-like gene signature observed in vehicle-treated Dnmt3a-/- LSK cells as well as a reduction in the expression of genes involved in regulating actin cytoskeleton-based functions, including the RHO/RAC GTPases. In a human PDX model bearing DNMT3A mutant AML, PI3Kα/β inhibitor treatment prolonged their survival and rescued the leukemic burden. Our results identify a potentially new target for treating DNMT3A mutation-driven myeloid malignancies.

Keywords: Hematology; Hematopoietic stem cells; Leukemias.


Conflict of interest statement

Conflict of interest: The authors have declared that no conflict of interest exists.

Figures

Figure 1
Figure 1. Loss of Dnmt3a in BMNC results in increased cell proliferation via the PI3K pathway.
(A) WT and Dnmt3afl/fl:Mx-Cre mice were administered poly I:C at 12–16 weeks of age, and BMNCs were subjected to Western blot analysis to detect the presence of DNMT3a protein. Two independent WT and Dnmt3a–/– mouse–derived BMNCs were utilized for these experiments. (B) BMNCs from WT or Dnmt3a–/– mice were cultured in media supplemented with SCF (50 ng/mL) or IL-3 (10 ng/mL) or no growth factor for 48 hours. Cell proliferation was evaluated by [3H] thymidine incorporation. Counts per minute (CPM) are shown. Three independent experiments, n = 6, mean ± SD, ****P < 0.00005. BM cells collected from WT or Dnmt3a–/– mice were subjected to RNA isolation and, subsequently, next-generation sequencing. (C and D) GSEA revealed an enrichment for genes in the PI3K signaling pathway (C), and upregulation of specific genes in the PI3K pathway are shown in the heatmap (D). (E) BMNCs from WT or Dnmt3a–/– mice were starved of growth factors and stimulated with SCF, followed by Western blot analysis. (F) Class I PI3K complex is composed of p85 regulatory subunit and p110α, p110β, and p110δ catalytic subunits. Activated PI3K signaling regulates AKT phosphorylation, which in turn promotes cell grow, cell survival, and proliferation. (G) WT, Dnmt3afl/fl:Mx-Cre, and Dnmt3afl/fl:p85αfl/fl:Mx-Cre mice were administered poly I:C at 12–16 weeks of age. BMNCs were collected from 3 different mice of each genotype and stimulated with SCF (25 ng/mL or 50 ng/mL) or in the absence of growth factors for 48 hours. Cell proliferation was evaluated by [3H] thymidine incorporation. Counts per minute (CPM) are shown. Experiment performed 3 times, and representative experiment shown with n = 4, mean ± SD, *P < 0.05, **P < 0.005, ****P < 0.00005. Two-way ANOVA, Tukey’s multiple-comparison test (B and C).
Figure 2
Figure 2. PI3K αβ inhibition modulates Dnmt3a loss–induced myeloid leukemia development.
(A) Donor cells from Dnmt3a–/– mice were mixed with BoyJ cells in 1:1 ratio (0.5 × 10⁶ versus 0.5 × 10⁶) for a competitive transplantation assay. Six weeks after transplantation, mice were treated with vehicle or the PI3K αβ inhibitor (Bay1082439; 7 mg/kg body weight) or PI3K αδ inhibitor (GDC-0941; 75 mg/kg body weight) for 30 days, and mice were analyzed. (B) Representative images of liver and spleen from vehicle- and drug-treated mice are shown. (C) Quantitative assessment of spleen and liver weights from the indicated groups. n = 3–5, mean ± SD, **P < 0.005, ****P < 0.00005. (D) PB counts from mice described in B and C before they were sacrificed. n = 3–5, *P < 0.05, **P < 0.005, ***P < 0.0005, ****P < 0.00005. The boxes shown with lower and upper quartiles separated by the median (horizontal line), and the whiskers extend to the minimum and maximum values. (E and F) Mice described in A were analyzed for PB chimerism 2 weeks after drug treatment and after 30 days after drug treatment for liver chimerism. Chimerism was assessed by staining the cells using an anti-CD45.2 antibody and flow cytometry. n = 3–5, mean ± SEM, *P < 0.05, **P < 0.005. One-way ANOVA in C, D, and F; 2-way ANOVA in E with Tukey’s multiple comparison test performed.
Figure 3
Figure 3. PI3K αβ inhibition rescues tissue myeloid cell infiltration as well as hepatosplenomegaly due to loss of Dnmt3a in HSC/Ps.
(A) BM cells from Dnmt3a–/– mice were transplanted into lethally irradiated C57BL/6 mice, and 6 weeks after transplantation, mice were treated with vehicle or the PI3K αβ inhibitor (Bay1082439; 75 mg/kg body weight) for 21 days. (B) BM bearing Dnmt3a–/– cells from mice treated with vehicle or the PI3K αβ inhibitor were subjected to Western blot analysis to analyze pAKT and total AKT protein levels. Numbers at the top represent the number of mice used for these experiments. (C and D) Images of spleens and livers from vehicle- and drug-treated mice and respective quantitative assessment of liver and spleen weights from vehicle- or drug-treated mice. n = 5–6, mean ± SEM, unpaired t test (2-tailed), ****P < 0.00005. (E and F) Peripheral blood smears and BM cytospin preparations showing reduced dysplasia of myeloid and erythroid lineage cells in PI3K αβ inhibitor–treated mice compared with vehicle group. Arrows in blood smears indicate segmented neutrophils. Yellow circle indicates myeloblasts, and green circles/green arrows indicate metamyelocytes. PB smear images shown at 100× magnification (E). Scale bar: 60 μm (F). (G) Representative images for H&E-stained sections of BM. Scale bar: 50μm (H) H&E-stained liver sections showing increased sinusoidal spaces with reduced immature myeloid cell infiltration in in PI3Kαβ inhibitor treatment condition compared with vehicle treatment. Immature myeloid precursor Metamyelocytes (yellow circle) and proliferating myeloid cells (green circles) in vehicle-treated mice are indicated. Scale bar: 50 μm (I) H&E-stained spleen sections showing reduced immature myeloid cell infiltration in the PI3Kαβ inhibitor treatment condition compared with vehicle treatment. Yellow circle indicates dysplastic megakaryocyte. More proliferating myeloid cells in vehicle-treated mice (green circles indicate mitotic figures of myeloproliferation). Scale bar: 50 μm (upper panel), 1,000 μm (lower panel).
Figure 4
Figure 4. PI3K αβ inhibition decreases myeloid progenitors and improves megakaryocyte-erythrocyte progenitors in Dnmt3a–/– malignant mice.
(A and B) Flow cytometry analysis was performed on BM cells from mice transplanted with Dnmt3a–/– cells and treated with the PI3K αβ inhibitor. Representative dot plots and quantitative data showing the frequency of Lin/c-KIT+ myeloid progenitors: CMPs, GMPs, and MEPs. n = 3–5, mean ± SEM, ***P = 0.0005. (C and D) Spleen cells collected from vehicle- or PI3Kαβ inhibitor–treated mice as in A were subjected to flow cytometry analysis to detect Linc-KIT+Sca-1+ cells. Quantitative data showing reduced c-KIT+ (Lin) myeloid progenitor cells (C) and increased differentiated c-KIT spleen cells (D) in PI3K αβ inhibitor–treated group compared with controls. n = 3–5, mean ± SEM, ***P = 0.0005. (EH) Flow cytometry was performed on spleen cells from vehicle or PI3K αβ inhibitor–treated mice as in A. Quantitative data showing a reduction in myeloid cell burden in the spleen from drug treated Dnmt3a–/– mice compared with controls. n = 3–5, mean ± SEM, *P = 0.05, **P = 0.005, unpaired t test (2-tailed) performed (BH).
Figure 5
Figure 5. PI3K αβ inhibition improves erythroid cell maturation in mice bearing Dnmt3a–/– malignant cells.
(A) Peripheral red cell parameters in mice transplanted with Dnmt3a–/– BM cells treated with vehicle or the PI3K αβ inhibitor (Bay1082439) for 21 days. n = 7–11, mean ± SEM, *P = 0.05, **P = 0.005, ***P = 0.0005. (BD) Flow cytometry analysis was performed on PB (B), spleen (C), or liver cells (D) from mice transplanted with Dnmt3a–/– cells and treated with the PI3K αβ inhibitor as in A. Quantitative data showing CD71+Ter119+ immature erythroid cells, CD71loTer119+ immature erythroid cells, and Ter119+ mature erythroid cells in vehicle- and PI3K αβ inhibitor–treated mice. n = 3–5, mean ± SEM, *P = 0.05, **P = 0.005, ***P = 0.0005, ****P = 0.00005. (E) Quantitative data showing increased presence of mature platelets in the PB of drug-treated mice compared with controls. n = 3–5, mean ± SEM, ****P = 0.00005. Unpaired t test (2-tailed) was performed in A, B, and E. Two-way ANOVA (Sidak’s multiple comparison) was performed in D and E.
Figure 6
Figure 6. PI3K inhibition promotes cell differentiation in Dnmt3a-deleted hematopoietic stem cells.
(A and B) BM and spleen cells from mice transplanted with Dnmt3a–/– cells and treated with the PI3K αβ inhibitor were subjected to flow cytometry analysis to detect Linc-KIT+Sca-1+ cells. Representative dot plots showing Linc-KIT+Sca-1+ cells in BM (A) and spleen (B). (C) A schematic depicting our strategy to assess the impact of PI3K inhibitor on the ability of Dnmt3a–/– HSPCs to give rise to colonies in a methylcellulose-based assay in vitro. Briefly, HSPCs were enriched from the BM of Dnmt3a–/– mice and platted in a methylcellulose-based media, along with the PI3K inhibitor and cytokines (50 ng/mL rmSCF, 10 ng/mL rmIL-3, 10 ng/mL rhIL-6, 3 U/mL rhEPO, 10 ng/mL Flt-3, and 10 ng/mL thrombopoietin (TPO). Colonies were enumerated on day 7, and cells were replatted in methylcellulose media along with growth factors and colonies were scored again after secondary platting. (D) Equal number of cells (10,000 cells) were plated in methocult media and cultured for 1 week in the presence of PI3Kαβ inhibitor (250 nM) or vehicle. Representative colony images depicting reduced colony size under conditions of PI3K αβ inhibitor treatment compared with vehicle conditions. Experiment was performed in triplicate. Number of colonies and total number of cells per plate were quantified. (E) Quantitative data show average number of cells per colony in drug and vehicle treatment groups. n = 3, mean ± SD, **P = 0.005. (F) Quantitative data showing number of colonies after replatting cells derived from the vehicle- and drug-treated groups. n = 3, mean ± SD, ***P = 0.0005. (G) Flow cytometry analysis of secondary replatted colonies using an antibody against Mac1. Dot plots show the level of Mac1 expression in drug-treated versus vehicle-treated groups. Experiment was performed in triplicate. Unpaired t test (2-tailed) was performed in E and F.
Figure 7
Figure 7. Increased PI3K signaling in Dnmt3a-deleted hematopoietic LSK cells and DNMT3A-mutated hCD34+ HSPCs.
(A) Flow cytometry analysis performed on BM cells collected from malignant Dnmt3a–/– and age-matched WT mice. Representative plots for LinSca-1+cKit+ cells from the indicated genotypes are shown. (B) Histogram showing intracellular activation of Akt (Ser473) in LSK cells from indicated genotypes. (C) Quantitative data showing percent phospho-AKT+ LSKs relative to IgG controls. n = 4, mean ± SEM, unpaired t test (2-tailed), **P = 0.005. (D) CB CD34+ HSC/Ps were transduced with empty vector, DNMT3a-GFP, or DNMT3aR882H-GFP, and sorted GFP+ cells were subjected to RNA-Seq. Heatmap showing PI3K pathway related gene expression.
Figure 8
Figure 8. PI3K inhibition reverts Dnmt3a loss–induced changes in the expression of genes involved in cell migration and inflammation and alters the expression of fetal liver HSC genes.
BM cells were collected from vehicle or PI3K αβ inhibitor–treated mice bearing Dnmt3a–/– malignant cells. RNA was isolated and subjected to next-generation sequencing, and gene expression analysis was performed. (A) Heatmap showing that PI3K αβ inhibitor treatment reduces the expression of genes involved in cell motility, cell attachment, inflammatory cytokines, and chemokines. (B and C) Quantitative assessment of the level of expression of IL-1α and IL-6 in drug-treated mice versus controls. n = 3, mean ± SEM, EdgeR DE analysis, *P = 0.05, ***P = 0.0005. (D) Heatmap showing gene expression involved in the development of fetal liver HSCs downregulated as a result of PI3K αβ inhibitor treatment in the Dnmt3a–/– cells versus controls. (E and F) Analysis of GMP progenitor gene expression data from a study involving Dnmt3a–/– and WT mice (13) was compared with the BM-derived gene expression data in the current study from vehicle- and PI3K αβ inhibitor–treated mice bearing Dnmt3a–/– cells. Venn diagram shows that 93 genes were found to be differentially regulated in both data sets. Comparative assessment of gene expression fold changes of indicated genes (F) in Dnmt3a–/–/WT and PI3Kαβ/vehicle treatment groups.
Figure 9
Figure 9. PI3K signaling promotes Dnmt3a loss–induced cell migration via RAC1 GTPase.
(A) Quantitative assessment of the level of expression of genes that belong to the RAC1/CDC42 pathway that are significantly reduced in PI3K drug–treated group compared with vehicle group. n = 3, mean ± SD, unpaired t test (2-tailed), *P = 0.05, **P = 0.005. (B) Gene set enrichment plots showing reduced RHO GTPase and PAK signaling associated with RAC1 pathway and altered biological processes in PI3K αβ inhibitor–treated Dnmt3a–/– BM cells compared with vehicle-treated group. (C) BM cells collected from WT or Dnmt3a–/– mice were subjected to activated RAC1 pulldown assay using PAK binding domain beads. Western blot analysis was performed to detect activated RAC1 using an anti-RAC1 specific antibody. Representative of 3 independent experiments shown. (D) Liver tissues harvested from hepatomegaly presenting malignant Dnmt3a–/– mice were subjected to CD45+ cell enrichment using magnetic cell separation, and percent CD45 enrichment was assessed using flow cytometry. Figure shows the percent of Mac1+, Gr1+, B220+, and CD3+ cells within the CD45+ enriched fraction of Dnmt3a–/– cells. (E and F) CD45+ cells (2.5 × 10⁵) enriched from Dnmt3a–/– mice livers as in D were subjected to transwell migration assay for 20 hours at 37°C in the presence or absence of 100 nM PI3K αβ inhibitor (Bay1082439), 0.5 μM RAC1/3 inhibitor (EHop-016), or 200 nM RAC/CDC42 inhibitor (MBQ-167). Migrated cells were stained with 0.1% crystal violet, and representative images (20× magnification) for treatments are shown. Quantitation of percent migrated cells is shown in F. n = 3, mean ± SD, 1-way ANOVA (Tukey’s multiple comparison test), ****P < 0.00001.
Figure 10
Figure 10. RAC/CDC42 pathway inhibition partially rescues hepatosplenomegaly and decreases Dnmt3a loss–induced myeloid malignancy characteristics in mice.
(A) BM cells from Dnmt3a–/– mice were transplanted into lethally irradiated C57BL/6 mice, and 6 weeks after transplantation, mice were treated with vehicle or the RAC/CDC42 inhibitor (MBQ-167; 20 mg/kg body weight/day) for 14 days. (B) Images of spleens and livers from the vehicle- and drug-treated mice. Quantitative assessment of liver and spleen weights from vehicle- or drug-treated mice. n = 5–6, mean ± SEM, *P < 0.05, ****P < 0.00005. (C) Peripheral red cell parameters in mice in A. n = 4–6, mean ± SEM, *P = 0.05, **P = 0.005, ***P = 0.0005, unpaired t test (2-tailed) performed (B and C).
Figure 11
Figure 11. RAC/CDC42 pathway inhibition decreases Dnmt3a loss–induced myeloid skewing and improves B cells and T cells in mice.
(A) BM cellularity quantitation for 2 femurs in each mouse from mice transplanted with Dnmt3a–/– cells and treated with the vehicle or MBQ-167. n = 5–6, mean ± SEM, *P = 0.05. (B) Flow cytometry analysis was performed on BM cells from mice transplanted with Dnmt3a–/– cells and treated with vehicle or MBQ-167. Quantitative data showing the absolute number of LincKit+ myeloid progenitors, LincKit+Sca-1+ (LSKs), CMPs, GMPs, and MEPs. n = 5–6, mean ± SEM, *P = 0.05. (C and D) Flow cytometry analysis was performed on BM cells from mice in A, and representative dot plots for CD150- and CD48-stained (LSK gated) HSCs as shown in F; quantitative data plotted for the frequency and absolute number of CD150CD48+ cells is shown in G. n = 5–6, mean ± SEM, *P = 0.05. (E) Representative data showing the frequency of CLPs in BM cells from mice transplanted with Dnmt3a–/– cells and treated with vehicle or MBQ-167. n = 5–6, mean ± SEM, *P = 0.05. Flow cytometry was performed on BM cells from vehicle- or MBQ-167–treated mice as in Figure 10A, and a representative dot plot for Mac1/Gr1 expression is shown in F and B220/CD3 cells in I. Quantitative data showing decreased Gr1+Mac1+ in BM and PB fractions (G); increased CD3+ T cells in BM and spleen fractions (H); increased B220+ B cells in BM, spleen, and in PB fractions (J); and increased B220hiCD19hi mature B cells in BM fractions (K) of drug-treated mice compared with controls. n = 5–6, mean ± SEM, *P = 0.05, **P = 0.005, unpaired t test (2-tailed) performed (B, D, E, G, H, J, and K).
Figure 12
Figure 12. PI3K inhibitor treatment of mice bearing human AML cells bearing DNMT3A mutation enhances their survival.
(A) Secondary recipients of Dnmt3a–/– BM cells were prepared for the survival study by injecting 2 × 10⁶ of Dnmt3a–/– cells from primary BM transplants of Dnmt3a–/– cells. Six weeks after transplantation, these mice were treated with the PI3K inhibitor (Bay1082439) for 21 days (75 mg/kg body weight). As seen in A, all mice belonging to the vehicle group succumbed by day 70 after transplant, whereas none of the drug-treated mice died within this time period. n = 9, log-rank (Mantel-Cox) test, P < 0.003. (B) Patient-derived AML cells (1 million) bearing DNMT3A mutation were transplanted into NSG-cyto mice to generate AML-PDX. Starting day 20 after transplant, these mice were treated with vehicle or PI3K αβ inhibitor for 21 days. As seen in B, all mice belonging to the vehicle group succumbed by day 45 after transplant, whereas none of the drug-treated mice died within this time period. n = 5, log-rank (Mantel-Cox) test, P < 0.001. (C) Images of spleens derived from drug- and vehicle-treated mice. (D) Quantitative analysis of spleen weights from vehicle- and drug-treated AML-PDX mice. n = 5, mean ± SEM, unpaired t test (2-tailed), P < 0.001. (E and F) Quantitative analysis of the number of monocytes in vehicle- versus drug-treated mice. n = 8, mean ± SEM, unpaired t test (2-tailed), *P = 0.05, **P = 0.005. (G and H) Quantitative assessment of percent engraftment of murine and human CD45 cells in the PB and spleen of vehicle- and drug-treated mice as assessed by flow cytometry. n = 5–8, 2-way ANOVA, *P = 0.05, **P = 0.005. The boxes shown with lower and upper quartiles separated by the median (horizontal line), and the whiskers extend to the minimum and maximum values. (I) Model illustrating the role of PI3K signaling in Dnmt3a loss–induced myeloid malignancy. PI3Kαβ specific inhibitor blocks the Dnmt3a loss–induced malignant characteristics and improves survival.

References

    1. Abdel-Wahab O, et al. DNMT3A mutational analysis in primary myelofibrosis, chronic myelomonocytic leukemia and advanced phases of myeloproliferative neoplasms. Leukemia. 2011;25(7):1219–1220. doi: 10.1038/leu.2011.82. - DOI - PMC - PubMed
    1. Stegelmann F, et al. DNMT3A mutations in myeloproliferative neoplasms. Leukemia. 2011;25(7):1217–1219. doi: 10.1038/leu.2011.77. - DOI - PubMed
    1. Walter MJ, et al. Recurrent DNMT3A mutations in patients with myelodysplastic syndromes. Leukemia. 2011;25(7):1153–1158. doi: 10.1038/leu.2011.44. - DOI - PMC - PubMed
    1. Ley TJ, et al. DNMT3A mutations in acute myeloid leukemia. N Engl J Med. 2010;363(25):2424–2433. doi: 10.1056/NEJMoa1005143. - DOI - PMC - PubMed
    1. Buscarlet M, et al. DNMT3A and TET2 dominate clonal hematopoiesis and demonstrate benign phenotypes and different genetic predispositions. Blood. 2017;130(6):753–762. doi: 10.1182/blood-2017-04-777029. - DOI - PubMed

Publication types

Substances