. 2023 Jun 1;133(11):e165934.
doi: 10.1172/JCI165934.

POLQ inhibition elicits an immune response in homologous recombination-deficient pancreatic adenocarcinoma via cGAS/STING signaling

Affiliations

POLQ inhibition elicits an immune response in homologous recombination-deficient pancreatic adenocarcinoma via cGAS/STING signaling

Grace Oh et al. J Clin Invest. .

Abstract

Pancreatic ductal adenocarcinoma (PDAC) is a highly lethal malignancy that harbors mutations in homologous recombination-repair (HR-repair) proteins in 20%-25% of cases. Defects in HR impart a specific vulnerability to poly ADP ribose polymerase inhibitors and platinum-containing chemotherapy in tumor cells. However, not all patients who receive these therapies respond, and many who initially respond ultimately develop resistance. Inactivation of the HR pathway is associated with the overexpression of polymerase theta (Polθ, or POLQ). This key enzyme regulates the microhomology-mediated end-joining (MMEJ) pathway of double-strand break (DSB) repair. Using human and murine HR-deficient PDAC models, we found that POLQ knockdown is synthetically lethal in combination with mutations in HR genes such as BRCA1 and BRCA2 and the DNA damage repair gene ATM. Further, POLQ knockdown enhances cytosolic micronuclei formation and activates signaling of cyclic GMP-AMP synthase-stimulator of interferon genes (cGAS-STING), leading to enhanced infiltration of activated CD8+ T cells in BRCA2-deficient PDAC tumors in vivo. Overall, POLQ, a key mediator in the MMEJ pathway, is critical for DSB repair in BRCA2-deficient PDAC. Its inhibition represents a synthetic lethal approach to blocking tumor growth while concurrently activating the cGAS-STING signaling pathway to enhance tumor immune infiltration, highlighting what we believe to be a new role for POLQ in the tumor immune environment.

Keywords: Cancer; Cell Biology; DNA repair; T cells.


Figures

Figure 1
Figure 1. POLQ expression is elevated in HR-deficient PDAC.
(A) Within the TCGA cohort, resected PDAC specimens with elevated HRD scores correlate with higher levels of POLQ expression. HRD, homologous recombination deficiency. (B) When the COMPASS cohort is subdivided by genome structure (13), genomically unstable PDAC tumors have the highest POLQ expression. Stb, stable; l-rea, locally rearranged; sct, scattered; uns, unstable. (C) In the TCGA cohort, patients with PDAC expressing higher levels of POLQ have poorer survival compared with patients with PDAC and lower POLQ levels (P = 0.028).
Figure 2
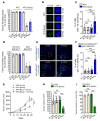
Figure 2. POLQ inhibition induces synthetic lethality in BRCA2-deficient PDAC.
(A) POLQ inhibition reduces colony formation in KPC-Brca2–/– cells but does not affect colony formation in KPC cells (n = 3). (B) Representative images of immunofluorescence staining for γH2AX (green) and DAPI (blue) in KPC and KPC-Brca2–/– cells, shCtrl and shPOLQ. Scale bar: 10 μm. (C) Quantification of cells with more than 10 γH2AX foci from B. Each point on the graph represents 1 visual field. (D) POLQ inhibition reduces colony formation in X337 cells (BRCA2Mut) but has minimal effect on colony formation in NYU 318 cells (BRCA2WT) (n = 3). (E) Representative images of immunofluorescence staining for γH2AX (green) and DAPI (blue) in NYU318 and X337 cells, shCtrl and shPOLQ. Scale bar: 50 μm. The white box indicates the nuclei shown in the magnified inset. (F) Quantification of cells with more than 10 γH2AX foci from E. (G) Growth curves of KPC and KPC-Brca2–/– tumors with shCtrl or shPolq (n = 10/group). (H) Tumor volume was measured by ultrasound in C57BL/6 mice orthotopically implanted with KPC and KPC-Brca2–/– shCtrl and shPOLQ cells (n = 10 mice/group). (I) Tumor volume from H as a percentage of the average tumor volume in the KPC shCtrl group (n = 10 mice/group). Data are representative of at least 3 independent experiments. *P < 0.05, **P < 0.01, ***P < 0.005. Error bars indicate the mean ± SEM.
Figure 3
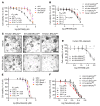
Figure 3. POLQi elicits synthetic lethality and synergizes with PARPi in HR-deficient PDAC cells.
(A) Dose-dependent viability assays of KPC, KPC-Brca2–/–, KPC-Brca1–/–, and KC-Atm–/– cells exposed to ART558 at the indicated concentrations. Cell viability was measured by CellTiter-Glo after 6 days of drug exposure. Data are displayed as cell viability relative to the control. (B) Dose-dependent viability assays of NYU318-BRCA2WT, X337-BRCA2Mut, NYU341-BRCA2Mut, X114-BRCA2Mut, and Capan1-BRCA2Mut cells exposed to ART558 at the indicated concentrations. Data are displayed as cell viability relative to the control. (C) Representative images of human PDAC NYU521-BRCA2WT, NYU341-BRCA2Mut, and NYU358-BRCA2Mut organoids treated with increasing concentrations of ART558 as indicated. Scale bar: 500 μm. (D) Dose-dependent viability assays of human PDAC organoids, NYU521-BRCA2WT, NYU341-BRCA2Mut, and NYU358-BRCA2Mut exposed to ART558 at the indicated concentrations. Data are displayed as cell viability relative to the control. (E) Dose-dependent viability assays of KPC, KPC-Brca2–/–, KPC-Brca1–/– and KC-Atm–/– cells exposed to Novobiocin (NVB) at the indicated concentrations after 6 days of drug exposure. Data are displayed as cell viability relative to the control. (F) Dose-dependent viability assays of NYU318-BRCA2WT, X337-BRCA2Mut, NYU 341-BRCA2Mut, X114-BRCA2Mut, and Capan1-BRCA2Mut cells exposed to NVB at the indicated concentrations. Data are representative of at least 3 independent experiments. *P < 0.05, **P < 0.01, ***P < 0.005. Error bars indicate the mean ± SEM.
Figure 4
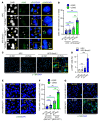
Figure 4. POLQ inhibition activates the cGAS-STING signaling pathway in BRCA2-deficient PDAC.
(A) Representative images of immunofluorescence staining for cGAS (green) and DAPI (blue) in KPC and KPC-Brca2–/– shCtrl and shPOLQ cells. Arrows indicate micronuclei. The scale bar in the third column, 10 μm, applies to the first 3 columns, DAPI, cGAS, and cGAS/DAPI. Column 4, cGAS/DAPI, is a magnified view of the yellow boxes in column 3. Column 4 scale bar: 5 μm. (B) Quantification of cells with cGAS+, cGAS, and total micronuclei from A. Each point on the graph represents 1 visual field. (C) Representative images of immunofluorescence staining for p-TBK (green) and DAPI (blue) in KPC and KPC-Brca2–/– shCtrl and shPOLQ cells. Insets indicate magnified views of staining patterns. Scale bar: 20 μm. (D) Quantification of cells that are p-TBK+ from C. (E) Representative image of immunofluorescence staining for cGAS (green) and DAPI (blue) in NYU318WT and X337-BRCA2Mut shCtrl and shPOLQ cells. Scale bar: 10 μm. White arrows indicate cGAS-negative micronuclei. Arrows indicated cGAS-positive micronuclei. Insets indicate magnified views of staining patterns. (F) Quantification of cells with micronuclei from E. (G) Representative images of immunofluorescence staining for p-TBK (green) and DAPI (blue) in NYU318-BRCA2WT and X337-BRCA2Mut shCtrl and shPOLQ cells. Scale bar: 20 μm. Data are representative of at least 3 independent experiments. *P < 0.05, **P < 0.01, ***P < 0.005. Error bars represent the mean ± SEM.
Figure 5
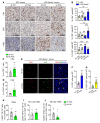
Figure 5. POLQ inhibition enhances immune infiltration in BRCA2-deficient PDAC.
(A) Representative images of KPC and KPC-Brca2–/– shCtrl and shPOLQ tumor sections stained for CD4+, CD8+ T cells, and F4/80+ cells by IHC. Scale bar: 50 μm. (B) Quantification of CD4+ (upper), CD8+ T cells (middle), and F4/80+ cells (lower) from A. Each point on the graph represents 1 mouse (n = 5 mice/group). HPF, high-power field. (C) CD4+ cells as a percentage of CD3+ T cells during flow cytometry of KPC-Brca2–/– tumors, shCtrl, and shPOLQ (n = 10 tumors). (D) CD8+ cells as a percentage of CD3+ T cells during flow cytometry of KPC-Brca2–/– tumors with shCtrl and shPOLQ (n = 10 tumors). (E) Representative images of coIF staining of CD8 (red), Granzyme B (GrB; green), and DAPI (blue) in KPC-Brca2–/– shCtrl and shPOLQ tumors. Scale bar: 20 μm. (F and G) Quantification of the percent of CD8+ cells (F) or percent of CD8+ and GrB+ double-positive cells (G) from E (n = 5 tumors). (H) CD11b+ cells as a percentage of CD45+ cells during flow cytometry of KPC-Brca2–/– tumors with shCtrl and shPOLQ (n = 10 tumors). (I) CD206 MHC II+ CD11b+ cells as a percentage of CD45+ cells during flow cytometry of KPC-Brca2–/– tumors with shCtrl, and shPOLQ (n = 10 tumors). (J) CD206+ MHC II CD11b+ cells as a percentage of CD45+ cells during flow cytometry of KPC-Brca2–/– tumors with shCtrl and shPOLQ (n = 10 tumors). Data are representative of at least 3 independent experiments. *P < 0.05, **P < 0.01, ***P < 0.005. Error bars indicate the mean ± SEM.
Figure 6
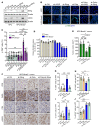
Figure 6. STING activation is essential for the POLQ inhibition–induced antitumor effect in BRCA2-deficient PDAC.
(A) Western blots for cGAS and STING in KPC and KPC-Brca2–/– shCtrl with shCGAS, shSTING, shPOLQ, and shPOLQ + shSTING cells. (B) Representative images of immunofluorescence staining for p-TBK (green) and DAPI (blue) in KPC and KPC-Brca2–/– with shCtrl, shcGAS, shSTING, shPOLQ, shPOLQ + shcGAS, and shPOLQ + shSTING cells. Scale bar: 10 μm. (C) Quantification of cells that are p-TBK+ from B (n = 5). (D) KPC-Brca2–/– shPOLQ cells have reduced colony formation. Additional cGAS or STING knockdown has no further effects on colony formation in KPC-Brca2–/– cells. KPC colony formation is unaffected by shPOLQ, shcGAS, or shSTING (n = 3). (E) Tumor volume was measured by ultrasound in C57BL/6 mice orthotopically implanted with KPC-Brca2–/– shCtrl, shSTING, shPOLQ, and shPOLQ + shSTING tumor cells (n = 6 mice/group). (F) Representative images of KPC-Brca2–/– shCtrl, shSTING, shPOLQ, and shPOLQ + shSTING tumors stained for CD8+, F4/80+ cells, and CD4+ T cells and γH2AX+ cells by IHC. Scale bars in rows 1, 2, and 3: 50 μm. Scale bar in row 4: 20 μm. (GJ) Quantification of CD8+ (G), F4/80+ cells (H), CD4+ T cells (I), and γ–H2AX+ cells (J) from F. HPF, high-power field. Data are representative of at least 3 independent experiments. *P < 0.05, **P < 0.01, ***P < 0.005. Error bars indicate the mean ± SEM.

Comment in

References

    1. Bailey P, et al. Genomic analyses identify molecular subtypes of pancreatic cancer. Nature. 2016;531(7592):47–52. doi: 10.1038/nature16965. - DOI - PubMed
    1. Golan T, Javle M. DNA repair dysfunction in pancreatic cancer: a clinically relevant subtype for drug development. J Natl Compr Canc Netw. 2017;15(8):1063–9. doi: 10.6004/jnccn.2017.0133. - DOI - PubMed
    1. Pishvaian MJ, et al. Overall survival in patients with pancreatic cancer receiving matched therapies following molecular profiling: a retrospective analysis of the Know Your Tumor registry trial. Lancet Oncol. 2020;21(4):508–518. doi: 10.1016/S1470-2045(20)30074-7. - DOI - PMC - PubMed
    1. Golan T, et al. Maintenance Olaparib for Germline BRCA-Mutated Metastatic Pancreatic Cancer. N Engl J Med. 2019;381(4):317–327. doi: 10.1056/NEJMoa1903387. - DOI - PMC - PubMed
    1. Golan T, et al. Genomic Features and Classification of Homologous Recombination Deficient Pancreatic Ductal Adenocarcinoma. Gastroenterology. 2021;160(6):2119–2132.e9. doi: 10.1053/j.gastro.2021.01.220. - DOI - PubMed

Publication types

Substances