. 2023 Apr 4;120(14):e2218245120.
doi: 10.1073/pnas.2218245120. Epub 2023 Mar 28.

Pattern dynamics and stochasticity of the brain rhythms

Affiliations

Pattern dynamics and stochasticity of the brain rhythms

Clarissa Hoffman et al. Proc Natl Acad Sci U S A. .

Abstract

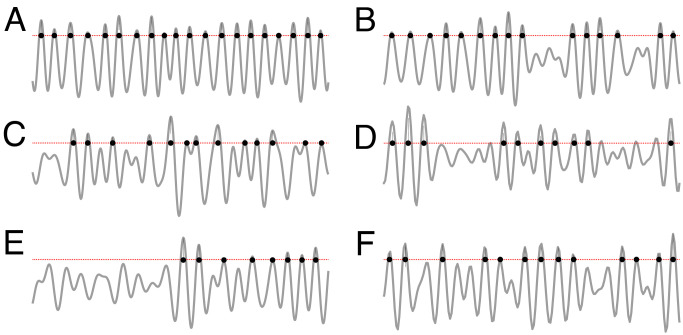
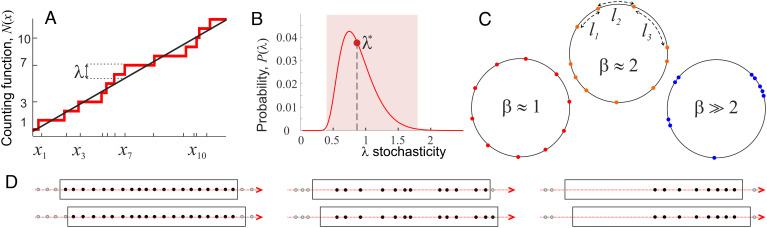
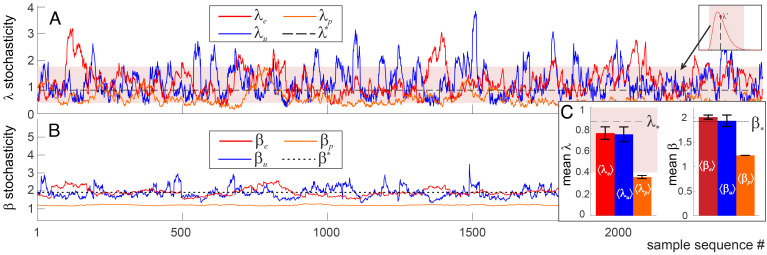
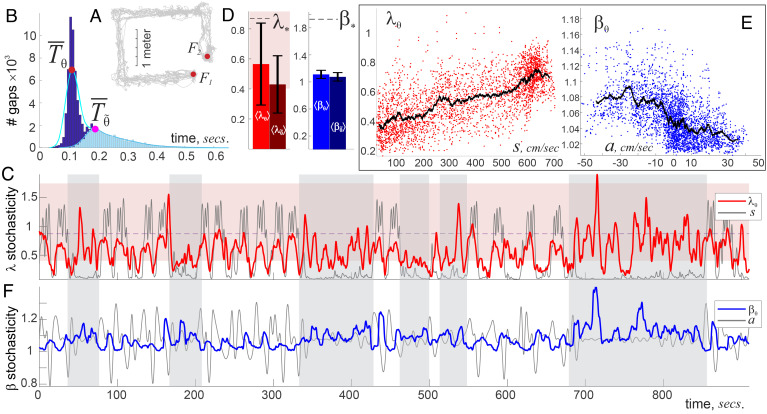
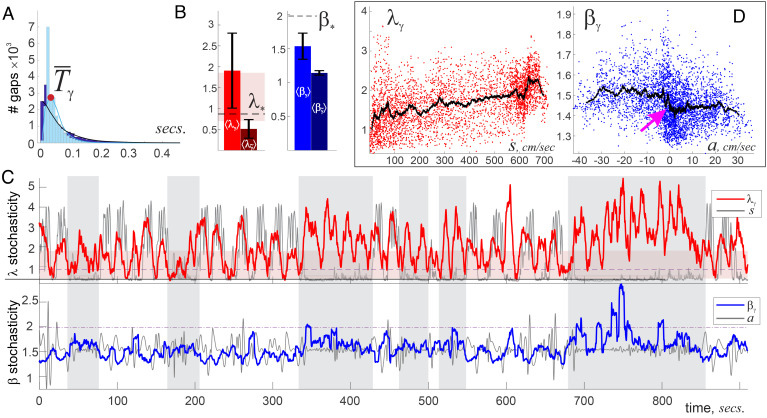
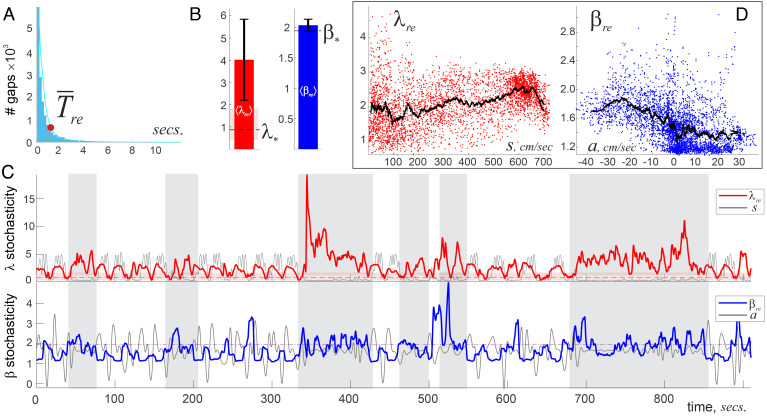
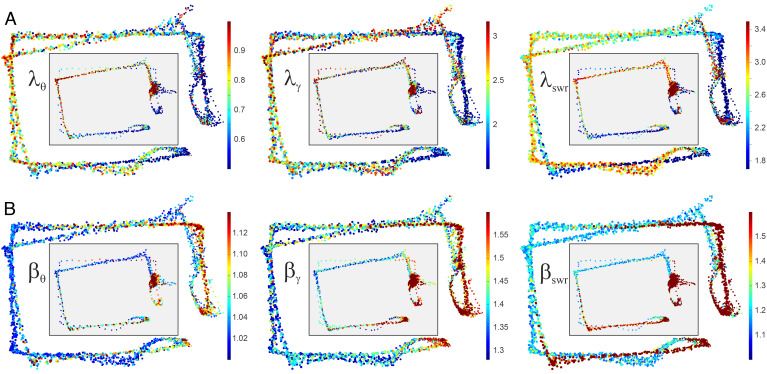
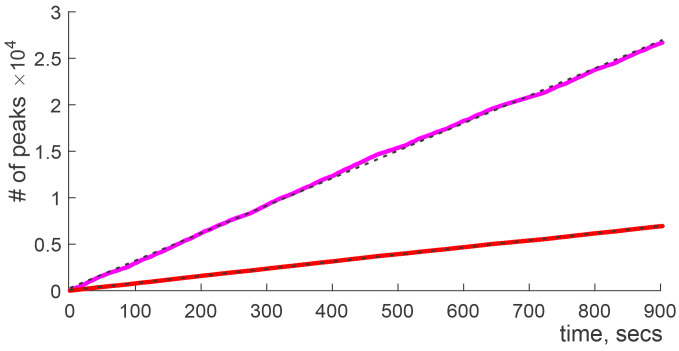
Our current understanding of brain rhythms is based on quantifying their instantaneous or time-averaged characteristics. What remains unexplored is the actual structure of the waves-their shapes and patterns over finite timescales. Here, we study brain wave patterning in different physiological contexts using two independent approaches: The first is based on quantifying stochasticity relative to the underlying mean behavior, and the second assesses "orderliness" of the waves' features. The corresponding measures capture the waves' characteristics and abnormal behaviors, such as atypical periodicity or excessive clustering, and demonstrate coupling between the patterns' dynamics and the animal's location, speed, and acceleration. Specifically, we studied patterns of θ, γ, and ripple waves recorded in mice hippocampi and observed speed-modulated changes of the wave's cadence, an antiphase relationship between orderliness and acceleration, as well as spatial selectiveness of patterns. Taken together, our results offer a complementary-mesoscale-perspective on brain wave structure, dynamics, and functionality.

Keywords: hippocampus; learning and memory; patterning; waveforms.


Conflict of interest statement

The authors declare no competing interest.

Figures

Fig. 1.
Fig. 1.
Waveform morphologies. (A and B) Waves exhibiting nearly periodic sequences of peaks are commonly found among θ-oscillations (4 to 12 Hz), but rarely among high frequency waves. The intermittent patterns shown on panels (C) or (D) may be exhibited by γ-waves (30 to 80 Hz), but for the θ-waves, they would be atypical. The temporal clustering shown on panels (D) and (E) are all in all ordinary for γ- or ripples (150 to 250 Hz) but too irregular for the θ-waves. F-pattern could potentially be a θ-wave, a γ-wave, or a ripple. Shown are the peaks exceeding 1/2 of standard deviation from the mean (dashed red line), to exclude the spurious low-amplitude peaks. In actuality, panels A and B are experimental θ-waveforms recorded from the mouse hippocampal CA1 (45, 46), panels C and D are the recorded γ-waves, and panels E and F show ripples.
Fig. 2.
Fig. 2.
Stochasticity parameters. (A) The elements of an ordered sequence X = {x1, x2, …, xn} following a linear trend N¯(x)=f¯x+b (solid black line). The sequence’s maximal deviation from the mean, λ(X), exhibits statistical universality and can hence impartially characterize the stochasticity of the individual data sequence X (Section 3). (B) The probability distribution of λ-scores is unimodal, with mean λ* ≈ 0.87 (red dot). About 99.7% of all sequences produce λ-scores in the interval 0.4 ≤ λ(X)≤1.8 (pink stripe); these sequences are typical and consistent with the underlying mean behavior. In contrast, sequences with smaller or larger λ-scores are statistically uncommon. (C) A sequence X arranged on a circle of length L produces a set of n arcs. The normalized quadratic sum of the arc lengths is small for orderly sequences, β ≈ 1 (Left), as high as βn for the “clustering” sequences (Right), and intermediate, β ≈ 2 (Middle), for generic sequences. (D) Top row: the “beads” of peaks illustrated on Fig. 1A, C, and E. The black boxes represent time windows with widths scaled proportionally to the periods of θ-waves, γ-waves and ripples. The gray dots represent the upcoming and the past peaks. Bottom row: time windows slide to the right (red arrows), causing pattern changes.
Fig. 3.
Fig. 3.
Pattern dynamics for three kinds of random sequences in which the intervals between consecutive points are distributed 1) exponentially with the rate ν = 2; 2) uniformly with constant density ρ = 1; or 3) with Poisson rate μ = 5. Sample intervals are selected proportionally to the distribution scales (Lu = 25ρ, Le = 25ν, and Lp = 25μ, so that each sample sequence contains about n = 25 elements) and are shifted by a single data point at a time. (A) The Kolmogorov parameter of the exponential sequence (red trace, λe), uniform sequence (blue trace, λu), and Poisson sequence (orange trace, λp) remains mostly within the “pink zone” of stochastic typicality (pink stripe is the same as on Fig. 2B, but stretched horizontally—note the illustration in the right corner). λu is the most volatile and often escapes the expected range, whereas λp is more compliant, lingering below the expected mean λpλ* ≈ 0.87 (black dashed line). (B) The corresponding Arnold stochasticity parameters show similar behavior: βu = 1.93 ± 0.2 fluctuates around the expected mean β*(25) = 1.92 (black dotted line). The exponential sequence has smaller β-variations and a slightly higher mean, βe = 2 ± 0.04. The Poisson sequence is the least stochastic (nearly periodic), with βp = 1.22 ± 0.004, due to statistical suppression of small and large gaps. (C) The mean stochasticity scores, ⟨λ⟩ and ⟨β⟩ computed for about 104 random patterns of each type. For sample patterns, (SI Appendix, Fig. 1A).
Fig. 4.
Fig. 4.
θ-wave’s stochasticity. (A) The animal’s lapses (trajectory shown by gray line) between food wells, F1 and F2, take on average 22 s. (B) A histogram of intervals between subsequent θ-peaks concentrates around the characteristic θ-period, T¯θ110 ms: gaps shorter than T¯θ/2 or wider than 2T¯θ are rare. θ-amplitude, θ~, oscillates with Tθ~180 ms period. (C) The dynamics of λθ(t) (red trace) correlate with the speed profile (gray line) when the mouse moves methodically. The λθ(t)-stochasticity remains mostly within the “typical” range (pink stripe in the background), falling below it as the mouse slows down. For rapid moves there is a clear similarity between the λθ-score and the speed, e.g., their peaks and troughs roughly match. When the mouse meanders (vertical gray stripes), the coupling between speed and λθ-stochasticity is lost. (D) Due to quasiperiodicity of the θ-wave and of its envelope, θ~, the average scores ⟨λθ⟩, λ~θ, ⟨βθ⟩, and β~θ are significantly lower than the impartial means λ* and β*, with small deviations (data for 5 mice). (E) Locally averaged λ^θ-score grows with speed, whereas β^θ tends to drop down with acceleration. (F) The Arnold score βθ(t) (blue trace) remains close to βmin = 1, affirming θ-wave’s quasiperiodicity. Note the antiphasic relationship between the βθ-stochasticity and the acceleration a(t) (the latter graph is shifted upward to match the mean level ⟨βθ⟩): θ-periodicity loosens as the animal slows down (βθ-splashes correlate with animal’s deceleration) and sharpens as he speeds up.
Fig. 5.
Fig. 5.
γ-wave stochasticity. (A) A histogram of γ-interpeak intervals exhibits an exponential-like distribution with mean characteristic γ-period, T¯γ=18.6±1.9 ms, about six times smaller than T¯θ. (B) The average scores ⟨βγ⟩ and ⟨λγ⟩ are higher than for the θ-wave, indicating that γ-patterns are more diverse than θ-patterns. (C) The dynamics of the λγ-score (Top panel) correlate with changes in the speed when the animal moves actively. Note that λγ often exceeds the upper bound of the “pink stripe,” i.e., γ-waves often produce statistically uncommon patterns, especially during rapid moves. The βγ-score (Bottom panel) correlates with the animal’s acceleration, which is lost when lap times increase (gray stripes). (D) Locally averaged λ-score, λ^γ, grows with speed, while β^γ switches from higher to lower value with increasing acceleration (pink arrow).
Fig. 6.
Fig. 6.
Ripple Events’ stochasticity. (A) A histogram of intervals between RE is nearly exponential. (B) The averages ⟨λre⟩ and ⟨βre⟩ are high, indicating both frequent deviation of RE from the mean and higher temporal clustering than for the θ- and γ-patterns. (C) The animal’s speed (gray line, Top panel) correlates with the Kolmogorov parameter λre during fast exploratory laps. During inactivity (vertical gray stripes), the λre-stochasticity uncouples from speed, exhibiting high spikes that mark strong “fibrillation” of RE patterns and may reflect awake replay activity. The antiphasic relationship between the animal’s acceleration a(t) (gray line, Bottom panel) and Arnold score βre(t) shows that RE tends to cluster when as the animal decelerates, while acceleration enforces periodicity. During slower moves (gray stripes), the relationship between speed, acceleration, and stochasticity is washed out and stochastically improbable patterns dominate. (D) Locally averaged λ^re grows with speed and β^re drops with acceleration.
Fig. 7.
Fig. 7.
Spatial stochasticity maps were obtained by plotting λ and β parameters along the trajectory. Note that the inbound and the outbound trajectories are slightly different, leading to two seemingly displaced tracks in each plot. (A) The λ-maps show that θ-wave, γ-wave, and RE generally follow the mean trend near the food wells (with scattered wisps of high stochasticity) and deviate from the mean over the areas most distant from the food wells. The smaller maps in the gray boxes represent slow lapses: the overall layout of high-λ and low-λ fields is same as during the fast moves, which suggests spatiality of λ-stochasticity. (B) The behavior of βθ is opposite: the “uneventful,” distant run segments attract nearly periodic behavior, while the food wells attract time-clumping wave patterns. Note that, at the food wells, the waves exhibit highly improbable (high-λ), disordered (high-β) patterns.
Fig. 8.
Fig. 8.
Counting functions for θ-peaks (Nθ, red) and γ-peaks (Nγ, magenta) evaluated for one entire running session, for one mouse. The black lines show the estimated (95% prediction interval) linear trends.
Fig. 9.
Fig. 9.
Averaging over a simplex. (A) If two coordinates l1 and l2 of a two-element sequence could independently vary between 0 and L, then the pair (l1, l2) would cover a 2D square. However, if the elements (x1, x2) remain on a circle (orange dots below) then the Eq. 8 restricts (l1, l2)-values to the cube’s diagonal (orange cross on the Top panel), i.e., to a 1-dimensional simplex. (B) A configuration of three points on a circle corresponds to a point on the diagonal section of a L-cube. (C) Tetrahedron—a section of a 4D cube—is the highest dimensional (3D) depictable simplex σ(3), which is used to schematically represent n-dimensional simplexes, σ(n). Averaging over li2 in [9] involves integrating over it the (n − 1)-dimensional layers of σ(n).
Fig. 10.
Fig. 10.
β-distributions. (A) Histograms of β-values obtained for 106 sequences containing n = 17, 25, 50, 125, and 250 elements peak in a vicinity of the impartial mean β* and rapidly decay for β ≲ 1.2 and β ≳ 3.5. (B) The distribution of β′=β − 1 for sequences containing about n = 25 points is close to the universal Kolmogorov distribution P(λ) (red line, Fig. 2A).

Similar articles

Cited by

References

    1. Buzsáki G., Rhythms in the Brain (Oxford University Press, New York, 2011).
    1. Skaggs W., McNaughton B., Wilson M., Barnes C., Theta phase precession in hippocampal neuronal populations and the compression of temporal sequences. Hippocampus 6, 149–172 (1996). - PubMed
    1. Bench K., et al. , Coherent theta oscillations and reorganization of spike timing in the hippocampal- prefrontal network upon learning. Neuron 66, 921–936 (2010). - PubMed
    1. Nikoli D., Fries P., Singer W., Gamma oscillations: Precise temporal coordination without a metronome. Trends Cogn. Sci. 17, 54–55 (2013). - PubMed
    1. Colgin L., et al. , Frequency of gamma oscillations routes flow of information in the hippocampus. Nature 462, 353–357 (2009). - PubMed

Publication types

LinkOut - more resources