. 2023 Apr 21;18(4):969-981.
doi: 10.1021/acschembio.3c00124. Epub 2023 Mar 28.

Target Class Profiling of Small-Molecule Methyltransferases

Affiliations

Target Class Profiling of Small-Molecule Methyltransferases

Quinlin M Hanson et al. ACS Chem Biol. .

Abstract

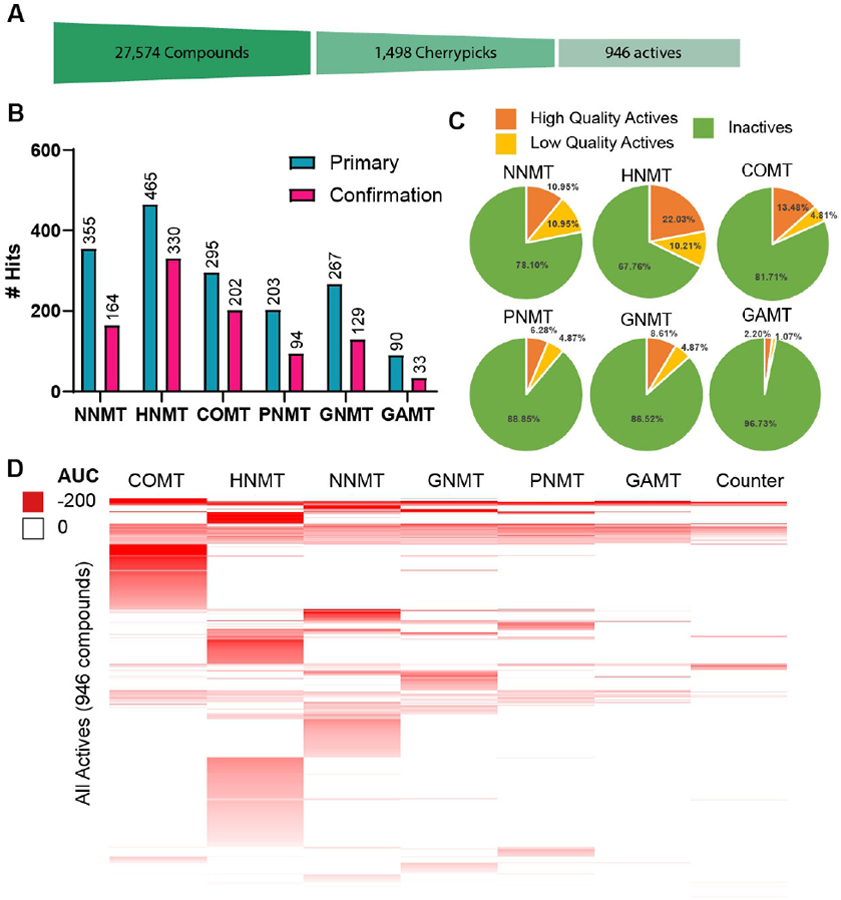
Target class profiling (TCP) is a chemical biology approach to investigate understudied biological target classes. TCP is achieved by developing a generalizable assay platform and screening curated compound libraries to interrogate the chemical biological space of members of an enzyme family. In this work, we took a TCP approach to investigate inhibitory activity across a set of small-molecule methyltransferases (SMMTases), a subclass of methyltransferase enzymes, with the goal of creating a launchpad to explore this largely understudied target class. Using the representative enzymes nicotinamide N-methyltransferase (NNMT), phenylethanolamine N-methyltransferase (PNMT), histamine N-methyltransferase (HNMT), glycine N-methyltransferase (GNMT), catechol O-methyltransferase (COMT), and guanidinoacetate N-methyltransferase (GAMT), we optimized high-throughput screening (HTS)-amenable assays to screen 27,574 unique small molecules against all targets. From this data set, we identified a novel inhibitor which selectively inhibits the SMMTase HNMT and demonstrated how this platform approach can be leveraged for a targeted drug discovery campaign using the example of HNMT.


Conflict of interest statement

The authors declare no competing financial interests. Data for all assays are publicly available on PubChem. AID #s: 1745853 (Primary screen), 1745852 (confirmation screen), 1745851 (counter screen)

Figures

Figure 1.
Figure 1.
Small molecule methyltransferases comprise a diverse subset of methyltransferases. A) Dendrogram of human methyltransferases. Methyltransferase sequences were retrieved from UniProt and aligned using ClustalW. Dendrogram image was produces using ITOL. Larger nodes were collapsed into triangles. Green paths lead to small molecule methyltransferases. MTase names highlighted in green indicate those used in this study. B) General reaction diagram for methyltransferases which use SAM as a methyl donor. Also shown are biochemical reactions for the SMMTases used in this study: NNMT, COMT, PNMT, HNMT, GNMT, and GAMT. C) Structures of SMMTases reveal a large variation in solvent-accessible space (grey surfaces) among the representative enzymes used in this study. Alpha carbon RMSD for all structures is 1.59 Å. PDB IDs: HNMT (1JQD), GNMT (1R74), PNMT (2AN4), GAMT (3ORH), NNMT (4ROD), COMT (5LSA).
Figure 2.
Figure 2.
Biochemical assay development for PNMT shown as a representative example. A) KM for PNMT substrate norepinephrine was determined using the method of initial rates to determine Michaelis constants. Data were plotted and fitted to a substrate inhibition model using GraphPad prism. SAM was held constant at 100 uM. B) KM for SAM was determined as described in A. Norepinephrine was held constant at 100 μM. C) Reaction time course at 30 nM, 15 nM, and 7.5 nM PNMT were performed with SAM and norepinephrine at KM concentrations to determine when 10–20% conversion was achieved. At 30 nM PNMT the reaction begins to plateau at 50 min and 20% conversion was estimated at 20 min. D) All SMMTases used in this project were tested against sinefungin, a non-specific positive control MTase inhibitor.
Figure 3.
Figure 3.
Screening library selection. Four compound libraries were selected to develop the SMMTase target class profile. A) Principal component analysis describing the overall chemical diversity of the annotated libraries (NPACT and LOPAC-Epi) and the chemical diversity libraries (Genesis and MTase). B) Molecular weight distribution of compounds in each compound set. C) Total polar surface area distribution in each library. D) Hydrophobicity plot of all libraries.
Figure 4.
Figure 4.
High-throughput screening overview and assay performance. A) A total of 27,574 compounds were screened against NNMT, HNMT, COMT, PNMT, GNMT, and GAMT for MTase inhibition. The initial screen was performed at a concentration of 40 μM, and hits were scored based on a maximum response cut-off of −50, indicating >50% inhibition. 1,498 compounds met this criteria and were then assayed against each MTase and counter-assay in 11-point dose response. Final hits were selected on the basis of maximum response (< −50), Log(AC50) < −4.5, and curve class (−1.1, −1.2, −2.1, −2.2 – see Methods for explanation of curve class categories). B) Z` for all 1536-well assay plates in the primary screen, calculated from 32 positive- and negative-control wells on each plate. C) Signal-to-background (S/B) for all plates in the primary screen calculated from 32 positive- and negative-control wells on each plate.
Figure 5.
Figure 5.
Hit rates for cherrypicked compounds. A) Cartoon depiction of the funnel-down approach to identifying hits. A total of 27,574 unique compounds were screened and 1,498 compounds were identified as initial hits suitable for cherrypicking. Out of those initial hits a total of 946 unique compounds were confirmed across each MTase assay. B) Initial hits for each SMMTase (turquoise) and confirmed hits (magenta). Note that hit numbers do not account for specificity, which is reflected in D. C) 1,498 compounds from the primary screen were selected for cherrypicking. Each compound was assayed against each Mtase and a counter assay in 11-point dose response. Hits were the identified as high-quality actives (complete dose-response curves, max Response ≤ −50, and IC50 ≤ 10 μM), low quality actives (shallow curves, single-point activity, or inconclusive), or inactive. D) Heat map showing activity profile of all active compounds against COMT, HNMT, NNMT, GNMT, PNMT, GAMT, and the counter assay. Compounds in this heat map are clustered by total activity across all seven assays.
Figure 6.
Figure 6.
A) Cluster analysis of Diversity Library hits. Compounds were clustered according to chemical similarity (based on Tanimoto coefficient) and a heat map was generated to show relative activity. Chemical clusters with high activity, such as the HNMT selective cluster (blue) reveal selective chemotypes for a single SMMTase. Bands of high activity indicate pan inhibitors of the representative SMMTases (green). B) Chemotype of top HNMT-selective hit enables cheminformatic R-group decompositions. R group decomposition was performed using TIBCO Spotfire (TIBCO Software Inc.). Compound activity (displayed as area under the curve, AUC) was plotted as a function of R2 functional group identity. R1 group identity is color coded blue for hydrogen and orange for methoxy. C) The R2 group in NCGC00411246 yields a highly active and specific compounds. R groups which result in reduced specificity (e.g., NCGC00411220) or reduce activity (e.g., NCGC00411154) we also observed.
Figure 7.
Figure 7.
MS Assay. A) Sample trace of HNMT inhibitor NCGC00411044. Top trace represents SAH signal generated during HNMT enzymatic reaction in the presence of inhibitor. Bottom chromatogram represents that 100 nM SAH-d4 internal standard added to each sample. B) Dose response curves generated from LC-MS analysis of HNMT-specific inhibitors (NCGC00411044 and NCGC00411246) and PAINS compounds (NCGC00519772 and NCGC00519779). SAH/SAH-d4 ratio was normalized to an uninhibited sample for each enzyme (n=3). C) Structure of best HNMT hits and comparison of the IC50 values between MTase Glo and MS assays.
Figure 8.
Figure 8.
A) Co-crystal structure of HNMT (PDB ID: 1JQD) cofactor SAM is showing in green stick mode and the substrate histamine is showing in orange stick mode. B) and C) Docking model of the screening hit NCGC00411044 at SAM binding pocket. NCGC00411044 is showing in cyan stick mode. D) 2D ligand-protein interaction map to show the specific H-bond interaction and pi-stacking interactions. The molecular surface of the binding site is depicted in hydrophobicity contour (hydrophilic = purple; lipophilic=green), and the dotted lines indicate H-bond interactions. Figures are prepared using Molecular Operating Environment (MOE) computational software.

References

    1. Barnash KD; James LI; Frye SV, Target class drug discovery. Nat Chem Biol 2017, 13 (10), 1053–1056. - PMC - PubMed
    1. Copeland RA; Solomon ME; Richon VM, Protein methyltransferases as a target class for drug discovery. Nat Rev Drug Discov 2009, 8 (9), 724–32. - PubMed
    1. Heilker R; Wolff M; Tautermann CS; Bieler M, G-protein-coupled receptor-focused drug discovery using a target class platform approach. Drug Discov Today 2009, 14 (5–6), 231–40. - PubMed
    1. Carter AJ; Kraemer O; Zwick M; Mueller-Fahrnow A; Arrowsmith CH; Edwards AM, Target 2035: probing the human proteome. Drug Discov Today 2019, 24 (11), 2111–2115. - PubMed
    1. Posy SL; Hermsmeier MA; Vaccaro W; Ott KH; Todderud G; Lippy JS; Trainor GL; Loughney DA; Johnson SR, Trends in kinase selectivity: insights for target class-focused library screening. J Med Chem 2011, 54 (1), 54–66. - PubMed

Publication types

MeSH terms

Substances