. 2023 Apr 12;145(14):7768-7779.
doi: 10.1021/jacs.2c06148. Epub 2023 Mar 28.

Integrating Hydrogen Deuterium Exchange-Mass Spectrometry with Molecular Simulations Enables Quantification of the Conformational Populations of the Sugar Transporter XylE

Affiliations

Integrating Hydrogen Deuterium Exchange-Mass Spectrometry with Molecular Simulations Enables Quantification of the Conformational Populations of the Sugar Transporter XylE

Ruyu Jia et al. J Am Chem Soc. .

Abstract

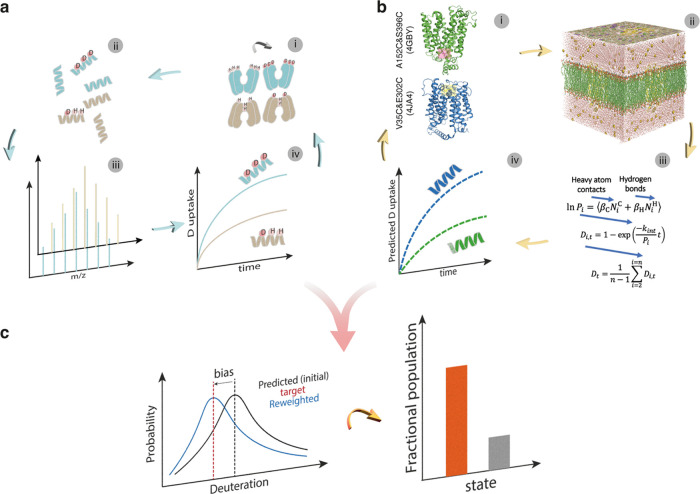
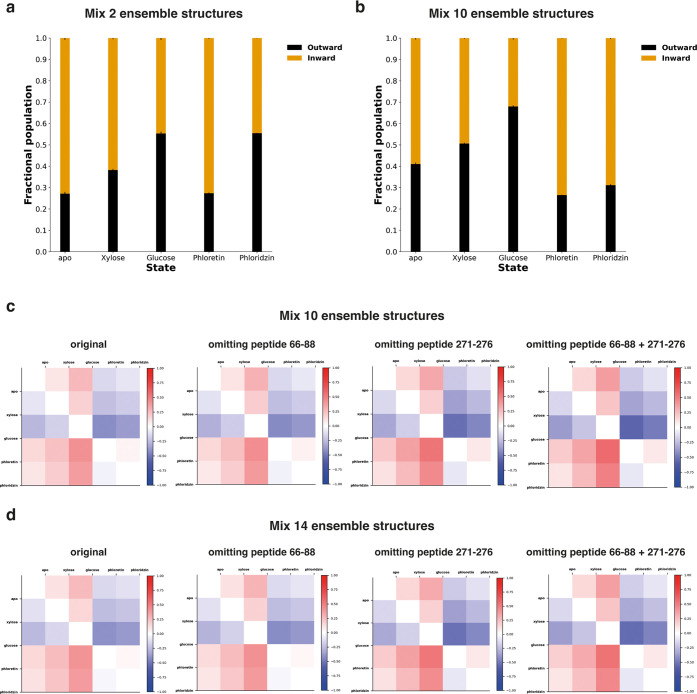
A yet unresolved challenge in structural biology is to quantify the conformational states of proteins underpinning function. This challenge is particularly acute for membrane proteins owing to the difficulties in stabilizing them for in vitro studies. To address this challenge, we present an integrative strategy that combines hydrogen deuterium exchange-mass spectrometry (HDX-MS) with ensemble modeling. We benchmark our strategy on wild-type and mutant conformers of XylE, a prototypical member of the ubiquitous Major Facilitator Superfamily (MFS) of transporters. Next, we apply our strategy to quantify conformational ensembles of XylE embedded in different lipid environments. Further application of our integrative strategy to substrate-bound and inhibitor-bound ensembles allowed us to unravel protein-ligand interactions contributing to the alternating access mechanism of secondary transport in atomistic detail. Overall, our study highlights the potential of integrative HDX-MS modeling to capture, accurately quantify, and subsequently visualize co-populated states of membrane proteins in association with mutations and diverse substrates and inhibitors.


Conflict of interest statement

The authors declare no competing financial interest.

Figures

Figure 1
Figure 1
Integrative modeling workflow with HDX-MS data and molecular simulations (a, i) H–D exchange of protein backbone amides occurs spontaneously in deuterated solution. (a, ii) The exchange can be quenched at various time points and measured at peptide-level resolution when coupled to enzymatic digestion. (a, iii and iv) Deuterium uptake over time is determined by measuring the peptide mass by LC-MS. (b, i) Generate initial protein structures. (b, ii) Ensemble sampling of protein structures via MD simulations. (b, iii and iv) Compute deuterium uptake based on an empirical model. (c) Fit predicted deuteration to target data to find an atomistic structural ensemble that best fits target HDX-MS data, then quantify fractional population in the final reweighting ensemble structure.
Figure 2
Figure 2
Benchmarking on XylE WT, G58W mutant, and lipid nanodisc. (a). Differential HDX-MS results for XylE WT and G58W solution ensembles highlight significant differences in deuterium uptake between WT & G58W XylE, localized to the extracellular and intracellular protein faces. The experimental data suggest that the G58W mutation shifts the XylE conformational ensemble to a more OF population than WT. Computational reweighting of a mixed OF/IF ensemble to fit the experimental WT and G58W HDX-MS data results in a clear separation of the structures present in each experimental dataset. WT XylE is mostly represented by structures from IF simulations (orange), and G58W by structures from OF simulations (black). (b) Differential HDX-MS results for XylE WT in DOPC-based and DOPE-based nanodiscs show small differences in a structural overlay of DOPC – DOPE ΔHDX-MS. After reweighting, both nanodisc environments consist of a mixed OF and IF ensemble, with populations intermediate between those of WT and G58W XylE in detergent micelles. DOPE-based nanodiscs shift toward a slightly more IF ensemble than DOPC-based. Regions showing a difference in HDX compared to the apo state are colored in blue (protected) or red (deprotected) scale according to the difference in fractional uptake normalized to the MaxD. In both cases, uncertainty in final conformational populations was estimated as the standard deviation from three independent reweighting analyses using systematic subsampling of the full candidate ensemble. Standard deviations of the subsampling for each fitting are plotted as errors (n = 3). (c) Effect of reweighting on the XylE interdomain distance distributions on the extracellular and (d) intracellular face of the protein. Larger distances correspond to a more “open” structure.
Figure 3
Figure 3
Differential HDX-MS experiments comparing ligand-bound and apo states of WT XylE. (a) Chemical structures of ligands: xylose, glucose, phloretin, and phloridzin. (b) Differential HDX-MS uptake pattern between apo XylE and ligand-bound XylE structures. Figures are plotted onto a 3D protein structure (PDB:4GBY). Regions showing a difference in HDX compared to the apo state are colored in blue (protected) or red (deprotected) scale according to difference in fractional uptake normalized to the MaxD. Regions with no coverage are colored in dark gray. Residue numbers for peptide segments with significant difference between states are reported in Figure S8. (c) Representative peptide deuterium uptake plots between apo and ligand-bound structures (peptide 31–40 on the extracellular side and 395–411 on the intracellular side). Standard deviations for each time point are plotted as error bars (n = 3).
Figure 4
Figure 4
MD workflow of generating XylE phloretin- and phloridzin-bound structures. The workflow comprises generating apo receptor structures by first performing MD simulations of protein-only structure in locked conformation (OF/IF) to generate a broader range of conformations, clustering methods are then applied to select representative protein structure for docking; rigid docking of ligand to representative receptor structures; dimensionality reduction for the identification of binding site clusters and structural clustering for representative (centroid) and highest scoring (top) docking pose selection; simulation of representative/highest scoring ligand-bound structures; and analysis of pose dynamic and selection of suitable binding pose by stability, repeated sampling, and biological relevance criteria.
Figure 5
Figure 5
MD simulations of XylE phloretin- and phloridzin-bound structures in the OF and IF conformations. (a) RMSD plots of XylE backbone in bound phloretin and phloridzin (OF and IF) conformations through three independent 1 μs-long simulations. (b) Coordination of phloretin and phloridzin by XylE in OF and IF structures. Phloretin and phloridzin are shown in black balls and sticks, respectively. The binding site residues in XylE are colored green. (c) 2D protein–ligand interaction diagram generated by LigPlot+. Phloretin and phloridzin are shown in black balls and sticks, respectively, hydrogen bonds are shown as green dotted lines, while the red eyelash diagram represents hydrophobic interactions.
Figure 6
Figure 6
Ensemble reweighting of XylE structures in apo and ligand-bound states. (a) Fractional population of the final reweighting ensemble with a mixed candidate ensemble from two starting structures (OF/IF) fitted to each state-specific experimental HDX-MS dataset (apo, xylose-, glucose- phloretin-, and phloridzin-bound state). (b) Fractional population of the final reweighting ensemble with a mixed candidate ensemble from 10 starting structures (OF/IF) fitted to each experimental HDX-MS dataset (apo, xylose-, glucose-, phloretin-, and phloridzin-bound state). In both cases, uncertainty in final conformational populations was estimated as the standard deviation from three independent reweighting analyses using systematic subsampling of the full candidate ensemble. Standard deviations of the subsampling for each fitting are plotted as errors (n = 3). (c, d) Heatmap of relative fraction difference between states. Red indicates more OF, and blue indicates more IF.

References

    1. Trabjerg E.; Nazari Z. E.; Rand K. D. Conformational analysis of complex protein states by hydrogen/deuterium exchange mass spectrometry (HDX-MS): Challenges and emerging solutions. TrAC, Trends Anal. Chem. 2018, 106, 125–138. 10.1016/j.trac.2018.06.008. - DOI
    1. Martens C.; Shekhar M.; Borysik A. J.; Lau A. M.; Reading E.; Tajkhorshid E.; Booth P. J.; Politis A. Direct protein-lipid interactions shape the conformational landscape of secondary transporters. Nat. Commun. 2018, 9, 415110.1038/s41467-018-06704-1. - DOI - PMC - PubMed
    1. Calvaresi V.; Redsted A.; Norais N.; Rand K. D. Hydrogen-Deuterium Exchange Mass Spectrometry with Integrated Size-Exclusion Chromatography for Analysis of Complex Protein Samples. Anal. Chem. 2021, 93, 11406–11414. 10.1021/acs.analchem.1c01171. - DOI - PubMed
    1. Jaswal S. S. Biological insights from hydrogen exchange mass spectrometry. Biochim. Biophys. Acta, Proteins Proteomics 2013, 1834, 1188–1201. 10.1016/j.bbapap.2012.10.011. - DOI - PubMed
    1. Devaurs D.; Antunes D. A.; Borysik A. J. Computational Modeling of Molecular Structures Guided by Hydrogen-Exchange Data. J. Am. Soc. Mass Spectrom. 2022, 33, 215–237. 10.1021/jasms.1c00328. - DOI - PubMed

Publication types

MeSH terms