. 2023 Mar 11;11(3):260.
doi: 10.3390/toxics11030260.

Hypoxia-Induced Kidney Injury in Newborn Rats

Affiliations

Hypoxia-Induced Kidney Injury in Newborn Rats

Yi-Ting Chu et al. Toxics. .

Abstract

Exposure to hypoxia during the early postnatal period can have adverse effects on vital organs. Neonatal Sprague-Dawley rats housed in a hypoxic chamber were compared to those in a normoxic chamber from postnatal days 0 to 7. Arterial blood was collected to evaluate renal function and hypoxia. Kidney morphology and fibrosis were evaluated using staining methods and immunoblotting. In the kidneys of the hypoxic group, protein expressions of hypoxia-inducible factor-1 were higher than those in the normoxic group. Hypoxic rats had higher levels of hematocrit, serum creatinine, and lactate than normoxic rats. Body weight was reduced, and protein loss of kidney tissue was observed in hypoxic rats compared to normoxic rats. Histologically, hypoxic rats showed glomerular atrophy and tubular injury. Renal fibrosis with collagen fiber deposition was observed in the hypoxic group. The expression of nicotinamide adenine dinucleotide phosphate oxidases was enhanced in the kidneys of hypoxic rats. Proteins involved in apoptosis were upregulated in the kidneys of hypoxic rats. An increase in the expression of pro-inflammatory cytokines was also observed in the kidneys of hypoxic rats. Hypoxic kidney injury in neonatal rats was associated with oxidative stress, inflammation, apoptosis, and fibrosis.

Keywords: apoptosis; fibrosis; hypoxia; kidney injury; neonate; oxidative stress.


Conflict of interest statement

The authors declare no conflict of interest.

Figures

Figure 1
Figure 1
Neonatal rat model of the effect of hypoxia on the kidney after 7 postnatal days. (A) Our newborn rat model was used to study the effect of hypoxia on the kidney. (B) Protein expressions of HIF-1α and HO-1 in the kidney tissue of the normoxic and hypoxic groups are shown. The values are presented as mean ± standard deviation, ** p < 0.01, versus the normoxic group. The p-values were estimated via Mann–Whitney U test (n = 6). N, normoxia; H, hypoxia; HIF-1α, hypoxia-inducible factors, alpha subunit; HO-1, heme oxygenase-1.
Figure 2
Figure 2
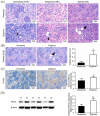
Neonatal hypoxia-induced glomerular and tubular injuries on postnatal day 7. (A) Representative PAS- and HE-stained images of the glomerulus (arrow head) under 400× magnification (scale bar, 20 μm) and representative HE-stained images of tubules (arrow) under 200× magnification (scale bar, 50 μm) in the kidneys. (B) PAS staining images show the tubules (arrow) under 200× magnification (scale bar, 50 μm) and the tubular injury score. Immunohistochemical staining (C), immunoblotting (D), and quantitative analysis of NGAL. The values are presented as mean ± standard deviation, * p < 0.05, ** p < 0.01 versus the normoxic group. The p-values were estimated via Mann–Whitney U test (n = 6). N, normoxia; H, hypoxia; PAS, periodic acid Schiff; HE, hematoxylin and eosin; NGAL, neutrophil gelatinase-associated lipocalin; AOD, average optical density.
Figure 3
Figure 3
Hypoxia caused growth restriction and protein loss in the kidney. (A) Body weight on postnatal days 0 and 7. (B) Total protein concentration of the kidney tissue. (C) Western blot and quantitative analysis of different housekeeping proteins in the kidney tissue. The values are presented as mean ± standard deviation, * p < 0.05, ** p < 0.01, versus the normoxic group. The p-values were estimated via Mann–Whitney U test (n = 6–8). N, normoxia; H, hypoxia.
Figure 4
Figure 4
Neonatal hypoxia-induced kidney fibrosis. (A) Picrosirius red-stained images of the kidney tissue show collagen (red) under 400× magnification (scale bar, 20 μm) and quantification. (B) Masson trichome-stained images of the kidney tissue show fibrosis (blue) under 400× magnification (scale bar, 20 μm) and the CVF. (C) Representative images of klotho immunohistochemical staining in the kidney tissue under 200× magnification (scale bar, 50 μm) and quantitative analysis. (D) Representative images of FGF23 and collagen I immunoblotting in the kidney and quantitative analysis. The values are presented as mean ± standard deviation. * p < 0.05, ** p < 0.01, versus the normoxic group. The p-values were estimated via Mann–Whitney U test (n = 4–8). N, normoxia; H, hypoxia; CVF, collagen volume fraction; FGF23, fibroblast growth factor 23.
Figure 5
Figure 5
Hypoxic kidney injury involves oxidative stress, apoptosis, and inflammatory signaling. (A) Western blot analysis shows the oxidative-stress-related proteins, including P22, P47, NOX2, and NOX4. (B) Western blot analysis shows apoptosis-related proteins, including p-P38, Casp-9, and cleaved casp-3. (C) Western blot analysis shows the inflammatory-related proteins, including TNF-α and NF-κB. Quantitative analysis was performed for each blot. The values are presented as mean ± standard deviation. * p < 0.05, ** p < 0.01, versus the normoxic group. The p-values were estimated via Mann–Whitney U test (n = 6). N, normoxia; H, hypoxia. P22, nicotinamide adenine dinucleotide 3-phosphate (NADPH) oxidase subunit p22-phox; P47, NADPH oxidase subunit p47-phox; NOX2, NADPH oxidase 2; NOX4, NADPH oxidase 4; p-P38, phospho-p38 mitogen-activated protein kinase (Thr180/Tyr182); P38, p38 MAP kinase; Casp-9, caspase-9; cleaved Casp 3, cleaved-caspase-3; TNF-α, tumor necrosis factor-α; NF-κB, nuclear factor kappa-light-chain-enhancer of activated B cells.

References

    1. Farahani R., Kanaan A., Gavrialov O., Brunnert S., Douglas R.M., Morcillo P., Haddad G.G. Differential effects of chronic intermittent and chronic constant hypoxia on postnatal growth and development. Pediatr. Pulmonol. 2008;43:20–28. doi: 10.1002/ppul.20729. - DOI - PubMed
    1. Mach M., Dubovicky M., Navarova J., Brucknerova I., Ujhazy E. Experimental modeling of hypoxia in pregnancy and early postnatal life. Interdiscip. Toxicol. 2009;2:28–32. doi: 10.2478/v10102-009-0005-3. - DOI - PMC - PubMed
    1. Soulier V., Dalmaz Y., Cottet-Emard J.M., Lagercrantz H., Pequignot J.M. Long-term influence of neonatal hypoxia on catecholamine activity in carotid bodies and brainstem cell groups of the rat. Pt 2J. Physiol. 1997;498:523–530. doi: 10.1113/jphysiol.1997.sp021878. - DOI - PMC - PubMed
    1. Mortola J.P., Xu L., Lauzon A.-M. Body growth, lung and heart weight, and DNA content in newborn rats exposed to different levels of chronic hypoxia. Can. J. Physiol. Pharmacol. 1990;68:1590–1594. doi: 10.1139/y90-242. - DOI - PubMed
    1. Moromisato D.Y., Moromisato M.Y., Zanconato S., Roberts C.T., Jr. Effect of hypoxia on lung, heart, and liver insulin-like growth factor-I gene and receptor expression in the newborn rat. Crit. Care Med. 1996;24:919–924. doi: 10.1097/00003246-199606000-00008. - DOI - PubMed

LinkOut - more resources