. 2023 Jun 2;13(6):1364-1385.
doi: 10.1158/2159-8290.CD-22-1427.

Late-Stage Metastatic Melanoma Emerges through a Diversity of Evolutionary Pathways

Lavinia Spain #  1   2   3 Alexander Coulton #  1   4 Irene Lobon #  1 Andrew Rowan #  5 Desiree Schnidrig #  1 Scott T C Shepherd  1   2 Benjamin Shum  1   2 Fiona Byrne  1 Maria Goicoechea  1 Elisa Piperni  1 Lewis Au  1   2   3   6 Kim Edmonds  7 Eleanor Carlyle  7 Nikki Hunter  7 Alexandra Renn  7 Christina Messiou  7   8 Peta Hughes  2 Jaime Nobbs  2 Floris Foijer  9 Hilda van den Bos  9 Rene Wardenaar  9 Diana C J Spierings  9 Charlotte Spencer  1   2 Andreas M Schmitt  7 Zayd Tippu  1   2 Karla Lingard  7 Lauren Grostate  7 Kema Peat  7 Kayleigh Kelly  7 Sarah Sarker  7 Sarah Vaughan  7 Mary Mangwende  7 Lauren Terry  7 Denise Kelly  7 Jennifer Biano  7 Aida Murra  7 Justine Korteweg  7 Charlotte Lewis  7 Molly O'Flaherty  7 Anne-Laure Cattin  1 Max Emmerich  1   10 Camille L Gerard  1   11 Husayn Ahmed Pallikonda  1 Joanna Lynch  7 Robert Mason  12 Aljosja Rogiers  1   7 Hang Xu  13 Ariana Huebner  5   14   15 Nicholas McGranahan  14 Maise Al Bakir  5   15 Jun Murai  4   16 Cristina Naceur-Lombardelli  15 Elaine Borg  17 Miriam Mitchison  17 David A Moore  18 Mary Falzon  17 Ian Proctor  17 Gordon W H Stamp  13 Emma L Nye  13 Kate Young  2 Andrew J S Furness  2   8 Lisa Pickering  7 Ruby Stewart  18 Ula Mahadeva  18 Anna Green  18 James Larkin  18 Kevin Litchfield #  4 Charles Swanton #  5 Mariam Jamal-Hanjani #  15   19   20 PEACE ConsortiumSamra Turajlic #  1   2
Affiliations

Late-Stage Metastatic Melanoma Emerges through a Diversity of Evolutionary Pathways

Lavinia Spain et al. Cancer Discov. .

Abstract

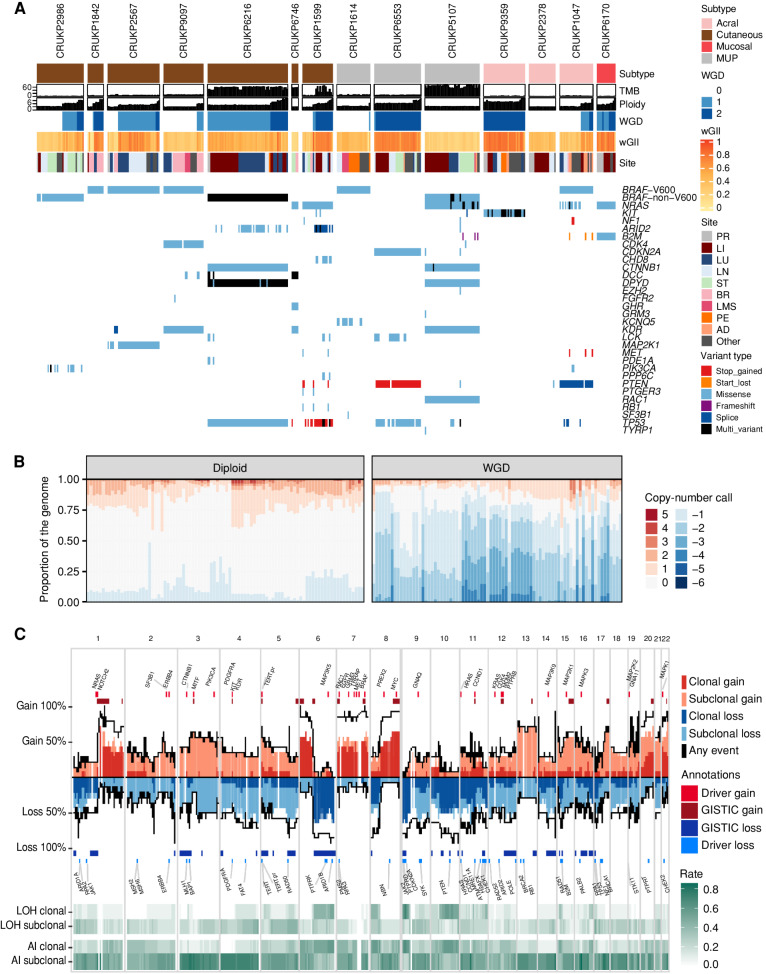
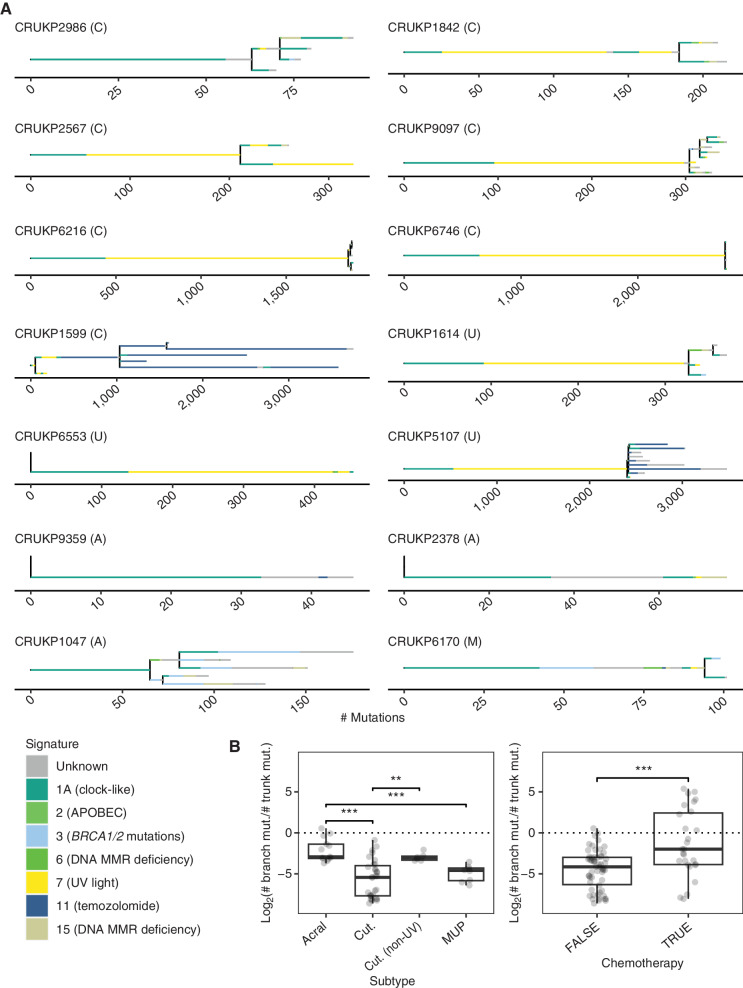
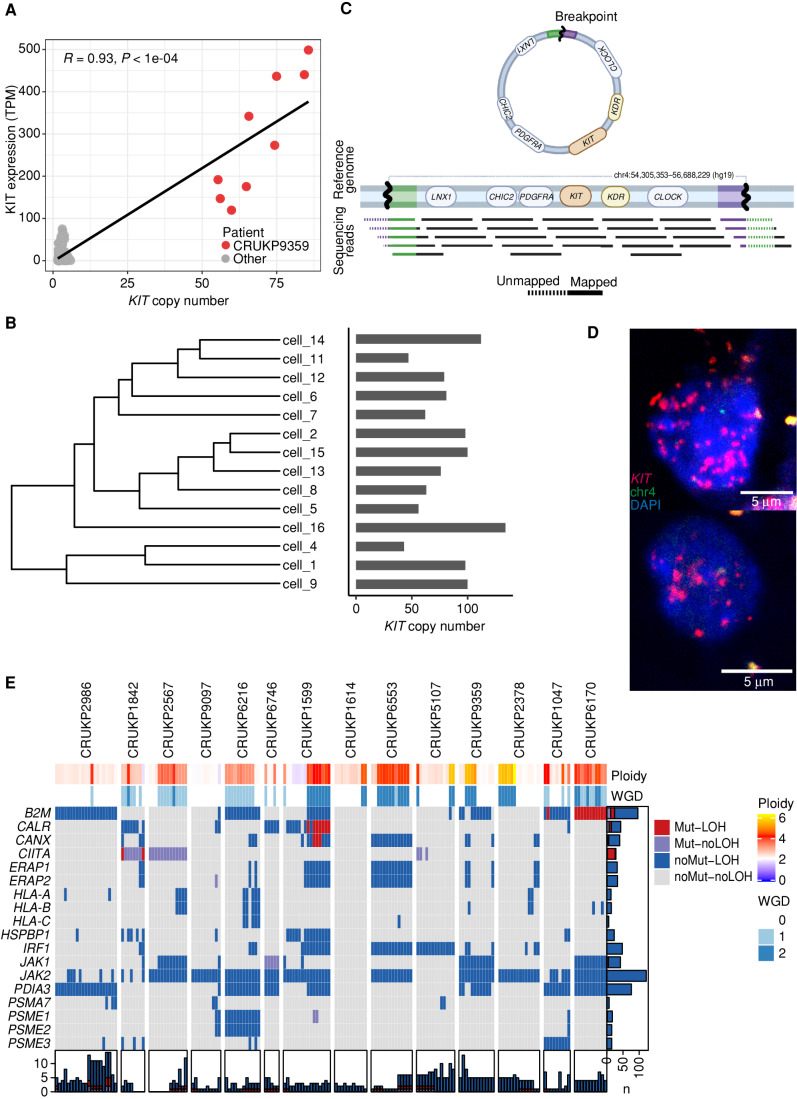
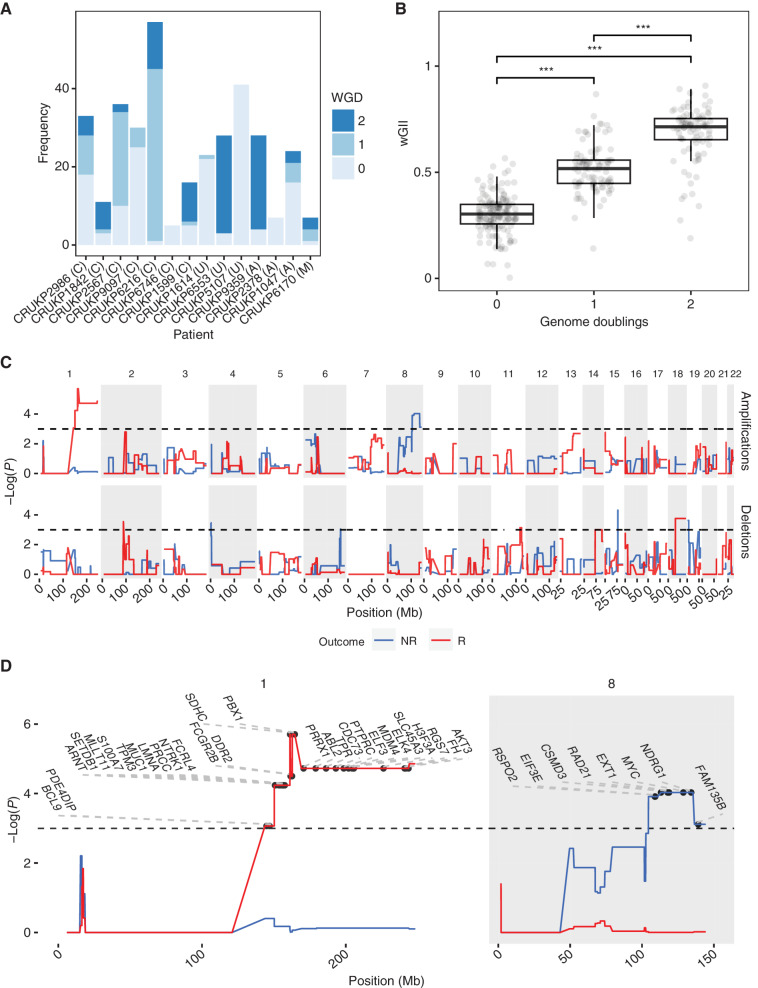
Understanding the evolutionary pathways to metastasis and resistance to immune-checkpoint inhibitors (ICI) in melanoma is critical for improving outcomes. Here, we present the most comprehensive intrapatient metastatic melanoma dataset assembled to date as part of the Posthumous Evaluation of Advanced Cancer Environment (PEACE) research autopsy program, including 222 exome sequencing, 493 panel-sequenced, 161 RNA sequencing, and 22 single-cell whole-genome sequencing samples from 14 ICI-treated patients. We observed frequent whole-genome doubling and widespread loss of heterozygosity, often involving antigen-presentation machinery. We found KIT extrachromosomal DNA may have contributed to the lack of response to KIT inhibitors of a KIT-driven melanoma. At the lesion-level, MYC amplifications were enriched in ICI nonresponders. Single-cell sequencing revealed polyclonal seeding of metastases originating from clones with different ploidy in one patient. Finally, we observed that brain metastases that diverged early in molecular evolution emerge late in disease. Overall, our study illustrates the diverse evolutionary landscape of advanced melanoma.

Significance: Despite treatment advances, melanoma remains a deadly disease at stage IV. Through research autopsy and dense sampling of metastases combined with extensive multiomic profiling, our study elucidates the many mechanisms that melanomas use to evade treatment and the immune system, whether through mutations, widespread copy-number alterations, or extrachromosomal DNA. See related commentary by Shain, p. 1294. This article is highlighted in the In This Issue feature, p. 1275.


Figures

Figure 1. Driver mutations and SCNA overview. A, Genomic landscape of the cohort, illustrating mutations in key melanoma driver genes, TMB (total mutations/Mb), ploidy, WGD status, weighted genome instability index (wGII, an SCNA burden metric), and the anatomic site of each sample. “Multi-variant” indicates the presence of more than one variant in the same gene within one sample. Panel and WES samples are included. AD, adrenal; BR, brain; LI, liver; LMS, leptomeninges; LN, lymph node; LU, lung; PE, peritoneum; PR, primary; ST, soft tissue. B, The proportion of the genome altered by copy-number gains and losses per sample in diploid and WGD tumor samples. C, The frequency of copy-number gains and losses along the genome (based on WES data only). Dark red and blue indicate clonal events, and light red and blue indicate subclonal events. Also shown are frequency of clonal and subclonal LOH and AI.
Figure 1.
Driver mutations and SCNA overview. A, Genomic landscape of the cohort, illustrating mutations in key melanoma driver genes, TMB (total mutations/Mb), ploidy, WGD status, weighted genome instability index (wGII, an SCNA burden metric), and the anatomic site of each sample. “Multi-variant” indicates the presence of more than one variant in the same gene within one sample. Panel and WES samples are included. AD, adrenal; BR, brain; LI, liver; LMS, leptomeninges; LN, lymph node; LU, lung; PE, peritoneum; PR, primary; ST, soft tissue. B, The proportion of the genome altered by copy-number gains and losses per sample in diploid and WGD tumor samples. C, The frequency of copy-number gains and losses along the genome (based on WES data only). Dark red and blue indicate clonal events, and light red and blue indicate subclonal events. Also shown are frequency of clonal and subclonal LOH and AI.
Figure 2. A, Phylogenies inferred for the 14 patients. Only WES samples are included. Letters in brackets indicate melanoma subtype: A = acral, C = cutaneous, M = mucosal, U = melanoma of unknown primary. Branch length is proportional to the number of mutations. Branch colors represent the mutational signatures of the mutations. For clarity, only the most common mutational signatures are shown; the remainder are categorized as “unknown.” Scale bars indicate the number of mutations. The legend includes etiologies for each signature (24). MMR, mismatch repair. B, Boxplots indicate the ratio of subclonal mutations (length of branches) to clonal mutations (length of the trunk) by subtype and chemotherapy status. Values smaller than zero indicate the dominance of truncal mutations. Mann–Whitney U test was used for statistical comparisons (**, P < 0.01; ***, P < 0.001). Cut., cutaneous; mut., mutation.
Figure 2.
A, Phylogenies inferred for the 14 patients. Only WES samples are included. Letters in brackets indicate melanoma subtype: A = acral, C = cutaneous, M = mucosal, U = melanoma of unknown primary. Branch length is proportional to the number of mutations. Branch colors represent the mutational signatures of the mutations. For clarity, only the most common mutational signatures are shown; the remainder are categorized as “unknown.” Scale bars indicate the number of mutations. The legend includes etiologies for each signature (24). MMR, mismatch repair. B, Boxplots indicate the ratio of subclonal mutations (length of branches) to clonal mutations (length of the trunk) by subtype and chemotherapy status. Values smaller than zero indicate the dominance of truncal mutations. Mann–Whitney U test was used for statistical comparisons (**, P < 0.01; ***, P < 0.001). Cut., cutaneous; mut., mutation.
Figure 3. Late-emerging brain metastases have a lower copy-number burden. A, wGII per metastatic site. Site-specific null distributions of mean wGII were generated by randomizing sample sets (from any metastatic site) while keeping patient contributions constant (see Methods). **, P ≤ 0.01. Leptomen., leptomeninges. B, Correlation between brain copy-number (CN) distance to other sites and time of emergence of brain metastases after stage IV diagnosis in days. C, Growth dynamics of tumors in patient CRUKP5107. The brain lesion (in orange) was detected in only the last two scans after the targeted therapy [BRAF inhibitor (i) + MEKi], ICI (PD-1i + CTLA4i), and chemotherapy courses. PD, progressive disease; PR, partial response; SD, stable disease. D, SNV and indel phylogenetic tree of tumor clones in patient CRUKP5107. E, The mutational signature contributions to each clone in the phylogeny in D are shown. MMR, mismatch repair. F, The anatomic distribution of clones. Each pie chart represents a sample with its clonal composition indicated by the colors. A multiregional sampling of the same tumor is indicated by the gray dashed lines. BR, brain; LI, liver; LU, lung; PC, pericardium; ST, soft tissue.
Figure 3.
Late-emerging brain metastases have a lower copy-number burden. A, wGII per metastatic site. Site-specific null distributions of mean wGII were generated by randomizing sample sets (from any metastatic site) while keeping patient contributions constant (see Methods). **, P ≤ 0.01. Leptomen., leptomeninges. B, Correlation between brain copy-number (CN) distance to other sites and time of emergence of brain metastases after stage IV diagnosis in days. C, Growth dynamics of tumors in patient CRUKP5107. The brain lesion (in orange) was detected in only the last two scans after the targeted therapy [BRAF inhibitor (i) + MEKi], ICI (PD-1i + CTLA4i), and chemotherapy courses. PD, progressive disease; PR, partial response; SD, stable disease. D, SNV and indel phylogenetic tree of tumor clones in patient CRUKP5107. E, The mutational signature contributions to each clone in the phylogeny in D are shown. MMR, mismatch repair. F, The anatomic distribution of clones. Each pie chart represents a sample with its clonal composition indicated by the colors. A multiregional sampling of the same tumor is indicated by the gray dashed lines. BR, brain; LI, liver; LU, lung; PC, pericardium; ST, soft tissue.
Figure 4. Mechanisms of resistance to therapy. A, KIT copy number vs. KIT expression in matching exome and RNA-seq samples. TPM, transcripts per million. B, Hierarchical clustering tree of SCNAs found in the single cells of a representative sample of CRUKP9359. Bars on the right show the copy number of KIT in each cell. C, Diagram of split reads mapping at the edges of the amplified region, from which a circular structure can be inferred. Created with BioRender.com. D, Images showing FISH probes against KIT (red) in individual cells. E, Heat map of alterations in antigen-presentation genes in the exome data. Each column represents a sample. LOH events are shown in red and blue, and nonsynonymous mutations are in red and purple. Bars on the x-axis show the number of genes altered in each sample, whereas y-axis bars show the number of samples altered per gene, colored by the type of event.
Figure 4.
Mechanisms of resistance to therapy. A,KIT copy number vs. KIT expression in matching exome and RNA-seq samples. TPM, transcripts per million. B, Hierarchical clustering tree of SCNAs found in the single cells of a representative sample of CRUKP9359. Bars on the right show the copy number of KIT in each cell. C, Diagram of split reads mapping at the edges of the amplified region, from which a circular structure can be inferred. Created with BioRender.com. D, Images showing FISH probes against KIT (red) in individual cells. E, Heat map of alterations in antigen-presentation genes in the exome data. Each column represents a sample. LOH events are shown in red and blue, and nonsynonymous mutations are in red and purple. Bars on the x-axis show the number of genes altered in each sample, whereas y-axis bars show the number of samples altered per gene, colored by the type of event.
Figure 5. Tissue-level amplifications and deletions associated with response to ICI. A large proportion of samples underwent WGD (A), with successive WGD events associated with increasing wGII (B). Letters in brackets indicate melanoma subtype: A = acral, C = cutaneous, M = mucosal, U = melanoma of unknown primary. ***, P < 0.001. GISTIC permutation analysis (C) associated MYC amplification (chromosome 8q) with a nonresponsive phenotype, as well as chromosome 1 amplification with a responsive phenotype. Horizontal black dashed lines in top two panels of C indicate significance (P < 0.05). NR, nonresponse; R, response. D, Significant amplifications on chromosomes 1 and 8 from C with COSMIC genes labeled.
Figure 5.
Tissue-level amplifications and deletions associated with response to ICI. A large proportion of samples underwent WGD (A), with successive WGD events associated with increasing wGII (B). Letters in brackets indicate melanoma subtype: A = acral, C = cutaneous, M = mucosal, U = melanoma of unknown primary. ***, P < 0.001. GISTIC permutation analysis (C) associated MYC amplification (chromosome 8q) with a nonresponsive phenotype, as well as chromosome 1 amplification with a responsive phenotype. Horizontal black dashed lines in top two panels of C indicate significance (P < 0.05). NR, nonresponse; R, response. D, Significant amplifications on chromosomes 1 and 8 from C with COSMIC genes labeled.
Figure 6. Identification of a likely non–whole-genome–doubled clone that was not identifiable from bulk sequencing data in CRUKP2567. Clonal phylogeny of CRUKP2567 (A), with anatomic diagram (B) based on bulk SNVs mapping samples to clones on the tree. The scale indicates the number of mutations. C, MEDICC2 copy-number tree for bulk exome samples from CRUKP2567. The cluster highlighted in blue has undergone one WGD event, while the other nonhighlighted cluster, containing brain metastasis and primary tumor samples, has not. Diamonds indicate the samples for which bulk copy-number profiles are displayed in Supplementary Fig. S23. D, Hierarchical clustering tree containing all single cells (SS) from FACs-high-ploidy sorting (FH) and FACs-low-ploidy sorting (FL), as well as WGD bulk samples and non-WGD bulk samples. E, Radiologic images of the patient indicating thorax upon initiation of stage IV disease and complete extracranial response to BRAF inhibitor, followed by rapid recolonization of the thorax with resistant clones (left to right). BR, brain; BRAFi, BRAF inhibitor; CR, complete response; DI, diaphragm; LN, lymph node; LU, lung; MEKi, MEK inhibitor; PC, pericardium, PLFa, pleural fluid (archival); PR, primary.
Figure 6.
Identification of a likely non–whole-genome–doubled clone that was not identifiable from bulk sequencing data in CRUKP2567. Clonal phylogeny of CRUKP2567 (A), with anatomic diagram (B) based on bulk SNVs mapping samples to clones on the tree. The scale indicates the number of mutations. C, MEDICC2 copy-number tree for bulk exome samples from CRUKP2567. The cluster highlighted in blue has undergone one WGD event, while the other nonhighlighted cluster, containing brain metastasis and primary tumor samples, has not. Diamonds indicate the samples for which bulk copy-number profiles are displayed in Supplementary Fig. S23. D, Hierarchical clustering tree containing all single cells (SS) from FACs-high-ploidy sorting (FH) and FACs-low-ploidy sorting (FL), as well as WGD bulk samples and non-WGD bulk samples. E, Radiologic images of the patient indicating thorax upon initiation of stage IV disease and complete extracranial response to BRAF inhibitor, followed by rapid recolonization of the thorax with resistant clones (left to right). BR, brain; BRAFi, BRAF inhibitor; CR, complete response; DI, diaphragm; LN, lymph node; LU, lung; MEKi, MEK inhibitor; PC, pericardium, PLFa, pleural fluid (archival); PR, primary.

Comment in

References

    1. Robert C, Grob JJ, Stroyakovskiy D, Karaszewska B, Hauschild A, Levchenko E, et al. . Five-year outcomes with dabrafenib plus trametinib in metastatic melanoma. N Engl J Med 2019;381:626–36. - PubMed
    1. Spain L, Larkin J, Turajlic S. New survival standards for advanced melanoma. Br J Cancer 2020;122:1275–6. - PMC - PubMed
    1. Larkin J, Chiarion-Sileni V, Gonzalez R, Grob JJ, Rutkowski P, Lao CD, et al. . Five-year survival with combined nivolumab and ipilimumab in advanced melanoma. N Engl J Med 2019;381:1535–46. - PubMed
    1. Akbani R, Akdemir KC, Aksoy BA, Albert M, Ally A, Amin SB, et al. . Genomic classification of cutaneous melanoma. Cell 2015;161:1681–96. - PMC - PubMed
    1. Hayward NK, Wilmott JS, Waddell N, Johansson PA, Field MA, Nones K, et al. . Whole-genome landscapes of major melanoma subtypes. Nature 2017;545:175–80. - PubMed

Publication types