. 2023 May 10;43(19):3567-3581.
doi: 10.1523/JNEUROSCI.1829-22.2023. Epub 2023 Mar 28.

Single Systemic Administration of a Gene Therapy Leading to Disease Treatment in Metachromatic Leukodystrophy Arsa Knock-Out Mice

Affiliations

Single Systemic Administration of a Gene Therapy Leading to Disease Treatment in Metachromatic Leukodystrophy Arsa Knock-Out Mice

Thia St Martin et al. J Neurosci. .

Abstract

Metachromatic leukodystrophy (MLD) is a rare, inherited, demyelinating lysosomal storage disorder caused by mutations in the arylsulfatase-A gene (ARSA). In patients, levels of functional ARSA enzyme are diminished and lead to deleterious accumulation of sulfatides. Herein, we demonstrate that intravenous administration of HSC15/ARSA restored the endogenous murine biodistribution of the corresponding enzyme, and overexpression of ARSA corrected disease biomarkers and ameliorated motor deficits in Arsa KO mice of either sex. In treated Arsa KO mice, when compared with intravenously administered AAV9/ARSA, significant increases in brain ARSA activity, transcript levels, and vector genomes were observed with HSC15/ARSA Durability of transgene expression was established in neonate and adult mice out to 12 and 52 weeks, respectively. Levels and correlation between changes in biomarkers and ARSA activity required to achieve functional motor benefit was also defined. Finally, we demonstrated blood-nerve, blood-spinal and blood-brain barrier crossing as well as the presence of circulating ARSA enzyme activity in the serum of healthy nonhuman primates of either sex. Together, these findings support the use of intravenous delivery of HSC15/ARSA-mediated gene therapy for the treatment of MLD.SIGNIFICANCE STATEMENT Herein, we describe the method of gene therapy adeno-associated virus (AAV) capsid and route of administration selection leading to an efficacious gene therapy in a mouse model of metachromatic leukodystrophy. We demonstrate the therapeutic outcome of a new naturally derived clade F AAV capsid (AAVHSC15) in a disease model and the importance of triangulating multiple end points to increase the translation into higher species via ARSA enzyme activity and biodistribution profile (with a focus on the CNS) with that of a key clinically relevant biomarker.

Keywords: AAVHSC; biomarker; gene therapy; metachromatic leukodystrophy; motor deficit; translation.


Figures

Figure 1.
Figure 1.
HSC15/ARSA biodistribution following intravenous administration in Arsa KO mice. A–B, Comparison of anti-ARSA biodistribution in brain, spinal cord, and DRG following a 4 week, single intravenous administration of HSC15/ARSA or AAV9/ARSA at 4E + 13 vg/kg compared with endogenous murine Arsa in adult WT mice. Individual points represent individual male mice (n = 4/group). C–E, Resulting respective vgs (C; mean ± SEM; unpaired t test with Kolmogorov–Smirnov correction; *p < 0.05), copies of ARSA transcript (D; mean ± SEM; unpaired t test; *p < 0.05), and brain ARSA activity (E; mean ± SEM; unpaired t test; ***p ≤ 0.0001) at study termination. Scale bars: 1000 µm (brain), 250 µm (spinal cord), and 100 µm (DRG; n = 2 repeats; *p < 0.05; ***p ≤ 0.0001; mean ± SEM). F, Anti-ARSA biodistribution in neuronal and glial-like profiles in the motor cortex (neurons and astrocytes), cerebellum (Purkinje cells), axonal tract (fornix; oligodendrocytes), choroid plexus (ependymal cells), and spinal cord (motoneurons and astrocytes). Representative images for each dosed group are shown. Scale bars: 125 µm (motor cortex), 50 µm (all other regions).
Figure 2.
Figure 2.
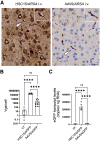
HSC15/ARSA transduces murine microglia in vivo and human microglia cells in vitro. A, Insets and white arrowheads, Anti-ARSA biodistribution detected in microglial-like profiles in the motor cortex of HSC15/ARSA and AAV9/ARSA intravenous-treated Arsa KO mice at 4E + 13 vg/kg, as well as in neuronal-like profiles in HSC15/ARSA. Representative images for each dosed group are shown. Scale bar, 25 µm. B, HSC15/eGFP vgs in human microglia cell culture 72 h post-transduction (MOI 100 K) when compared with control untransduced cells and AAV9/eGFP-treated cells (mean ± SEM, 1-way ANOVA analysis, ****p ≤ 0.0001; ns = not significant; n = 3 repeats). C, Corresponding HSC15/eGFP transcript levels in human microglia cell culture when compared with control untransduced cells and AAV9/eGFP-treated cells (mean ± SEM, 1-way ANOVA analysis, ****p ≤ 0.0001; ns; n = 3 repeats).
Figure 3.
Figure 3.
Biodistribution of human ARSA protein following either intravenous or intrathecal administration of HSC15/ARSA. A, Anti-ARSA biodistribution in brain tissue following a 4 week, single intravenous (n = 4/group) or intrathecal (n = 4/group) administration of HSC15/ARSA at 4E + 13 vg/kg or 4E + 12 total vgs to adult male Arsa KO mice, respectively. Adult male WT and vehicle-treated Arsa KO mice were processed identically and shown as controls. Scale bars: 1000 µm. B, Anti-ARSA biodistribution in liver tissue following a 4 week, single intravenous or intrathecal administration of HSC15/ARSA in Arsa KO mice. Scale bars, 50 µm. C, Anti-ARSA biodistribution in neuronal and glial-like profiles in the motor and sensory cortex (neurons and astrocytes), hippocampus, putamen, and cerebellum (Purkinje cells). Representative images for each dosed group are shown. Scale bars: 125 µm (cortex), 50 µm (all other regions).
Figure 4.
Figure 4.
Dose–response in ARSA protein detection across the CNS 4 weeks after single intravenous administration of HSC15/ARSA in adult Arsa KO mice. A–C, Anti-ARSA biodistribution in brain (A–B), spinal cord, and (C) tissue across doses ranging from 0.5E + 13 to 6E + 13 vg/kg. Individual points represent individual mice (n = 5/group; males). Higher magnification of motor cortex tissue (B) highlights transduction in the brain at the lowest doses evaluated. Blue arrowheads point to microglial-like profiles. Representative images for each dosed group are shown. Scale bars: 2500 µm (low-magnification brain), 50 µm (high-magnification brain) and 250 µm (spinal cord). D, Anti-ARSA biodistribution in peripheral organs of the gastrointestinal tract following intravenous dosing of HSC15/ARSA at 4E + 13 vg/kg. Representative images for each dosed group are shown. Scale bar, 100 µm. E, Resulting ARSA activity levels in duodenum, colon, and liver (mean ± SEM). F, Resulting ARSA activity levels in serum of HSC15/ARSA-treated Arsa KO mice in comparison with age-matched vehicle-treated WT and Arsa-KO mice (mean ± SEM). Extended Data Figure 4-1 contains more information.
Figure 5.
Figure 5.
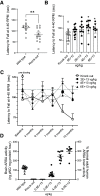
Motor improvement in Arsa KO mice following a single intravenous administration of HSC15/ARSA. A, Significant motor deficit was detected in vehicle-treated adult Arsa KO mice at 9 months of age when compared with age-matched WT littermates (mean ± SEM; unpaired 2-tailed student t test; *p < 0.01). B, C, Rescue of motor deficit in HSC15/ARSA-treated Arsa KO mice at all doses assessed, where B corresponds to the last time point tested (10 months) in C. Statistical significance was achieved at doses of 4 and 6E + 13 vg/kg (mean ± SEM; 2-way ANOVA mixed-effect analysis with multiple-comparison Dunnett's test; *p < 0.05). Lower dose evaluated was excluded from graph for clarity purposes. Gray dashed line corresponds to the average latency to fall of the WT group across the last three reads. Individual points represent individual mice (n = 8–12/group). D, Corresponding brain Arsa/ARSA activity levels in vehicle- and HSC15/ARSA-treated Arsa KO mice at study termination. 100% on the y-axis (right) represents normal levels of ARSA activity in brain samples of normal adult human samples.
Figure 6.
Figure 6.
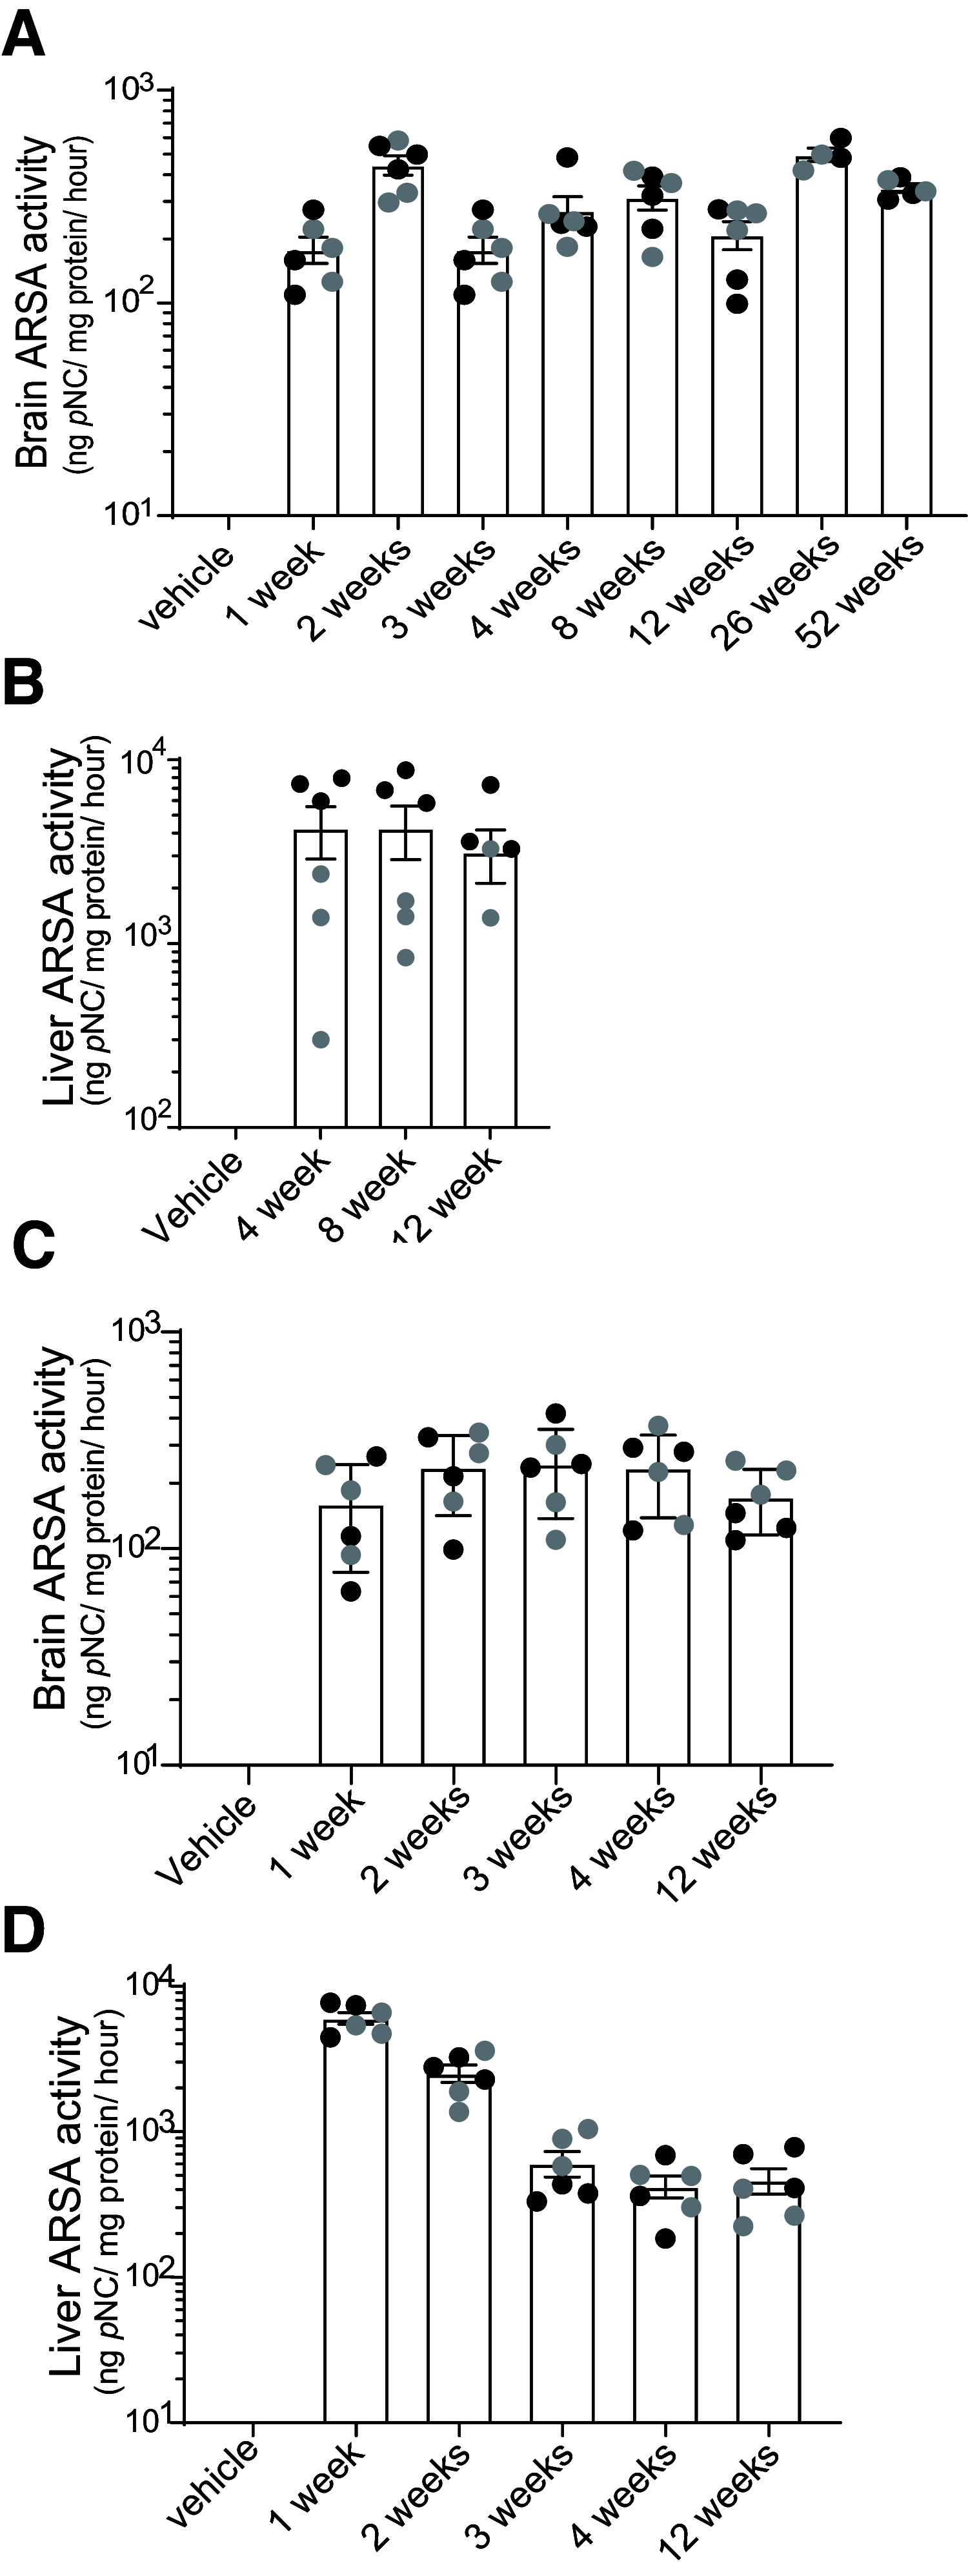
Durability of ARSA activity in brain and liver tissue in adult and neonate Arsa KO mice. A, B, Brain and liver tissue of adult Arsa KO mice following intravenous administration of HSC15/ARSA at 4E + 13 vg/kg, respectively. Males are depicted as black circles and females as gray circles. Individual points represent individual mice (n = 6/group, equal number of males and females). Gender differences in liver ARSA activity were observed in adult liver tissue at 4 and 8 weeks postdosing (*p ≤ 0.02). C, D, Brain and liver tissue of neonate Arsa KO mice following intravenous administration of HSC15/ARSA at 4E + 13 vg/kg. Males are depicted as black circles and females as gray circles. Individual points represent individual mice (n = 6/group, equal number of males and females). Extended Data Figure 6-1 contains more information.
Figure 7.
Figure 7.
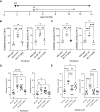
Rescue of neuronal sulfatide isoforms (C18:0 and C18:1) across the CNS axis in HSC15/ARSA-treated adult Arsa KO mice. B–E, Combined schematic illustrating the two age groups evaluated in separate studies. ET (B, C) was dosed at 6–8 weeks of age (at the onset of Lamp1 accumulation in the brain; Hess et al., 1996), and the study was conducted 52 weeks out, when the mice reached ∼14 months of age. The LT (D, E) group were dosed at ∼4.5 months of age (after the reported accumulation of sulfatides in the brain; Hess et al., 1996), and the study was conducted 24 weeks out, when the mice reached 11 months of age. B, C, Fifty-two weeks postintravenous administration of HSC15/ARSA at 4E + 13 vg/kg, neuronal sulfatide levels (C18:0 and C18:1) were significantly reduced, down to WT levels in (A) forebrain (**p ≤ 0.01) and (B) hindbrain tissue (**p ≤ 0.01, ***p ≤ 0.001; ns, Not significant; mean ± SEM; ordinary 1-way ANOVA with Tukey's multiple-comparison test). Individual points represent individual male and female mice (n = 5–6/group), where forebrain and hindbrain values were obtained from each mouse in the study. D, E, Twenty-four weeks postdosing of HSC15/ARSA (at 0.5 E + 13 or 4E + 13 vg/kg) in adult male Arsa KO mice, neuronal sulfatide levels (C18:0 and C18:1) were reduced to WT levels in (D) forebrain tissue at a dose of 4E + 13 vg/kg (C18:0, **p ≤ 0.01; ****p ≤ 0.0001 C18:1, *p ≤ 0.05; **p ≤ 0.01; unlabeled comparisons, ns) but ns at 0.5E + 13 vg/kg. In spinal cord tissue (E), neuronal sulfatide levels were substantially ameliorated at both doses, with a greater impact (full rescue) of C18:1 over C18:0 (C18:0, *p < 0.05, **p ≤ 0.01, ****p ≤ 0.0001; C18:1, ****p ≤ 0.0001; unlabeled comparisons were not ns; mean ± SEM; ordinary 1-way ANOVA with Tukey's multiple-comparison test). Individual points represent individual mice (n = 8–10/group), where forebrain and spinal cord values were obtained from each mouse on the study. Extended Data Figure 7-1 contains more information.
Figure 8.
Figure 8.
ARSA protein immunofluorescence dose-dependent increases in ARSA protein in liver and brain tissue following a single intravenous injection in NHPs. A–F, ARSA was detected (via V5 tag) in neuronal and glial-like cell profiles in DRG (A), spinal cord (B), choroid plexus (C), motor cortex (D), cerebellum (E), and putamen (F). Anti-ARSA is in light blue, and anti-V5 is in magenta (n = 2 monkeys per group; HSC15/ARSA-V5 and vehicle). Representative images for each group are shown. Scale bars: A, 200 µm; B, 25 µm; C, F, 50 µm; D, E, G, 100 µm. H, In brain tissues collected from level 5b, ARSA protein levels in NHP-administered vehicle or HSC15/ARSA at 6E + 13 vg/kg and 1E + 14 vg/kg. Individual points represent individual monkeys (n = 4/group); where no symbol is shown, the value for the individual was below the limit of detection. I, Plasma levels of ARSA protein in NHPs following a single intravenous administration of HSC15/ARSA. Individual points represent individual monkeys (n = 4/group); where no symbol is shown, the value for the individual was below the limit of detection. NHPs in the vehicle group did not have ARSA protein levels above the limit of quantitation (30.0 ng/ml). J, Serum levels of ARSA enzyme activity in NHPs following a single intravenous administration of HSC15/ARSA. Bars indicate group mean, and individual points represent individual monkeys (n = 4/group); where no symbol is shown, the value for the individual was below the limit of detection. NHPs in the vehicle group did not have ARSA enzyme levels above the limit of quantitation (1.76 µg/ml). Extended Data Figures 8-1 and 8-2 contain more information.

References

    1. Abud EM, et al. . (2017) iPSC-derived human microglia-like cells to study neurological diseases. Neuron 94:278–293.e9. 10.1016/j.neuron.2017.03.042 - DOI - PMC - PubMed
    1. Almarzooqi S, Quadri A, Albawardi A (2018) Gallbladder polyps in metachromatic leukodystrophy. Fetal Pediatr Pathol 37:102–108. 10.1080/15513815.2018.1424277 - DOI - PubMed
    1. Audouard E, Oger V, Meha B, Cartier N, Sevin C, Piguet F (2021) Complete correction of brain and spinal cord pathology in metachromatic leukodystrophy mice. Front Mol Neurosci 14:677895. 10.3389/fnmol.2021.677895 - DOI - PMC - PubMed
    1. Barton NW, Brady RO, Dambrosia JM, Di Bisceglie AM, Doppelt SH, Hill SC, Mankin HJ, Murray GJ, Parker RI, Argoff CE (1991) Replacement therapy for inherited enzyme deficiency–macrophage-targeted glucocerebrosidase for Gaucher's disease. N Engl J Med 324:1464–1470. - PubMed
    1. Belur LR, Podetz-Pedersen KM, Tran TA, Mesick JA, Singh NM, Riedl M, Vulchanova L, Kozarsky KF, McIvor RS (2020) Intravenous delivery for treatment of mucopolysaccharidosis type I: a comparison of AAV serotypes 9 and rh10. Mol Genet Metab Rep 24:100604. 10.1016/j.ymgmr.2020.100604 - DOI - PMC - PubMed

Publication types

MeSH terms