. 2023 Apr 26;43(17):3042-3060.
doi: 10.1523/JNEUROSCI.2226-22.2023. Epub 2023 Mar 28.

Microglial Cytokines Mediate Plasticity Induced by 10 Hz Repetitive Magnetic Stimulation

Affiliations

Microglial Cytokines Mediate Plasticity Induced by 10 Hz Repetitive Magnetic Stimulation

Amelie Eichler et al. J Neurosci. .

Abstract

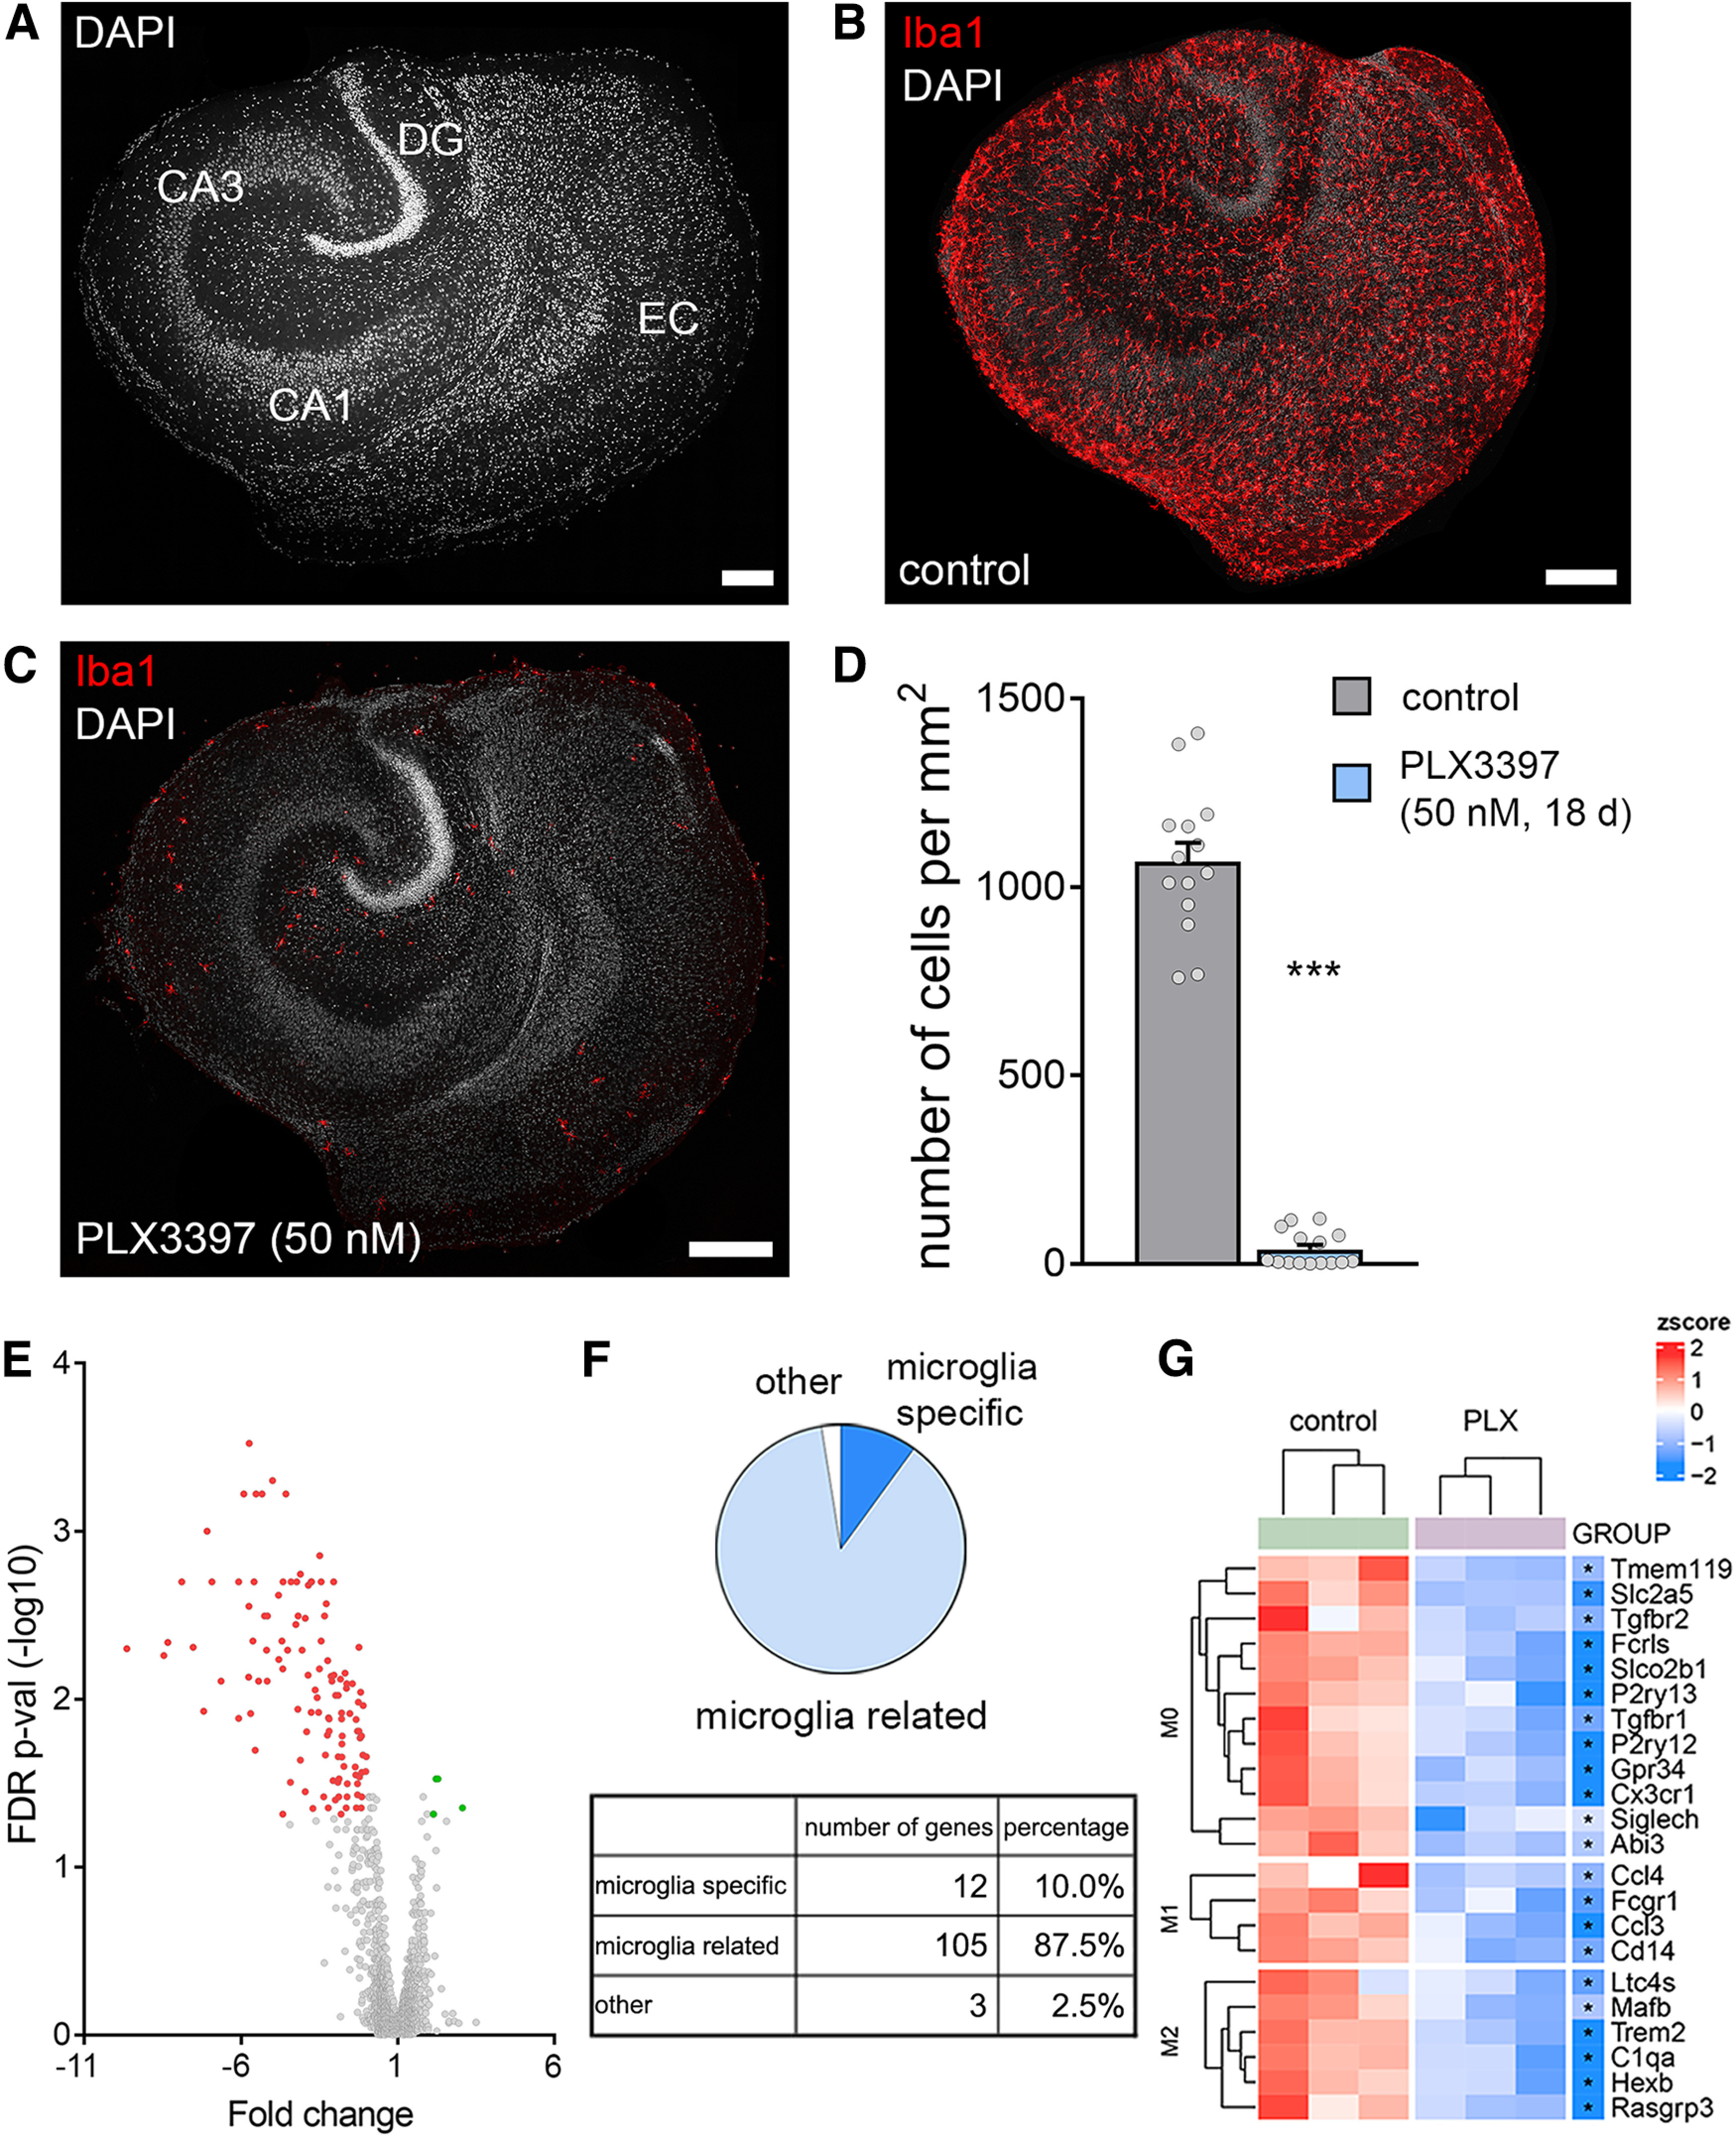
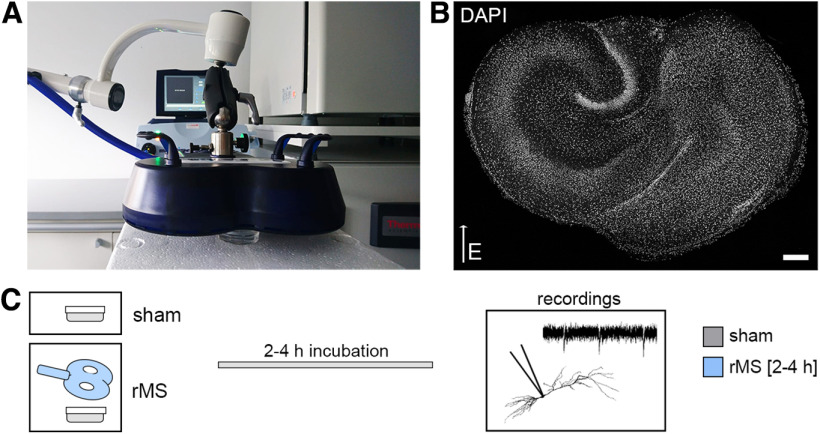
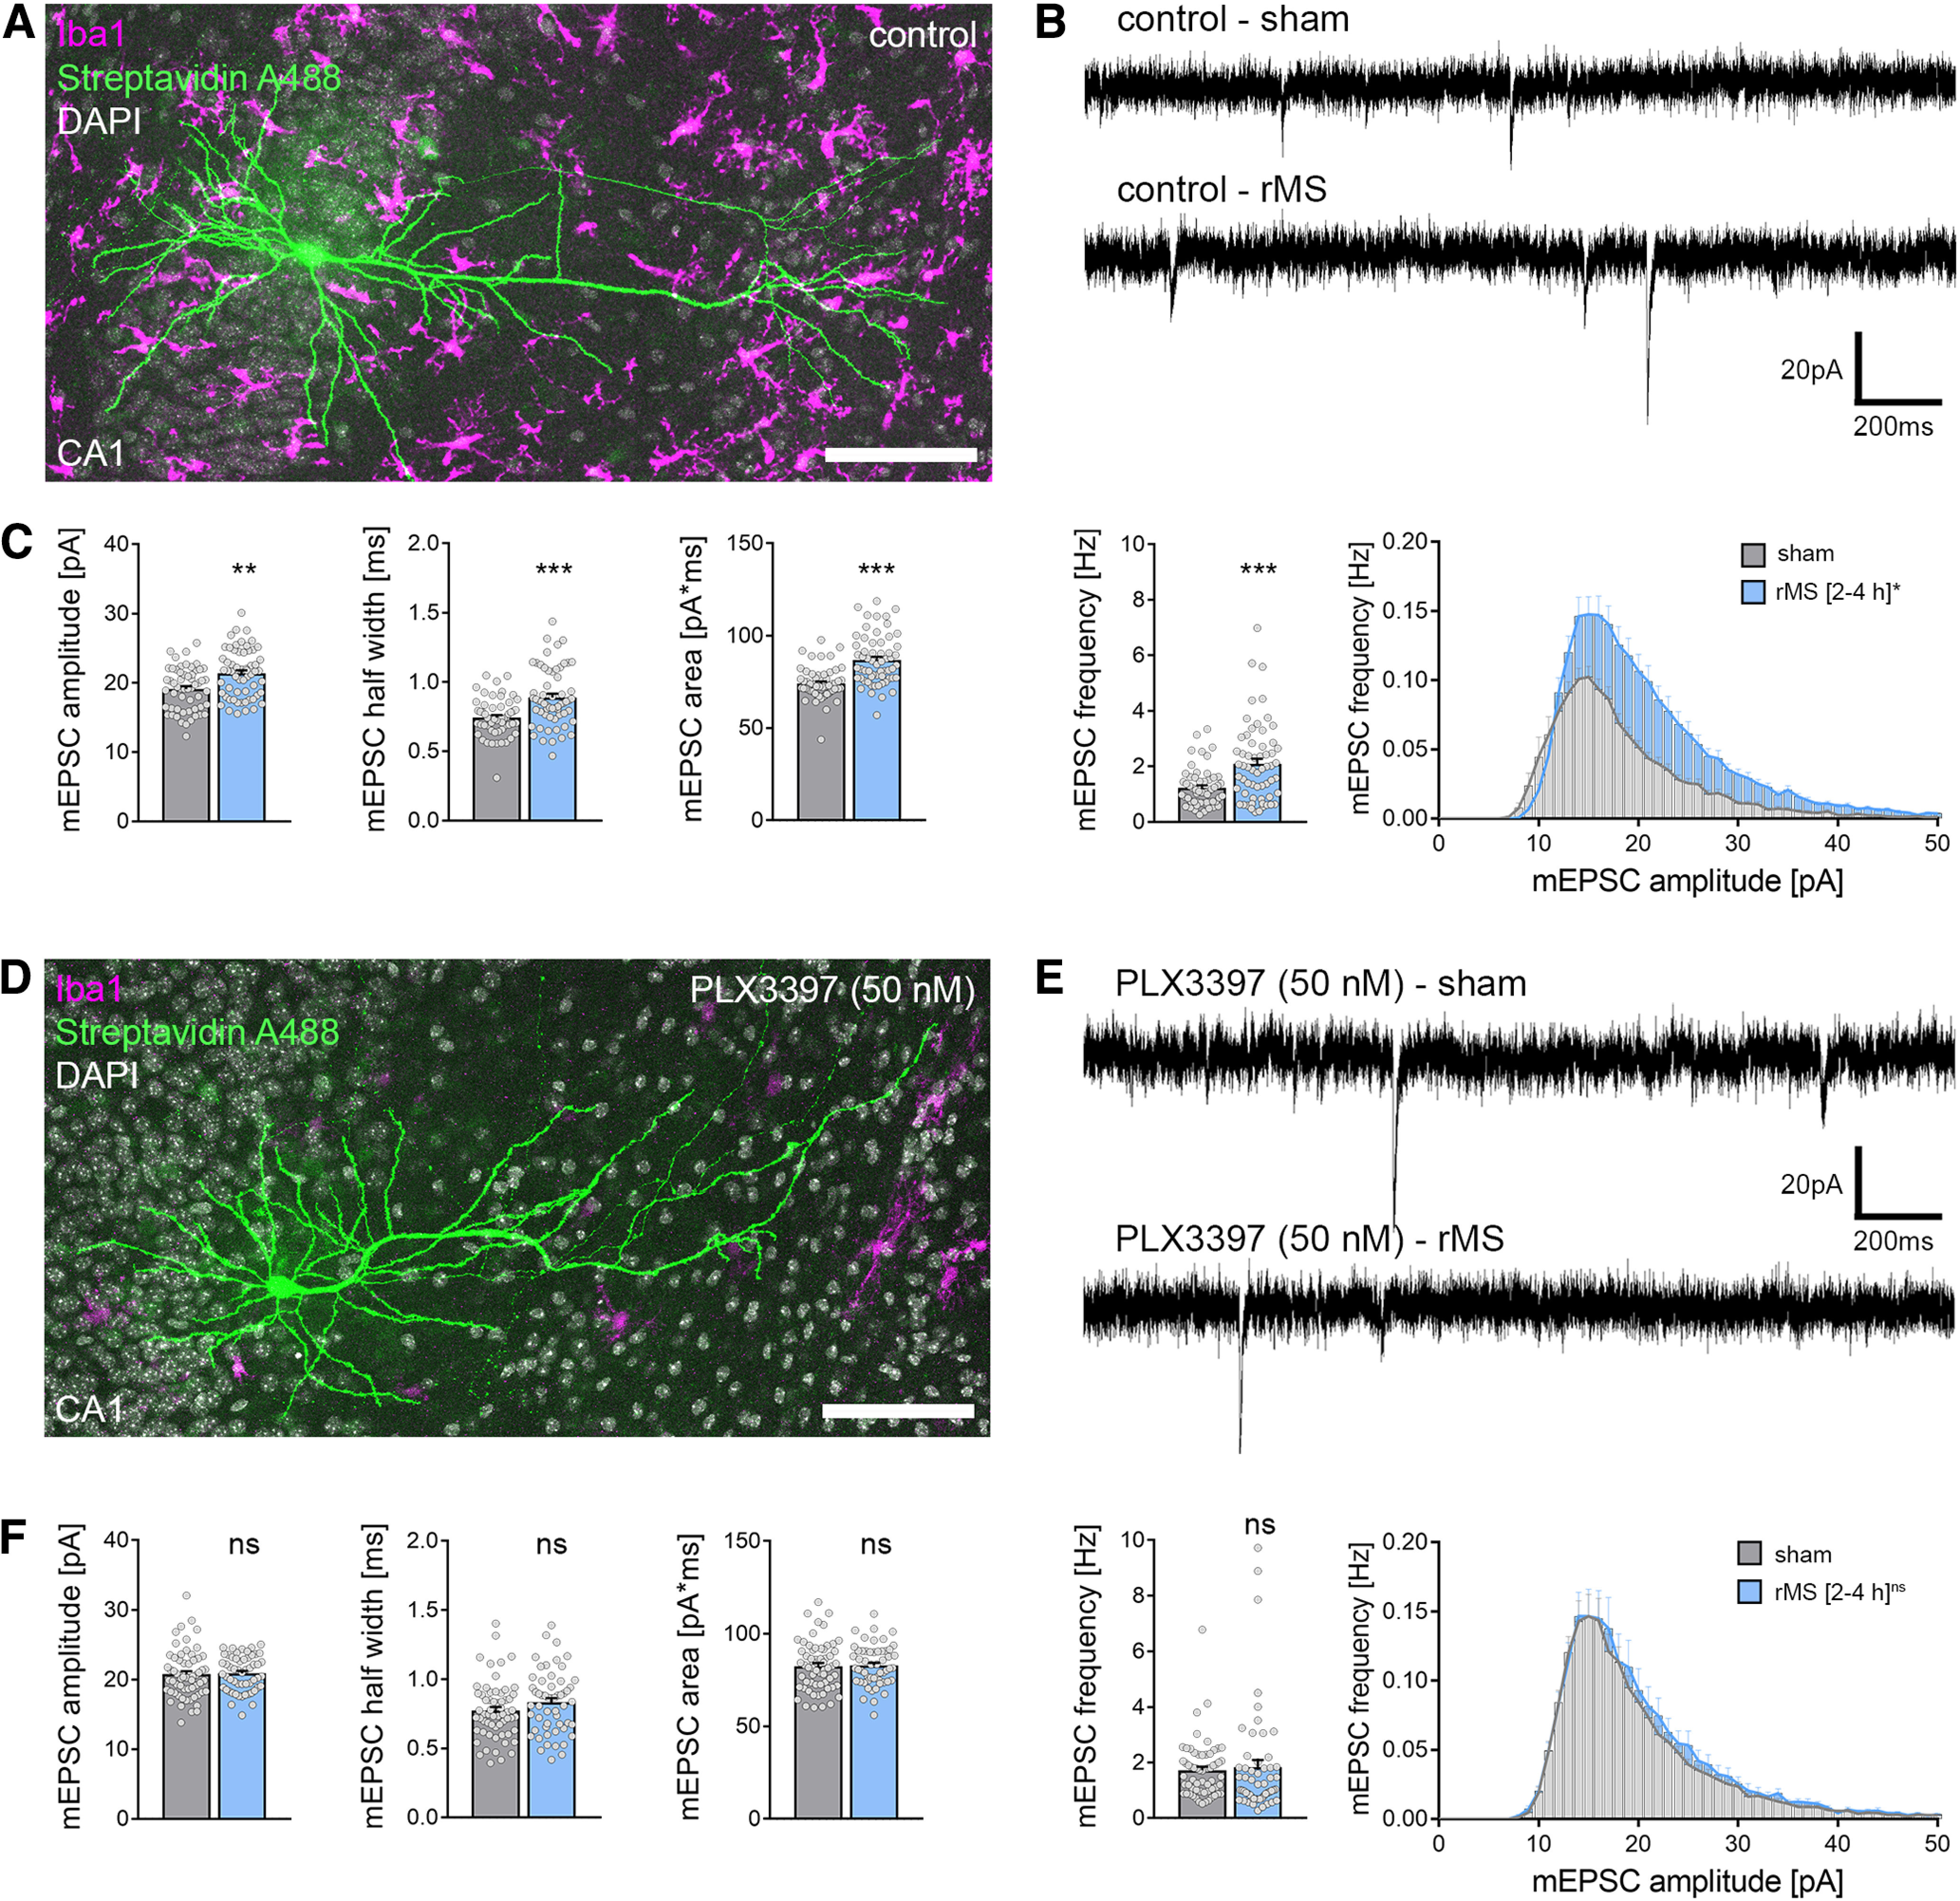
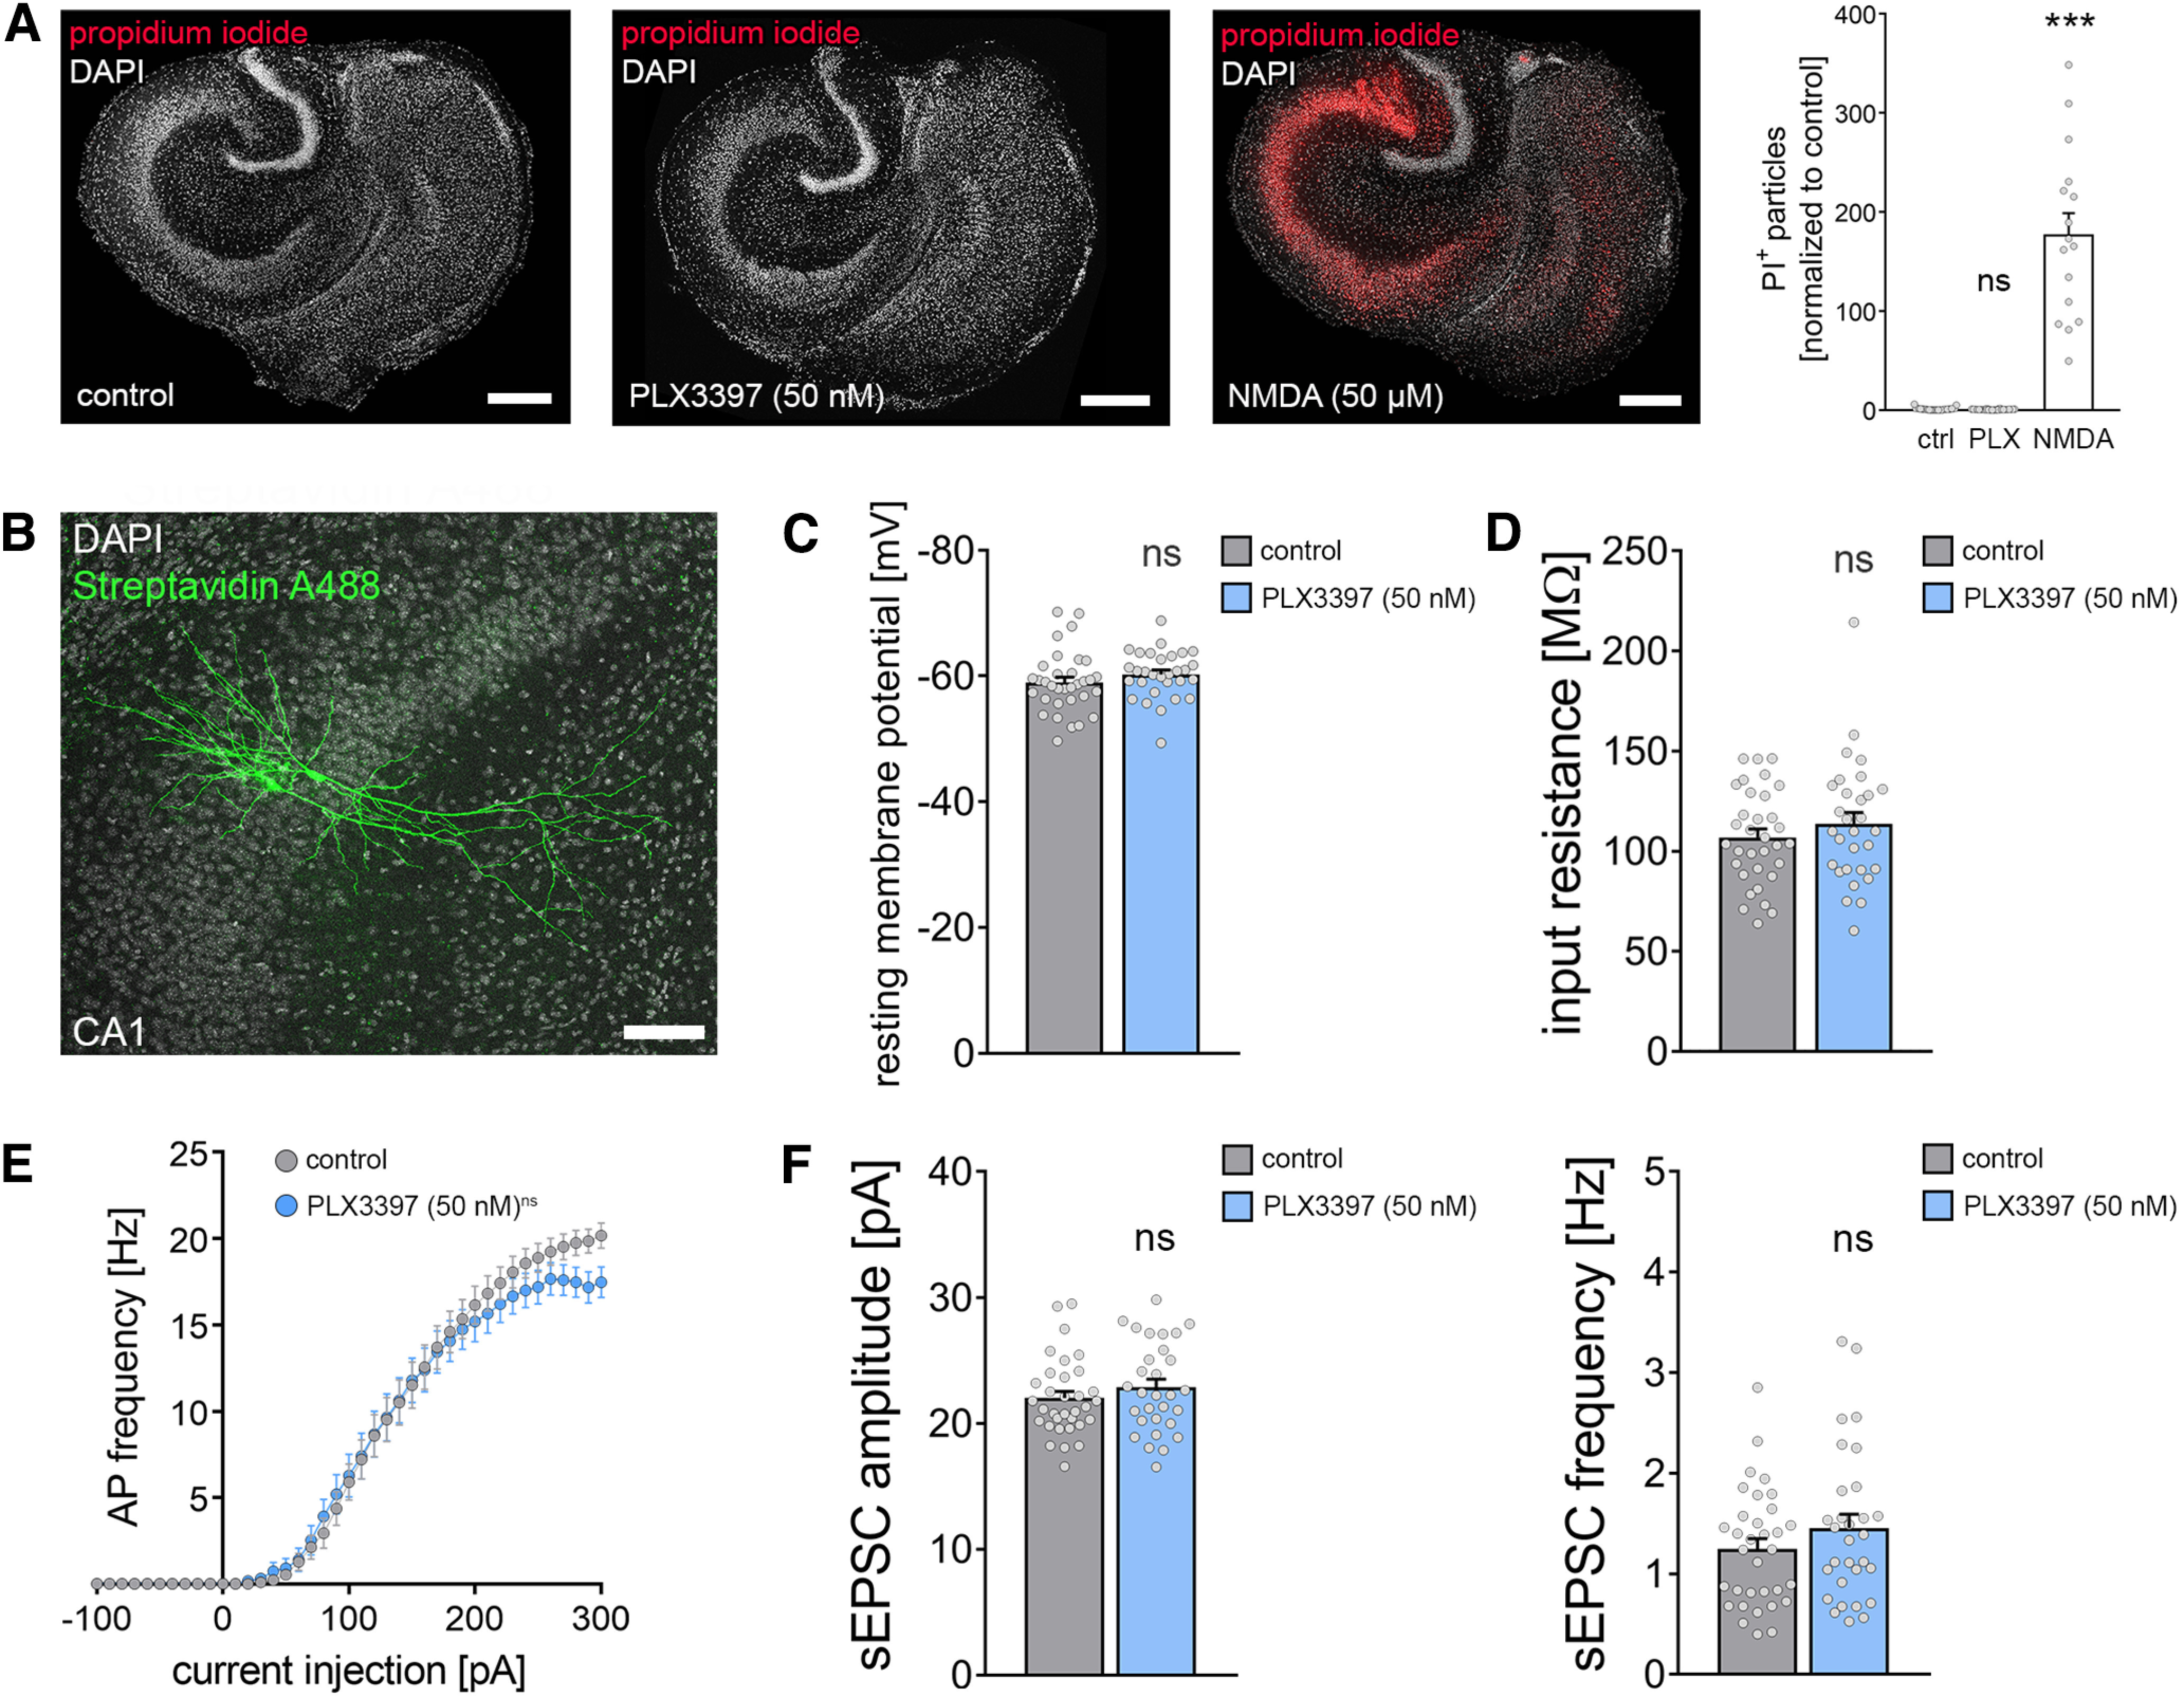
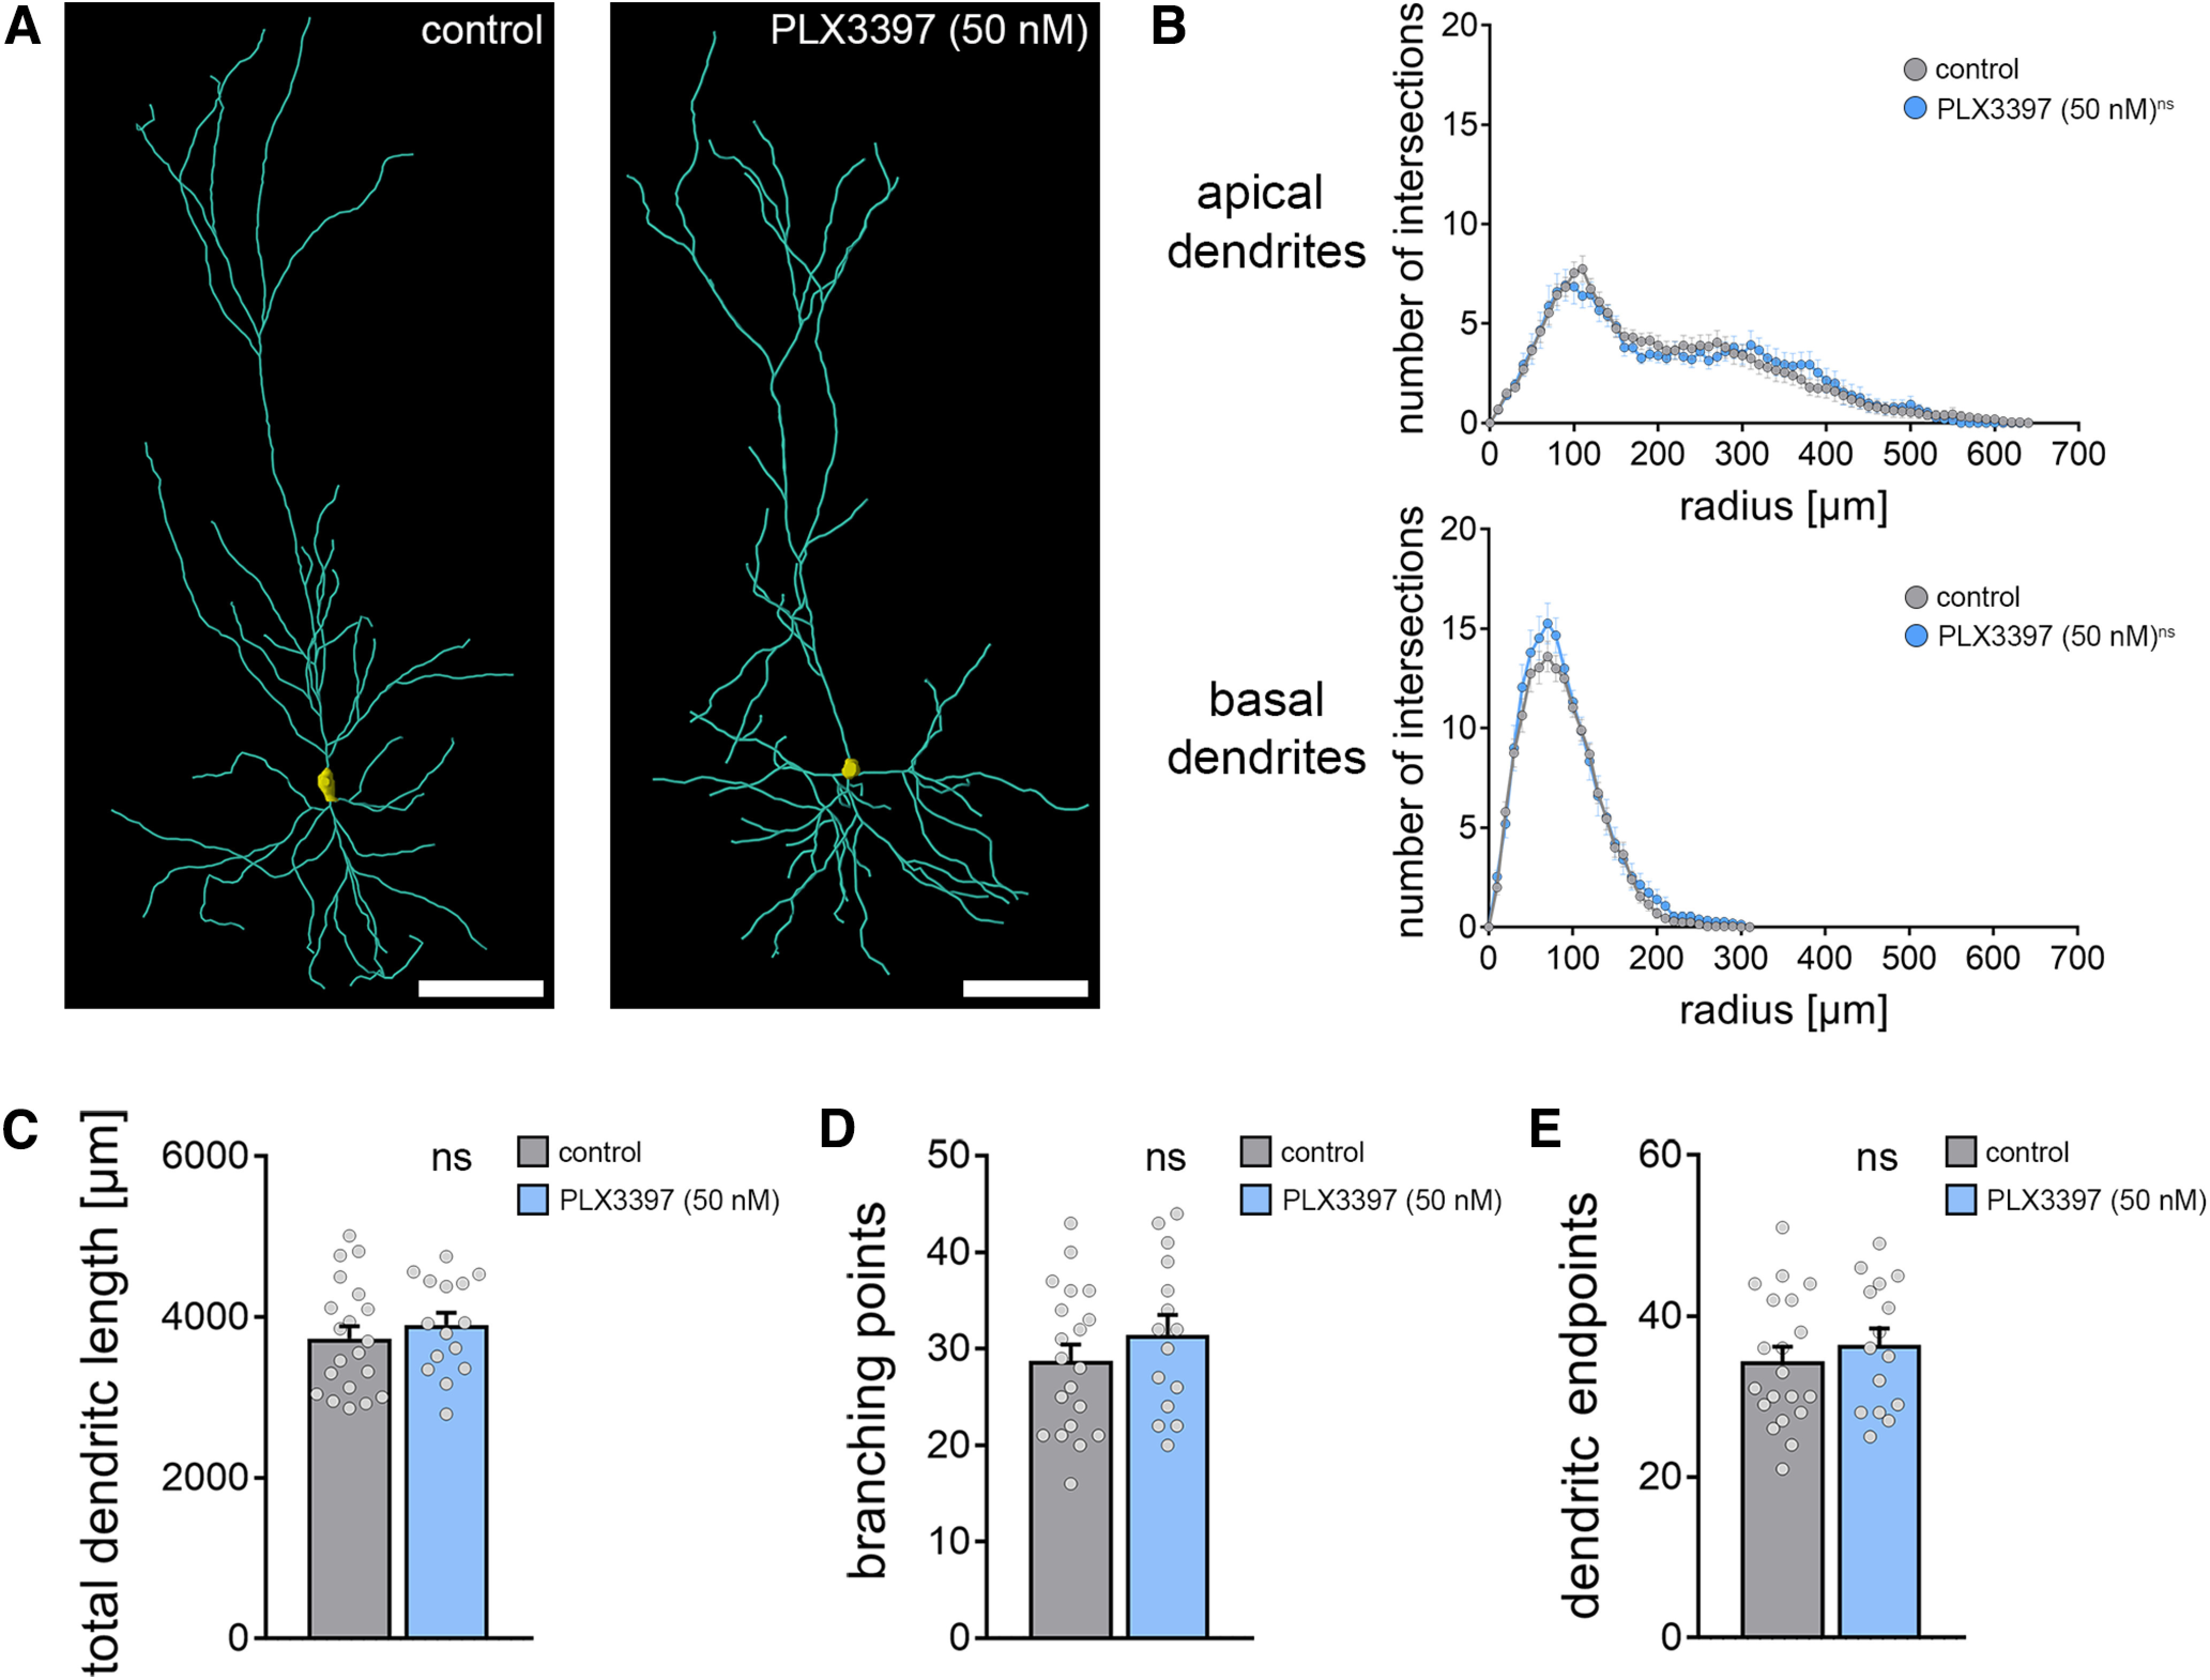
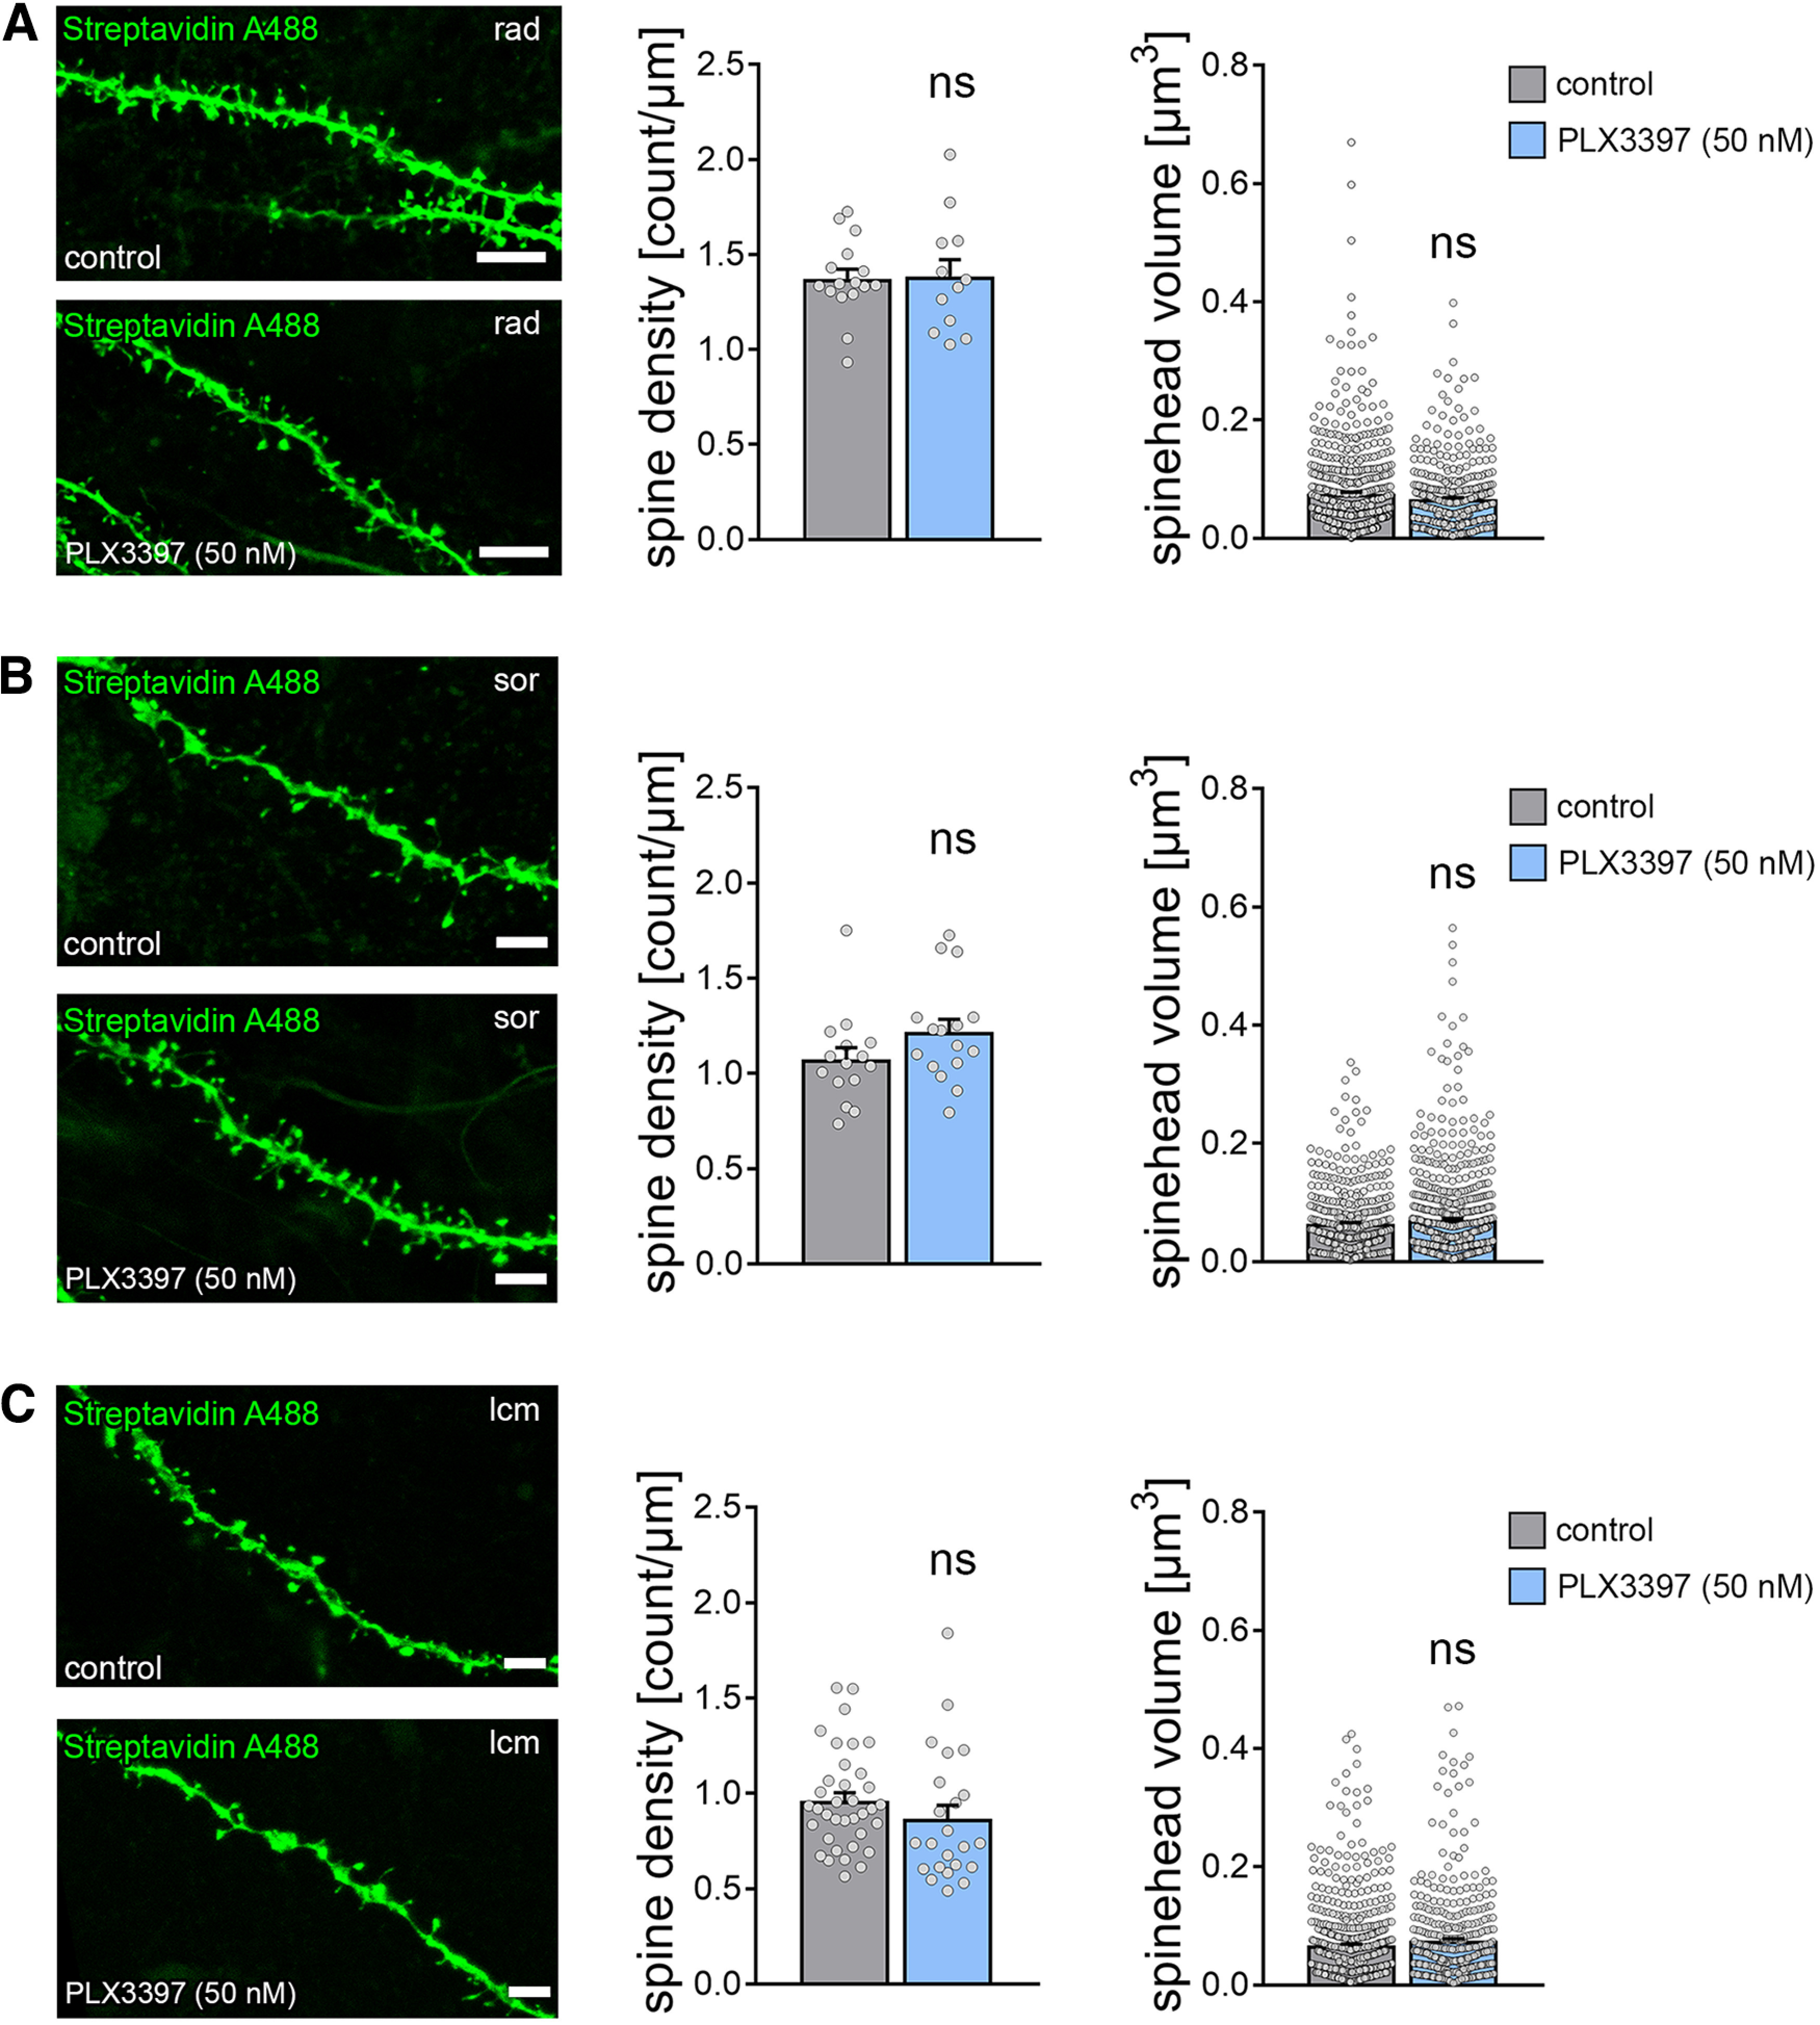
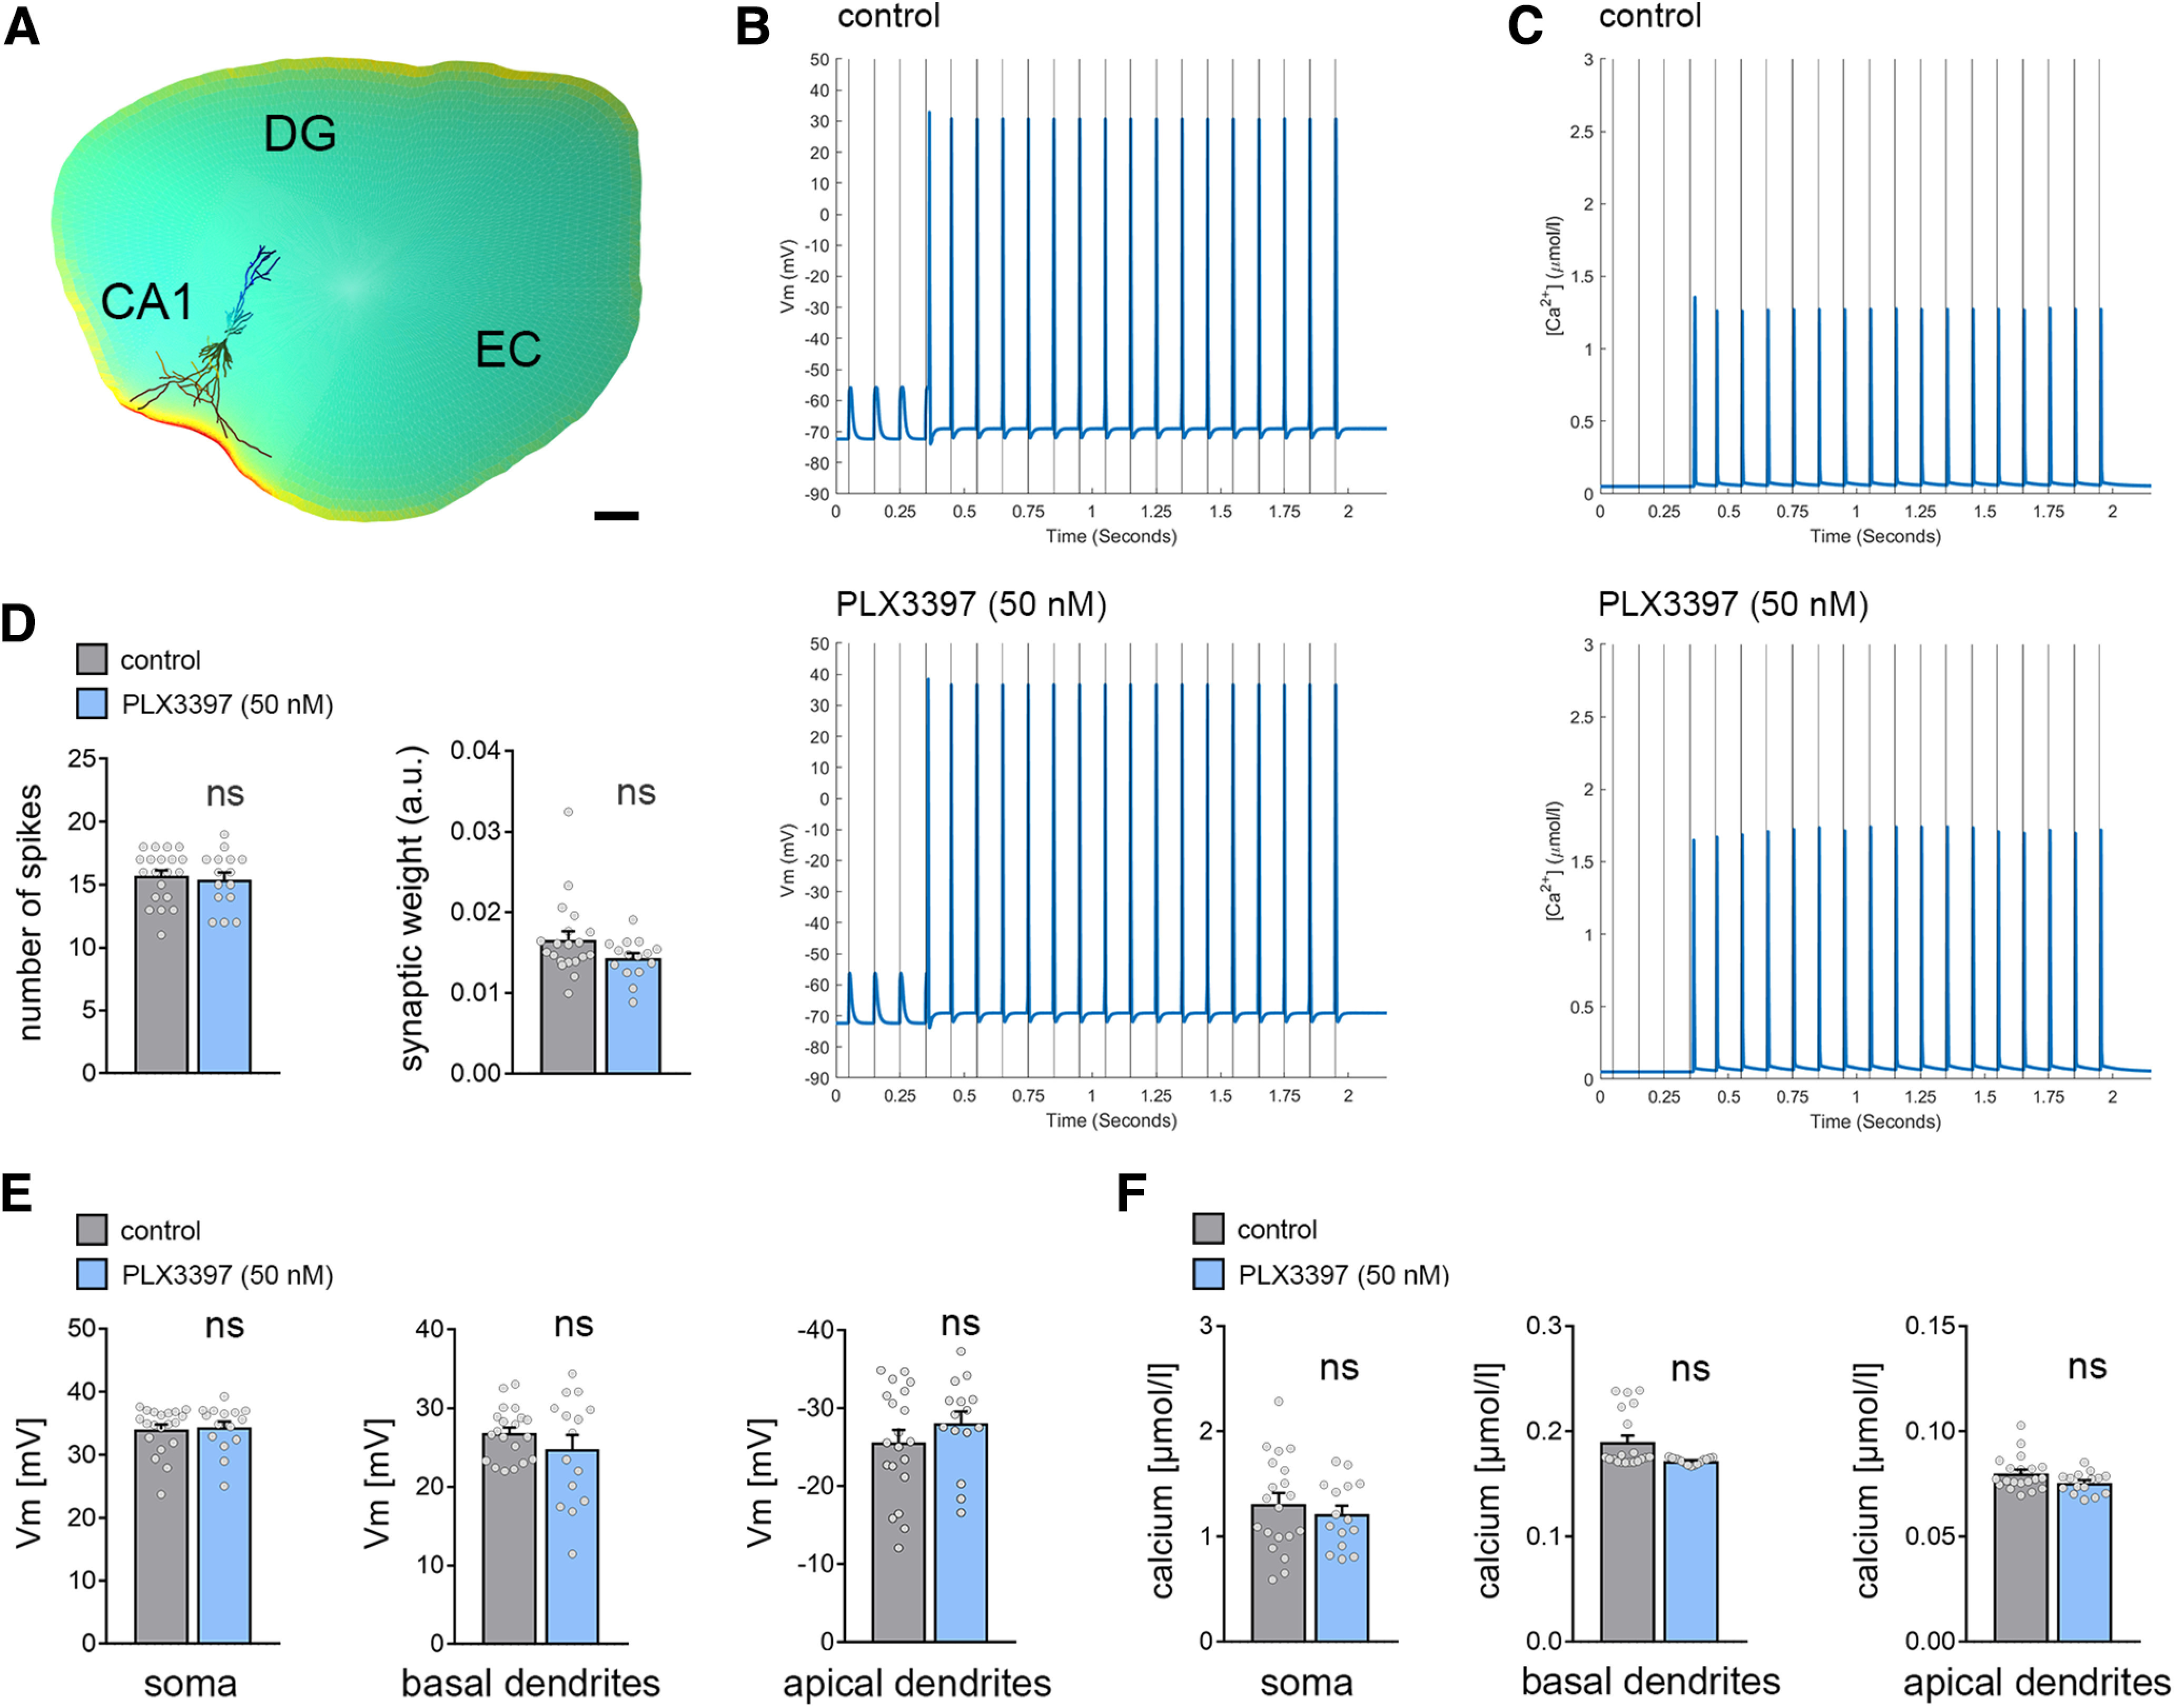
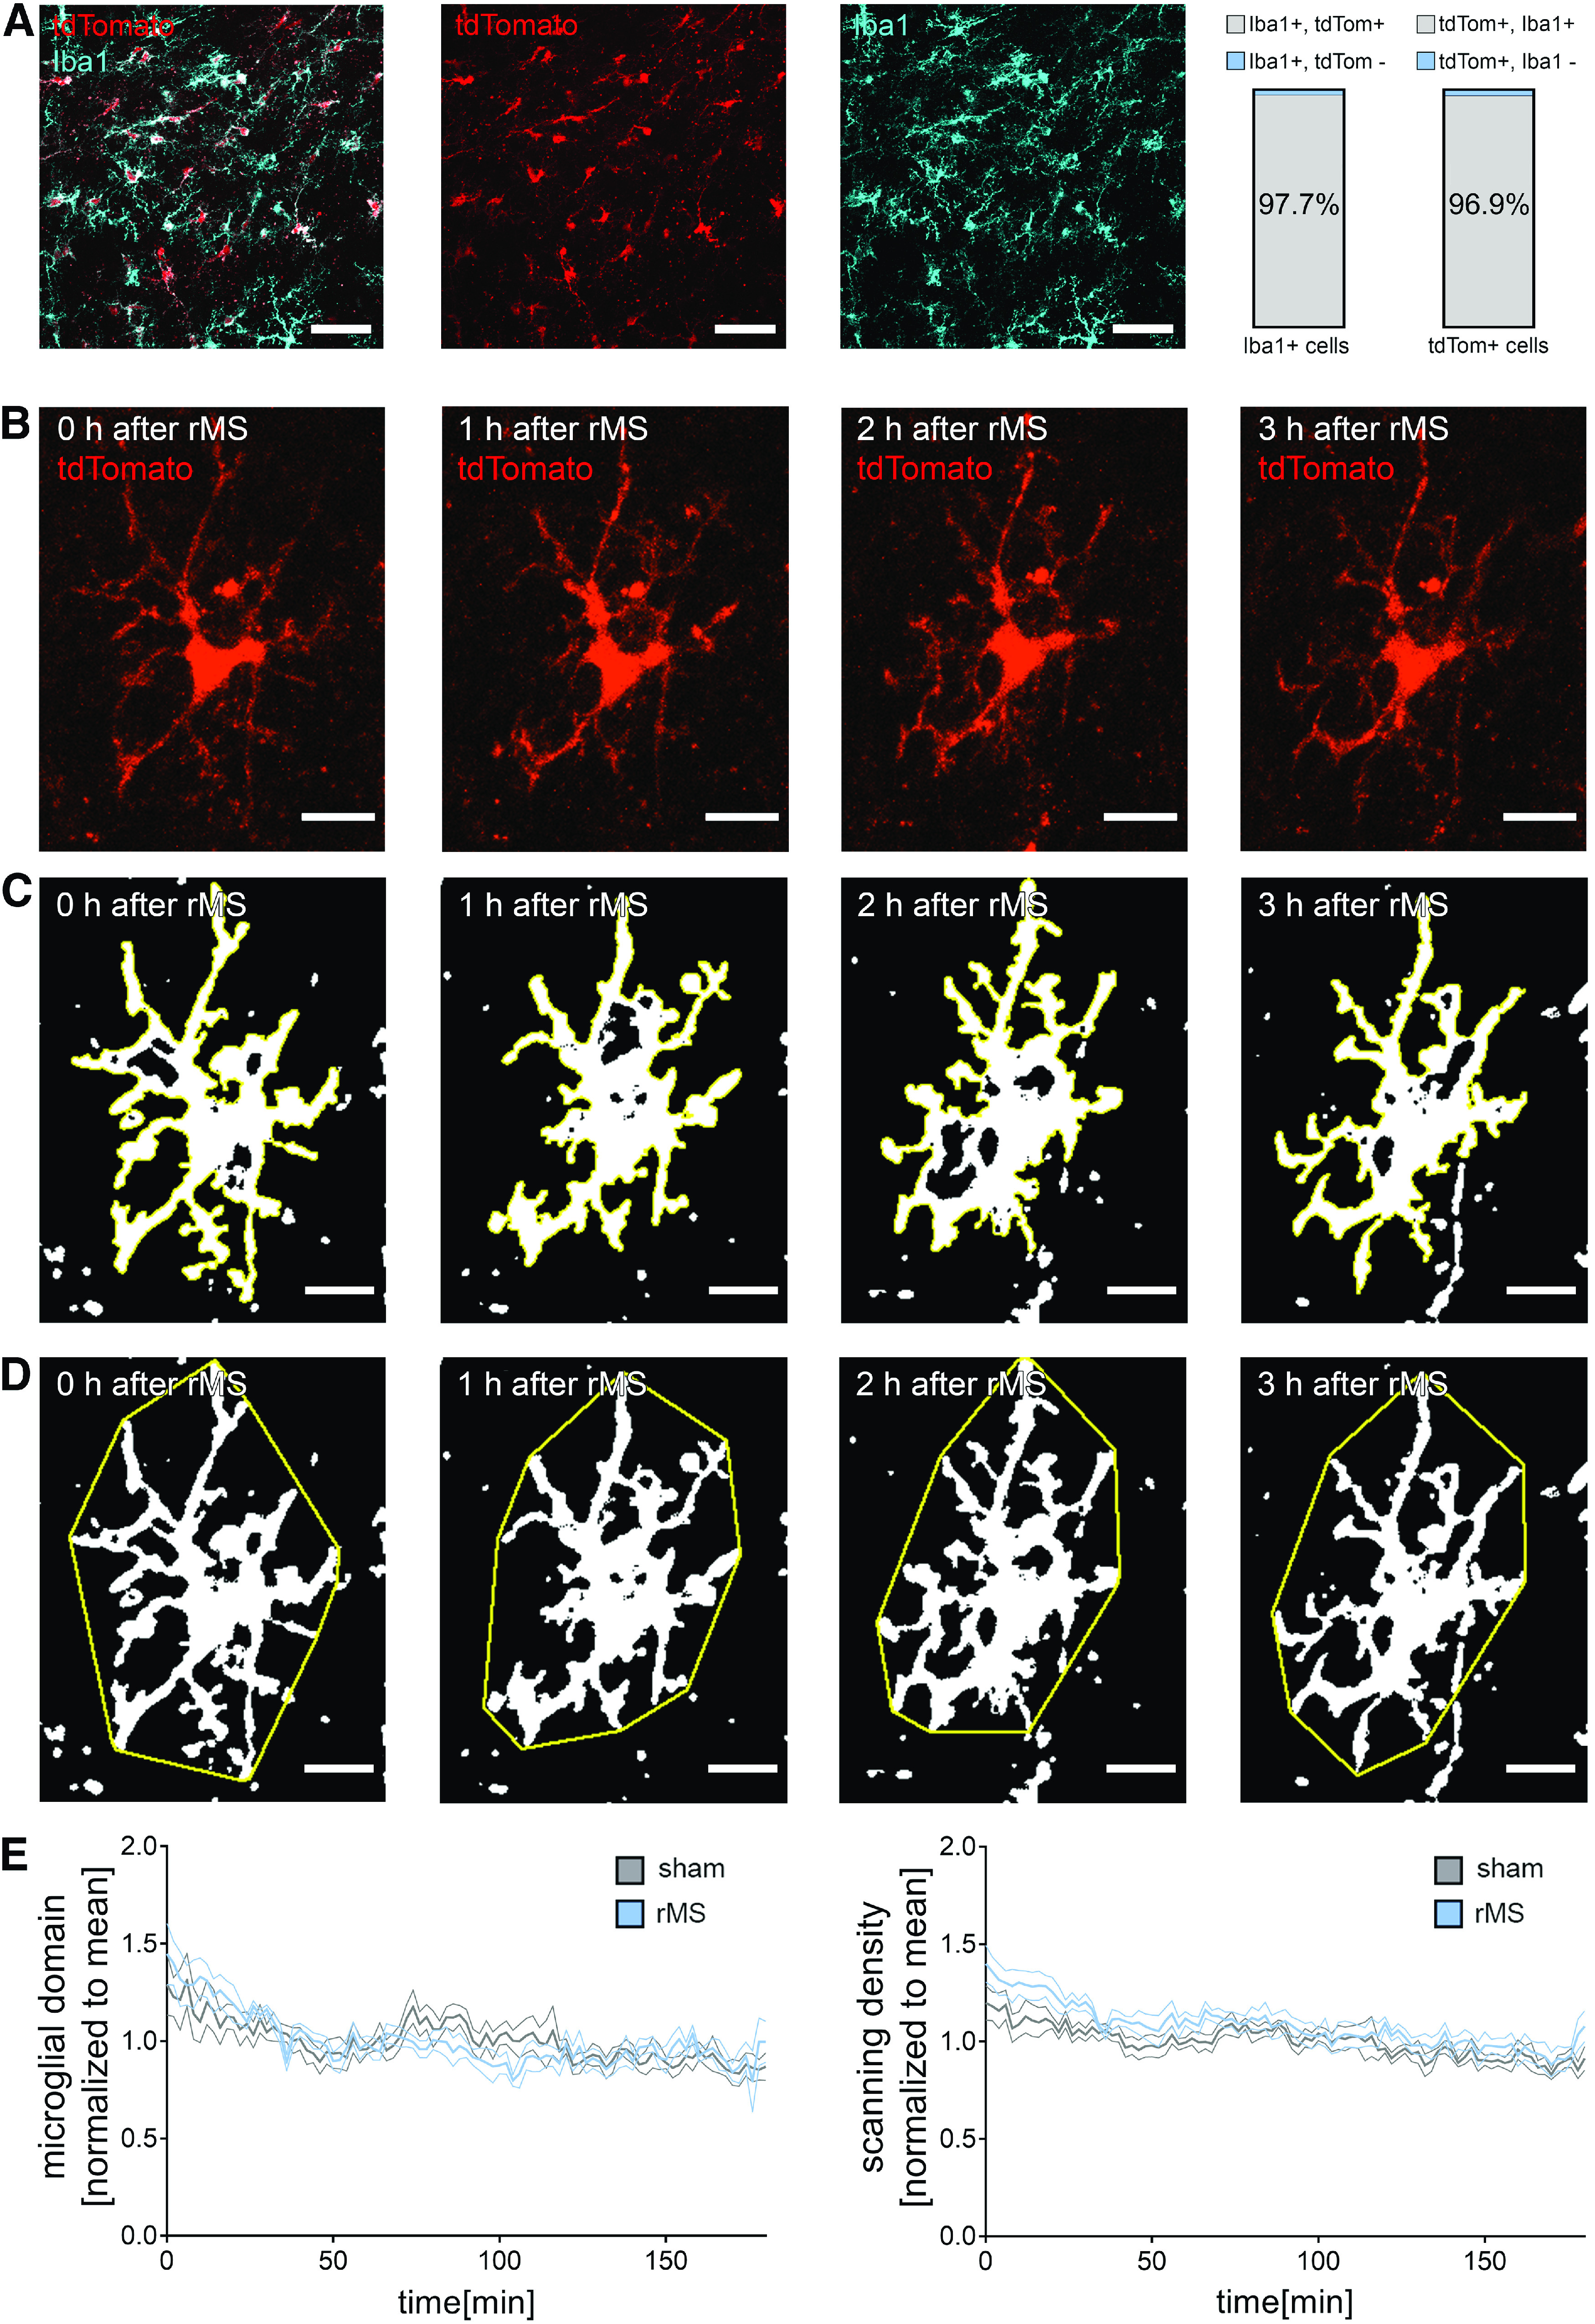
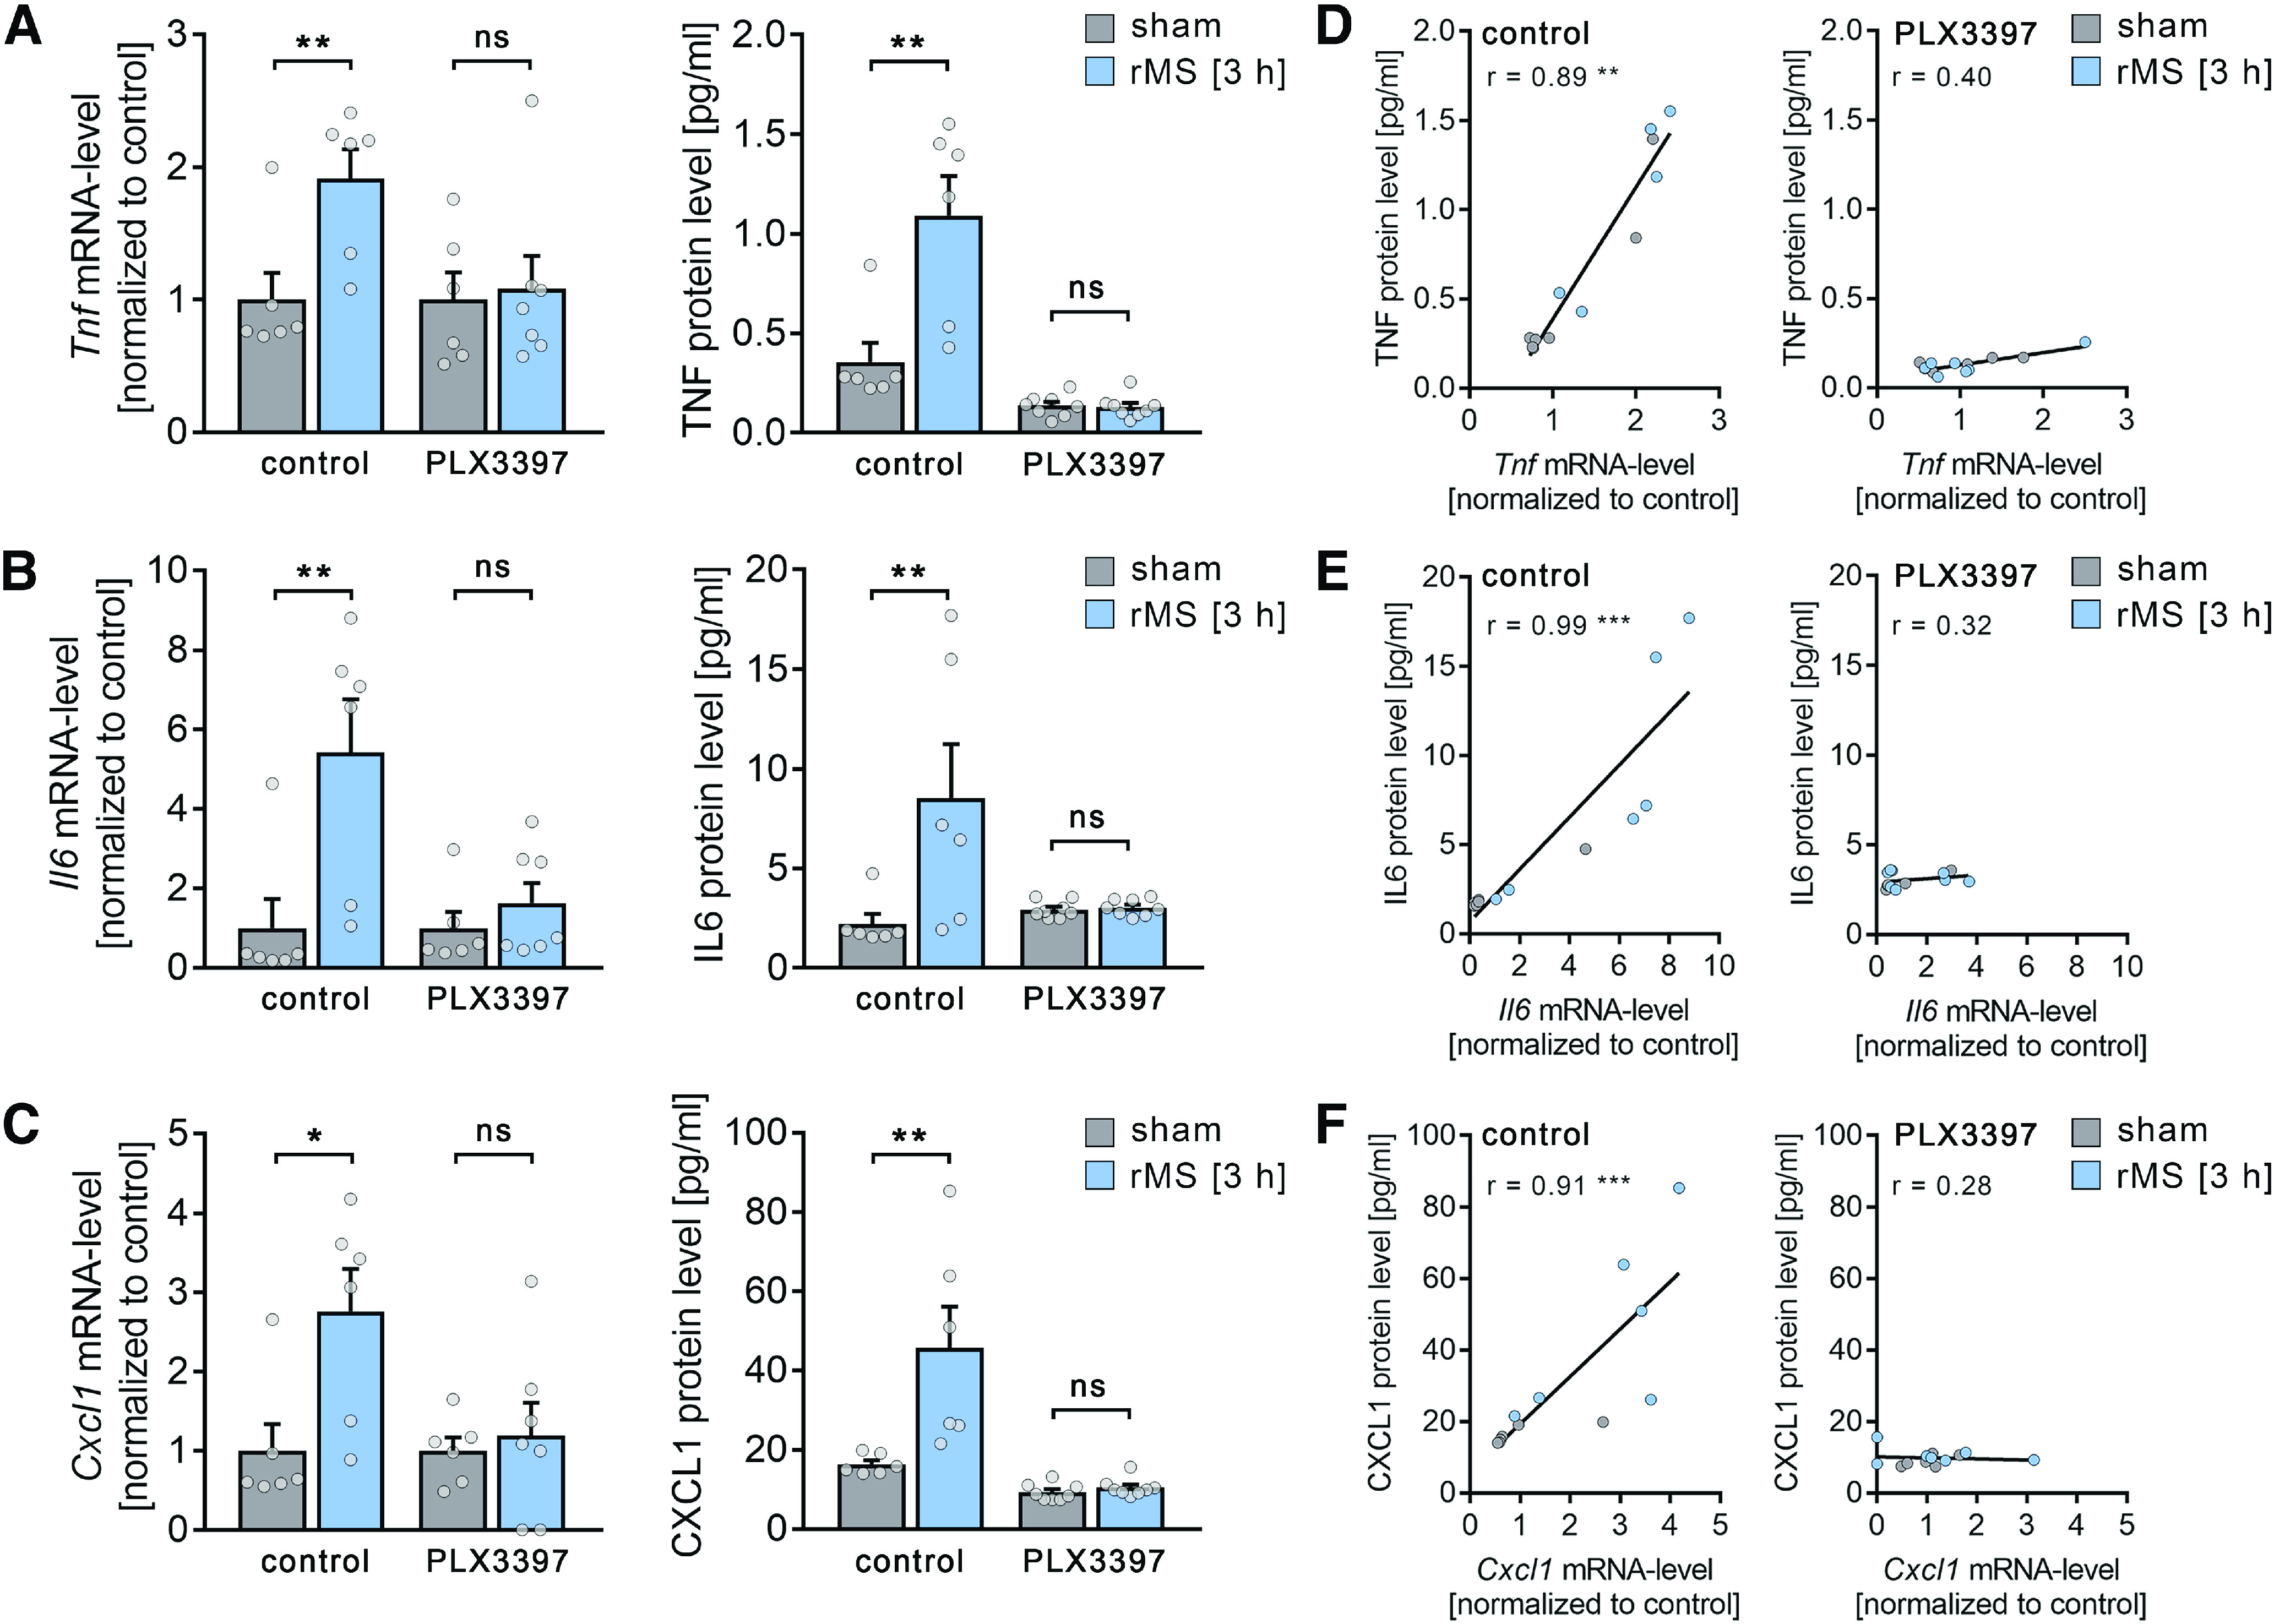
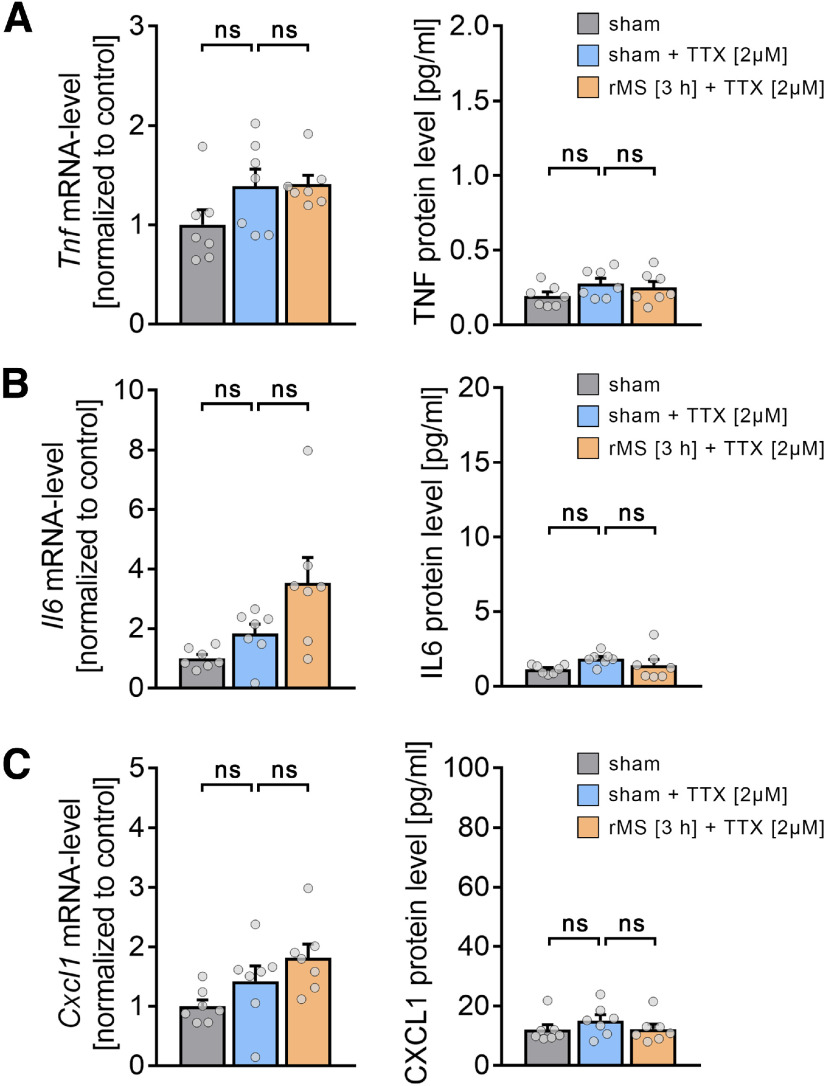
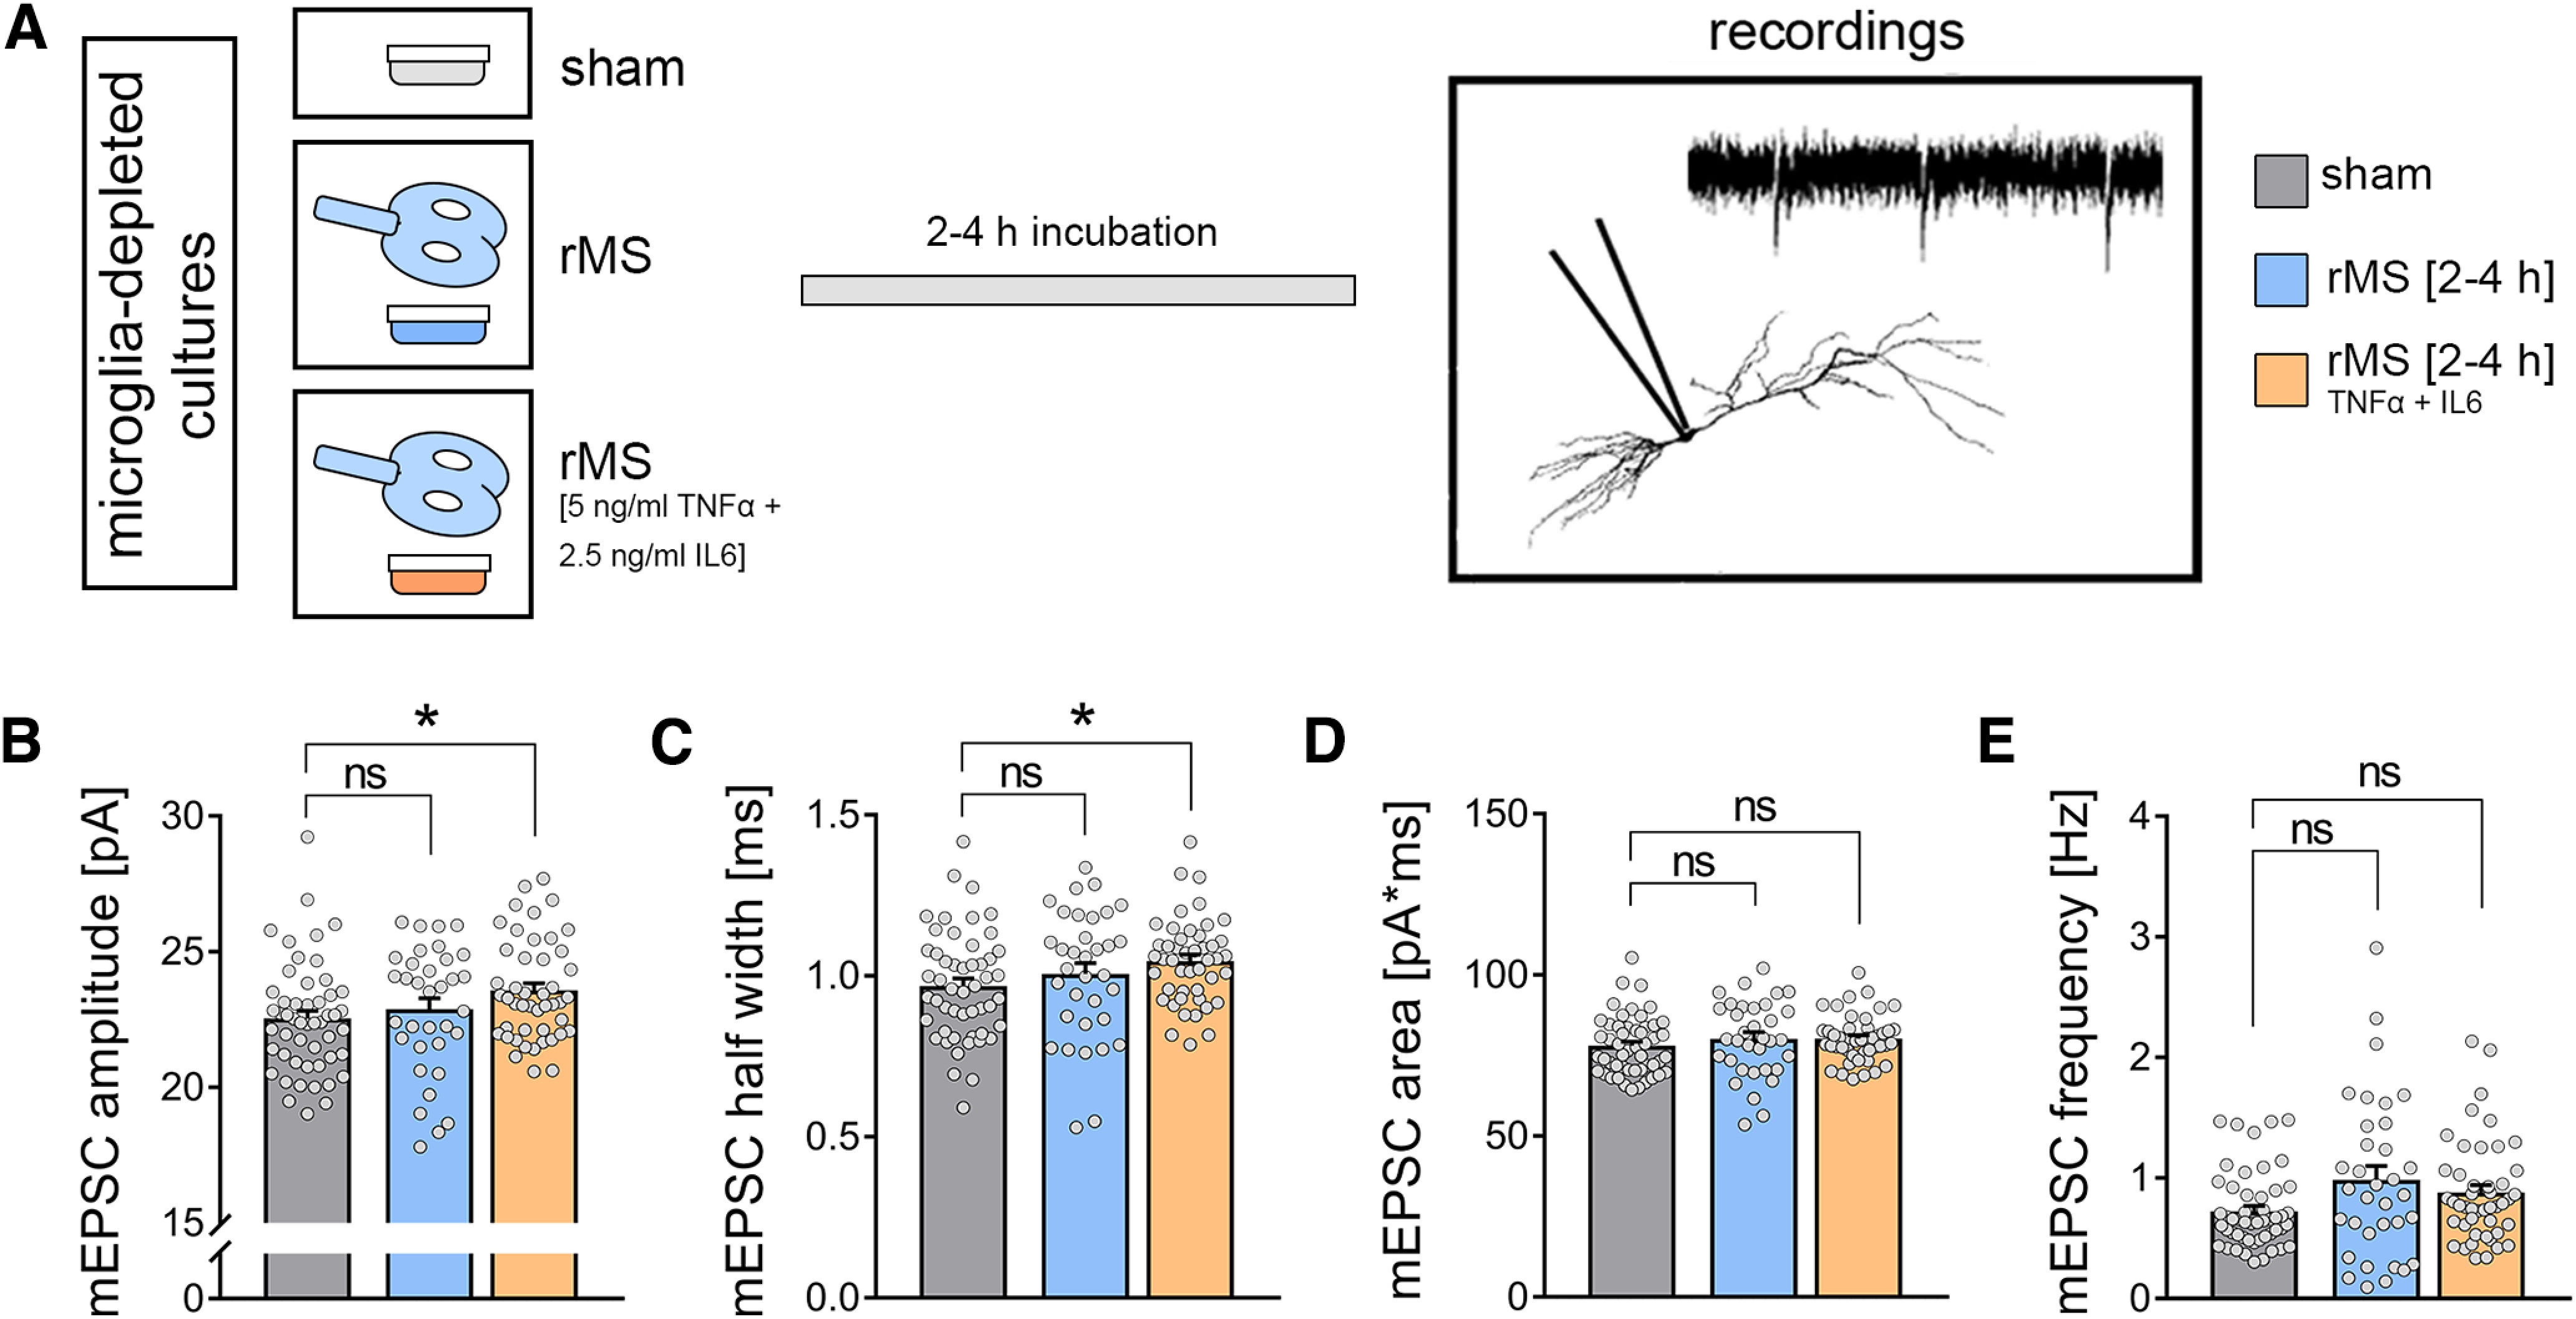
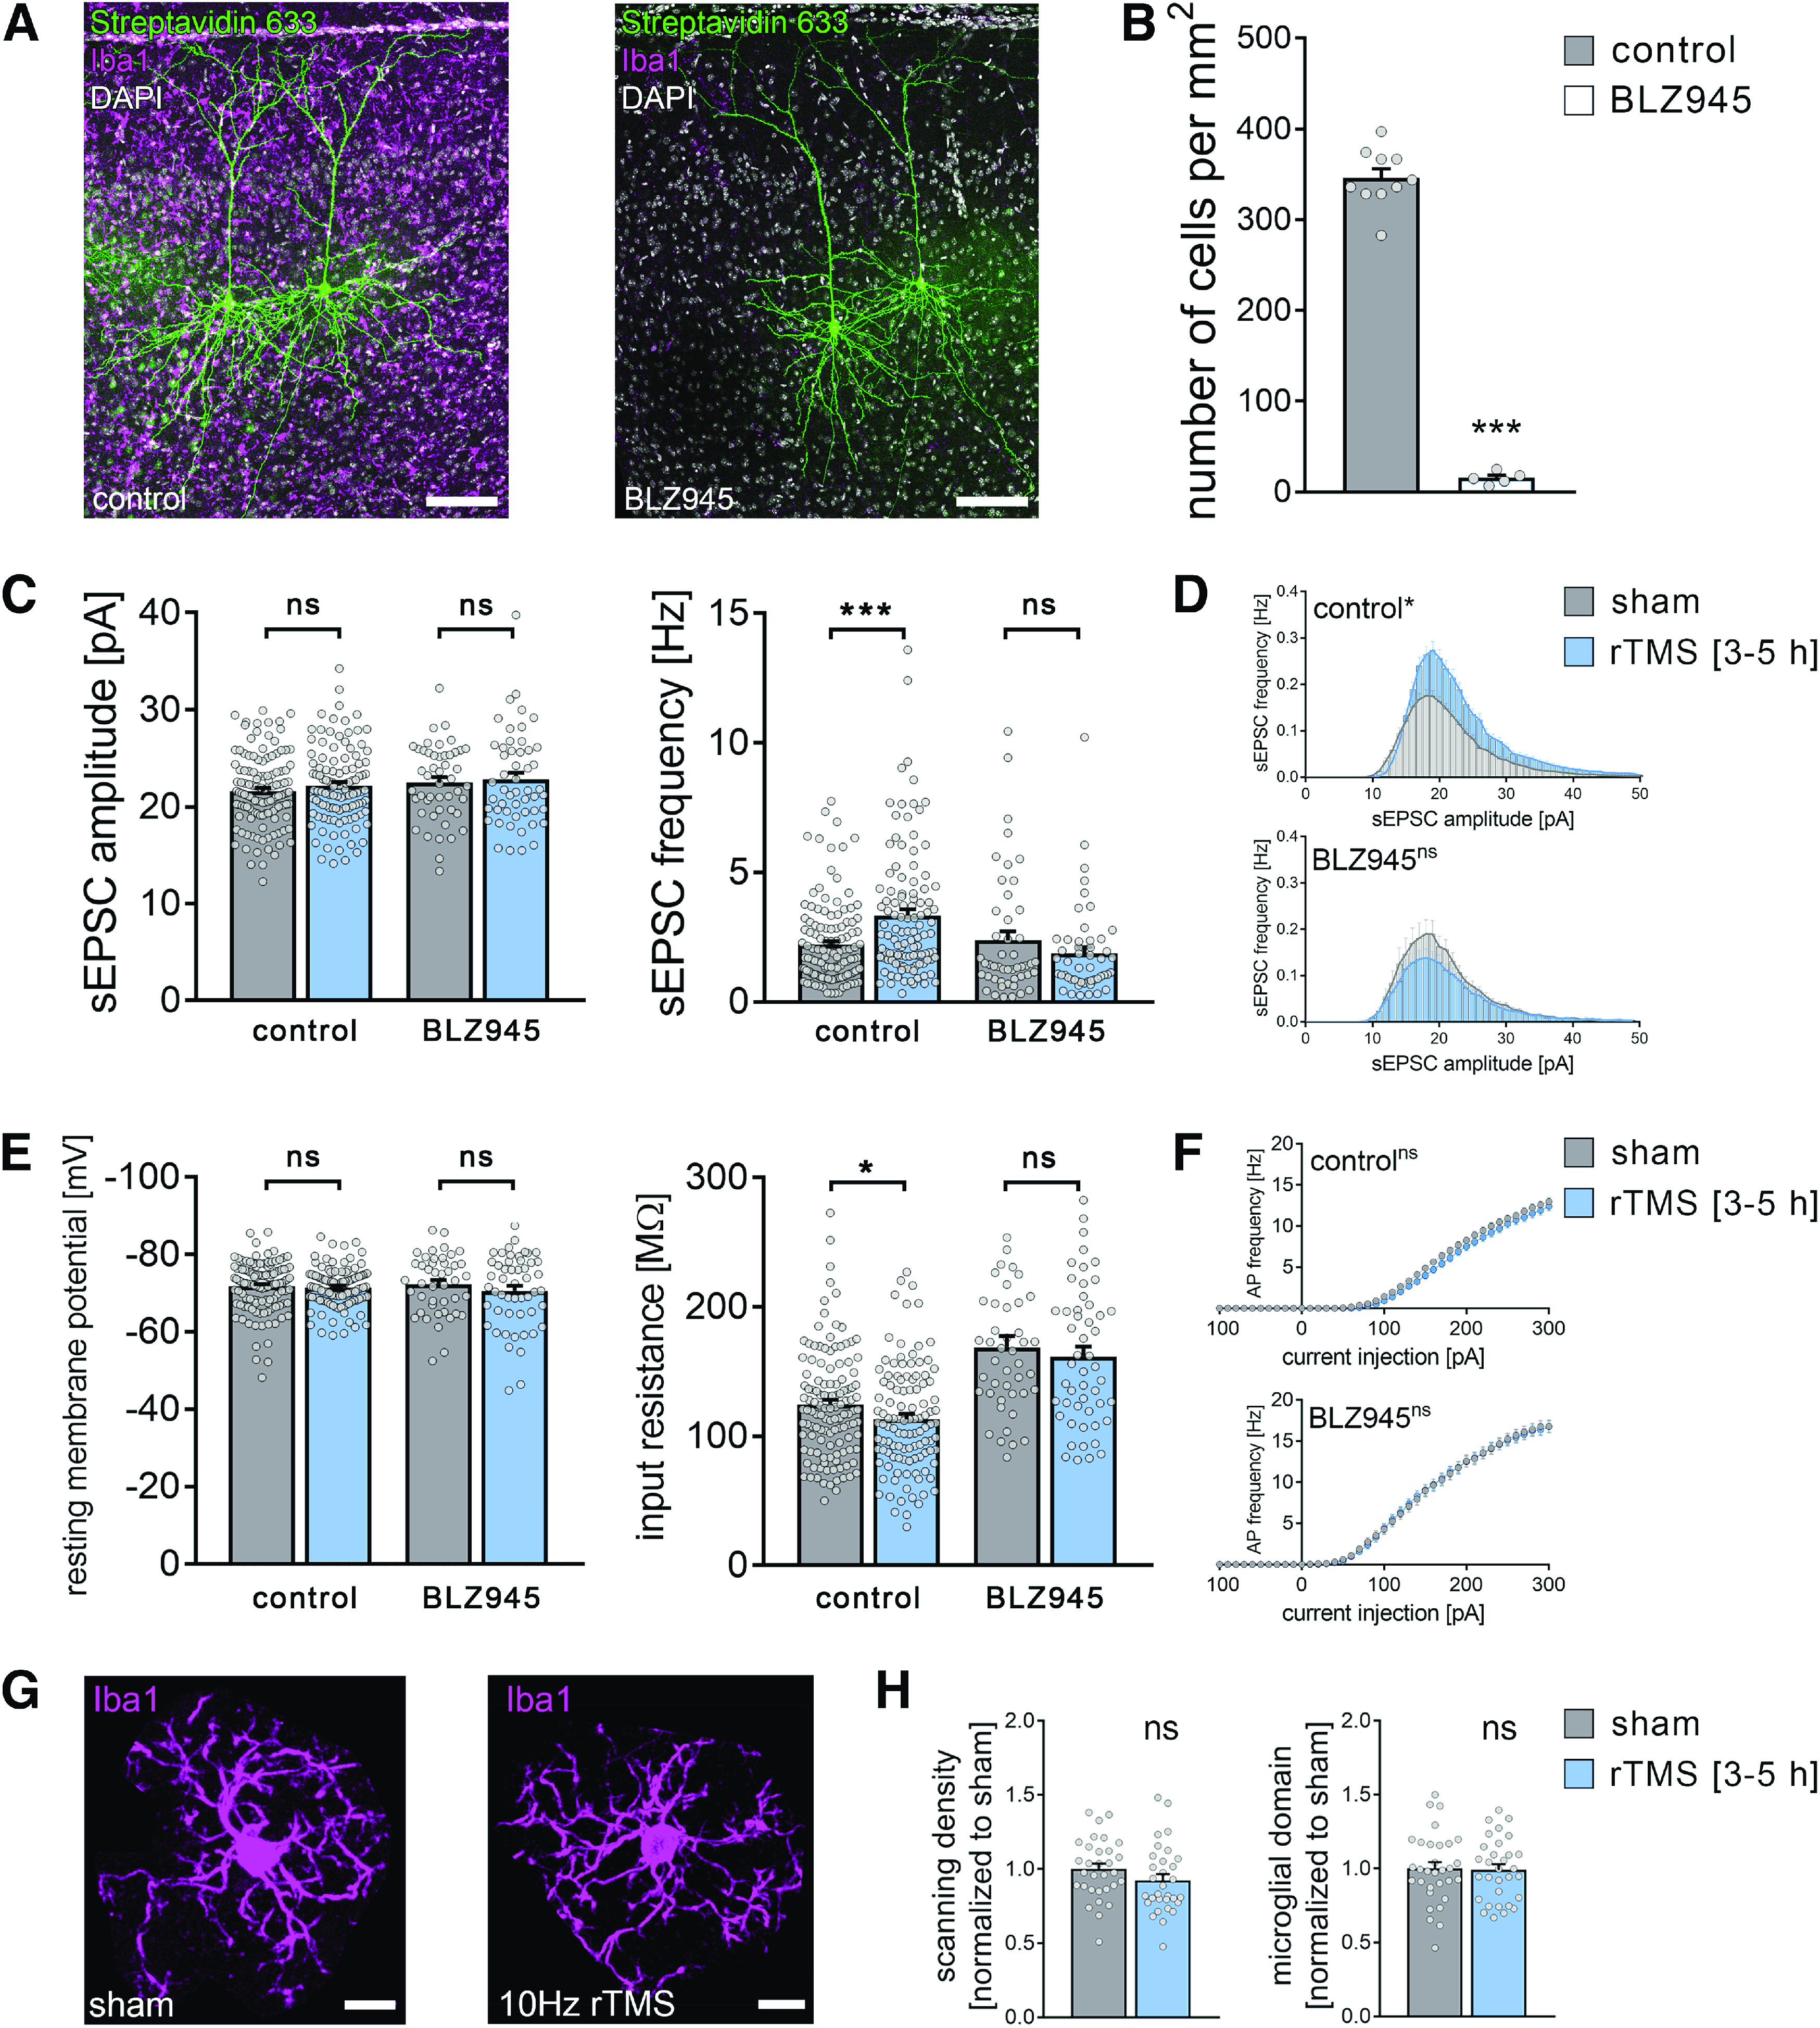
Microglia, the resident immune cells of the CNS, sense the activity of neurons and regulate physiological brain functions. They have been implicated in the pathology of brain diseases associated with alterations in neural excitability and plasticity. However, experimental and therapeutic approaches that modulate microglia function in a brain region-specific manner have not been established. In this study, we tested for the effects of repetitive transcranial magnetic stimulation (rTMS), a clinically used noninvasive brain stimulation technique, on microglia-mediated synaptic plasticity; 10 Hz electromagnetic stimulation triggered a release of plasticity-promoting cytokines from microglia in mouse organotypic brain tissue cultures of both sexes, while no significant changes in microglial morphology or microglia dynamics were observed. Indeed, substitution of tumor necrosis factor α (TNFα) and interleukin 6 (IL6) preserved synaptic plasticity induced by 10 Hz stimulation in the absence of microglia. Consistent with these findings, in vivo depletion of microglia abolished rTMS-induced changes in neurotransmission in the mPFC of anesthetized mice of both sexes. We conclude that rTMS affects neural excitability and plasticity by modulating the release of cytokines from microglia.SIGNIFICANCE STATEMENT Repetitive transcranial magnetic stimulation (rTMS) is a noninvasive brain stimulation technique that induces cortical plasticity. Despite its wide use in neuroscience and clinical practice (e.g., depression treatment), the cellular and molecular mechanisms of rTMS-mediated plasticity remain not well understood. Herein, we report an important role of microglia and plasticity-promoting cytokines in synaptic plasticity induced by 10 Hz rTMS in organotypic slice cultures and anesthetized mice, thereby identifying microglia-mediated synaptic adaptation as a target of rTMS-based interventions.

Keywords: IL6; TNF; excitatory synaptic plasticity; microglia; microglia depletion; rTMS.


Figures

Figure 1.
Figure 1.
PLX3397 depletes microglia in organotypic tissue cultures. A, Entorhino-hippocampal tissue culture stained with DAPI nuclear stain. EC, entorhinal cortex; DG, dentate gyrus. Scale bar, 200 µm. B, C, Representative examples of tissue cultures stained for the microglial marker Iba1. Note homogeneous distribution of microglia in the control culture and depletion of microglia following PLX3397 treatment (50 nm, 18 d). Scale bars, 200 µm. D, Microglia cell counts in the respective groups (ncontrol = 14 cultures, nPLX3397 = 15 cultures; Mann–Whitney test, U = 0). E-G, Affymetrix Microarray analysis of control cultures and cultures treated with PLX3397. E, Volcano plot represents fold changes and FDR p values of analyzed transcripts. Green represents significantly upregulated transcripts. Red represents significantly downregulated transcripts. F, Classification of differentially expressed transcripts; 97.5% of the differentially expressed transcripts are microglia-specific or microglia-related (for detailed results, see Extended Data Table 1-1). G, Hierarchical clustering of differentially expressed gene sets characteristic of M0-, M1-, and M2-classified microglia. Each sample consisted of three pooled cultures (n = 3 samples in each group). Colored dots represent individual data points. Data are mean ± SEM. ***p < 0.001.
Figure 2.
Figure 2.
10 Hz rMS in organotypic tissue cultures. A, B, Entorhino-hippocampal tissue cultures (DAPI nuclear stain, B) were stimulated with a 70 mm outer wing diameter figure-of-eight coil (Magstim). Filter inserts carrying 2-6 tissue cultures were placed in a Petri dish below the coil. The orientation within the electromagnetic field and distance to the coil was kept constant in all experiments (DAPI nuclear stain). Scale bar, 200 µm. C, Sham-stimulated cultures were not stimulated but otherwise treated equally. After stimulation, cultures were kept in the incubator for 2-4 h before further experimental procedures, such as patch-clamp recordings.
Figure 3.
Figure 3.
CA1 pyramidal neurons in microglia-depleted tissue cultures do not express excitatory synaptic plasticity induced by 10 Hz rMS. A, Example of a recorded and post hoc stained CA1 pyramidal neuron in a tissue culture stained with the microglial marker Iba1. Scale bar, 100 µm. B, C, Sample traces and group data of AMPAR-mediated mEPSCs recorded from CA1 pyramidal neurons in sham-stimulated and 10 Hz rMS-stimulated cultures 2-4 h after stimulation (ncontrol-sham = 56 cells, ncontrol-rMS = 60 cells; Mann–Whitney test, Uamplitude = 1091, Uhalf-width = 1042, Uarea = 956, Ufrequency = 651; repeated-measures two-way ANOVA followed by Sidak's multiple comparisons test for amplitude-frequency-plot). D, Example of a recorded and post hoc stained CA1 pyramidal neuron in a PLX3397-treated, microglia-depleted tissue culture stained with the microglial marker Iba1. Scale bar, 100 µm. E, F, Representative traces and group data of AMPAR-mediated mEPSCs recorded from CA1 pyramidal cells in sham-stimulated and 10 Hz rMS-stimulated microglia-depleted tissue cultures 2-4 h after stimulation (nPLX3397-sham = 61 cells, nPLX3397-rMS = 55 cells; Mann–Whitney test; repeated measures two-way ANOVA followed by Sidak's multiple comparisons test for amplitude-frequency plot). Gray dots represent individual data points. Data are mean ± SEM. **p < 0.01. ***p < 0.001.
Figure 4.
Figure 4.
Depletion of microglia does not affect cell viability and basic functional properties of CA1 pyramidal neurons. A, Tissue cultures stained with PI [left: vehicle control, middle: PLX3397 (50 nm, 18 d), right: NMDA (50 μm, 4 h)]. Group data of the quantified PI signals are shown in the graph on the right (ncontrol = 29 cultures, nPLX(50 nm) = 28 cultures, nNMDA = 16 cultures; Kruskal–Wallis test followed by Dunn's post hoc correction). Scale bars, 200 µm. B, Examples of patched, recorded, and post hoc identified CA1 pyramidal neurons. Scale bar, 100 µm. C, D, Group data of passive membrane properties of CA1 pyramidal neurons in microglia-depleted (i.e., PLX3397; 50 nm, 18 d) treated tissue cultures and control cultures (ncontrol = 33 cells, nPLX3397 = 30 cells; Mann–Whitney test). E, Group data of AP frequencies of CA1 pyramidal neurons in the respective groups (ncontrol = 33 cells, nPLX3397 = 30 cells, repeated measures two-way ANOVA followed by Sidak's multiple comparisons). F, Group data of AMPAR-mediated sEPSCs recorded from CA1 pyramidal neurons revealed no significant changes in excitatory neurotransmission in microglia-depleted tissue cultures (ncontrol = 33 cells, nPLX3397 = 30 cells; Mann–Whitney test). Gray dots represent individual data points. Data are mean ± SEM. ***p < 0.001.
Figure 5.
Figure 5.
Dendritic morphology of CA1 pyramidal cells is not affected in microglia-depleted tissue cultures. A, Examples of three-dimensionally reconstructed CA1 pyramidal neurons in nondepleted controls and PLX3397-treated (i.e., microglia-depleted tissue cultures). Scale bars, 100 µm. B, Sholl analysis of apical and basal dendrites from reconstructed CA1 neurons in the respective groups (ncontrol = 20 cells, nPLX3397 = 15 cells; repeated measures two-way ANOVA followed by Sidak's multiple comparisons). C-E, Group data of additional morphologic parameters from the same set of reconstructed CA1 pyramidal neurons in microglia-depleted tissue cultures and vehicle-only treated control cultures (ncontrol = 20 cells, nPLX3397 = 15 cells; Mann–Whitney test). Gray dots represent individual data points. Data are mean ± SEM.
Figure 6.
Figure 6.
Dendritic spines of CA1 pyramidal neurons are not altered in microglia-depleted tissue cultures. A-C, Examples of dendritic segments and group data of spine densities and spine volumes from patched and post hoc identified CA1 pyramidal neurons in stratum radiatum (rad, A), stratum oriens (sor, B), and stratum lacunosum-moleculare (lcm, C) of PLX3397-treated, that is, microglia-depleted tissue cultures and control cultures (rad density: ncontrol = 16 dendritic segments, nPLX3397 = 12 dendritic segments; rad volume: ncontrol = 578 spines, nPLX3397 = 393 spines; sor density: ncontrol = 15 dendritic segments, nPLX3397 = 16 dendritic segments; sor volume: ncontrol = 450 spines, nPLX3397 = 703 spines; lcm density: ncontrol = 36 dendritic segments, nPLX3397 = 23 dendritic segments; lcm volume: ncontrol = 655 spines, nPLX3397 = 405 spines; Mann–Whitney test). Scale bars, 3 µm. Gray dots represent individual data points. Data are mean ± SEM.
Figure 7.
Figure 7.
Multiscale computer modeling of rMS. A, Neuronal responses to rMS were modeled in realistic dendritic morphologies from reconstructed CA1 pyramidal neurons in a representative tissue culture environment. EC, entorhinal cortex; DG, dentate gyrus. Scale bar, 200 µm. B, C, Changes in membrane voltage (Vm; B) and intracellular calcium levels (Ca2+; C) were assessed for a train of 20 pulses at 10 Hz at the constant stimulation intensity used in the experimental setting. CA1 pyramidal neurons in both conditions showed a delayed suprathreshold response on rMS. D, Both the number of cellular spikes on stimulation and the synaptic weight did not show a significant difference between CA1 pyramidal neurons from microglia-depleted and nondepleted control cultures (nvehicle-only = 20 cells, nPLX3397 = 15 cells; GLMMs). E, In the same set of cells, the peak membrane voltage difference in response to magnetic stimulation was modeled in the somatic, apical, and basal dendritic compartments. No differences were observed between the two groups, respectively. F, Analysis of stimulus-triggered changes in intracellular calcium levels. No changes in both the dendritic and the somatic compartments were evident between CA1 pyramidal neurons of microglia-depleted tissue cultures and control cultures. Gray dots represent individual data points. Data are mean ± SEM.
Figure 8.
Figure 8.
rMS does not affect microglia morphology. A, Representative image of Iba1-stained tissue culture prepared from homozygous HexBtdT/tdT mice. Note tandem dimer (td) Tomato-expressing microglia. Right, Group data showing an almost complete overlap of the two signals (nIba1+ = 273 cells in 5 cultures; ntdTomato+ = 274 cells in 5 cultures.). Scale bars, 50 µm. B-D, Examples of tdTomato-expressing microglia in hippocampal area CA1 imaged from HexBtdT/tdT cultures over a period of 3 h following 10 Hz rMS (2 min intervals). Maximum intensity projections of image stacks (B), microglial scanning densities (C), and microglial domains (D) are illustrated. Scale bars, 15 µm. E, Group data of microglial domains and scanning densities from rMS-stimulated and sham-stimulated tissue cultures (nsham = 6 cells, nrMS = 6 cells from 6 cultures in each group; repeated measures two-way ANOVA followed by Sidak's multiple comparisons). Data are mean ± SEM.
Figure 9.
Figure 9.
rMS does not induce neuroinflammation. Sample images (A) and group data (B) of eGFP fluorescence intensity of rMS-stimulated and sham-stimulated tissue cultures prepared from TNF-reporter mice [C57BL/6-Tg(TNFa-eGFP)] imaged 3 h after 10 Hz rMS. DG, dentate gyrus. nsham = 26 cultures, nrMS = 27 cultures; Mann–Whitney test. Scale bars, 200 µm. Gray dots represent individual data points. Data are mean ± SEM.
Figure 10.
Figure 10.
rMS triggers the expression and release of plasticity-promoting microglial factors. A-C, Left panels, group data of mRNA levels of (A) TNFα, (B) IL6, and (C) CXCL1 in nondepleted cultures and microglia-depleted cultures (PLX3397-treated cultures) 3 h after 10 Hz rMS and sham stimulation (ncontrol mRNA = 6 cultures, respectively, for each experimental condition, nPLX3397 mRNA sham = 6 cultures, nPLX3397 mRNA rMS = 7 cultures; Mann–Whitney test, Ucontrol Tnf mRNA = 2, Ucontrol Il6 mRNA = 2, Ucontrol Cxcl1 mRNA = 3; for detailed statistical assessment, see Extended Data Table 10-1). Right panels, group data of protein levels of (A) TNFα, (B) IL6, and (C) CXCL1 in culturing medium of nondepleted cultures and microglia-depleted cultures (PLX3397-treated cultures) 3 h after 10 Hz rMS and sham stimulation (ncontrol protein = 6 culturing medium samples, respectively, for each experimental condition, n PLX3397 protein = 8 culturing medium samples, respectively, for each experimental condition; Mann–Whitney test, Ucontrol TNF protein = 2, Ucontrol IL6 protein = 2, Ucontrol CXCL1 protein = 0; for detailed statistical assessment, see Extended Data Table 10-1). D-F, Correlation of mRNA levels and protein levels of TNFα (D), IL6 (E), and CXCL1 (F) in nondepleted control cultures (left panels) and microglia-depleted (PLX3397-treated, right panels) cultures 3 h after 10 Hz rMS and sham stimulation (ncontrol = 6 cultures or culturing medium samples, respectively, for each experimental condition, nPLX3397-sham = 6 cultures or culturing medium samples, nPLX3397-rMS = 7 cultures or culturing medium samples; for detailed statistical assessment, see Extended Data Table 10-2). Gray dots represent individual data points. Data are mean ± SEM. *p < 0.05. **p < 0.01. ***p < 0.001.
Figure 11.
Figure 11.
Activity-dependent release of microglial cytokines. A-C, Group data of mRNA levels (right panels) and protein levels in the incubation medium (left panels) of (A) TNFα, (B) IL6, and (C) CXCL1 in nondepleted cultures 3 h after sham stimulation, sham stimulation in TTX (2 μm), and 10 Hz rMS in TTX (2 μm; n = 7 cultures, respectively, for each experimental condition; Kruskal–Wallis test followed by Dunn's post hoc correction; for detailed statistical assessment, see Extended Data Table 11-1). Gray dots represent individual data points. Data are mean ± SEM.
Figure 12.
Figure 12.
Substitution of pro-inflammatory cytokines during stimulation in microglia-depleted tissue cultures rescues rMS-induced synaptic plasticity. A, Schematic of the experimental design. A subset of tissue cultures was stimulated in the presence of TNFα (5 ng/ml) and IL6 (2.5 ng/ml). Effects of TNFα and IL6 in sham-stimulated cultures are reported in the main text. B-E, Group data of AMPAR-mediated mEPSCs recorded from CA1 pyramidal neurons in sham-stimulated and 10 Hz rMS-stimulated cultures (nsham = 51 cells, nrMS = 34 cells, nrMS-TNF+IL6 = 46 cells; Kruskal–Wallis test followed by Dunn's post hoc correction). Gray dots represent individual data points. Data are mean ± SEM. *p < 0.05.
Figure 13.
Figure 13.
Microglia depletion in vivo prevents rTMS-induced synaptic plasticity of superficial pyramidal neurons in the mPFC of adult mice. A, Post hoc visualization of superficial pyramidal neurons by streptavidin staining in the mPFC of nondepleted (left) and microglia-depleted (BLZ945-treated, right) adult mice. Microglia visualized by Iba1 immunolabeling. Scale bars, 100 µm. B, Quantification of microglia numbers confirmed an ∼90% reduction of microglia in the mPFC of BLZ945-treated animals (ncontrol = 10 animals, nmicroglia-depleted (BLZ945) = 5 animals; Mann–Whitney test, U = 0). C, Group data of AMPAR-mediated sEPSCs recorded from layer 2/3 pyramidal neurons in the mPFC of nondepleted and microglia-depleted mice 3-5 h after 10 Hz rTMS and sham stimulation (nondepleted animals: nsham = 124 cells from 8 animals, nrTMS = 111 cells from 8 animals; microglia-depleted [BLZ945-treated] animals: nsham = 48 cells from 2 animals, nrTMS = 51 cells from 3 animals; Mann–Whitney test, UsEPSC frequency, nondepleted = 2324). D, Amplitude-frequency plots of sEPSC recordings from the respective groups (repeated measures two-way ANOVA following Sidak's multiple comparisons test). E, F, Group data of passive and active membrane properties recorded from layer 2/3 pyramidal neurons in the mPFC of nondepleted and microglia-depleted mice 3-5 h after 10 Hz rTMS and sham stimulation (ncontrol-sham = 124 cells, ncontrol-rTMS = 111 cells, nBLZ-sham = 44 cells, nBLZ-rTMS = 51 cells; Mann–Whitney test and repeated measures two-way ANOVA followed by Sidak's multiple comparisons test for AP frequency analysis; Ucontrol-input resistance = 5836). One data point (input resistanceBLZ-sham = 413.8 mΩ) is outside the y axis limits. G, H, Representative images and group data of Iba1-stained microglia in the mPFC of nondepleted mice 3-5 h after 10 Hz rTMS and sham stimulation (nsham = 31 cells from 5 animals, nrTMS = 31 cells from 5 animals; Mann–Whitney test). Scale bars, 10 µm. Gray dots represent individual data points. Data are mean ± SEM. *p < 0.05. ***p < 0.001.

References

    1. Aberra AS, Wang B, Grill WM, Peterchev AV (2020) Simulation of transcranial magnetic stimulation in head model with morphologically-realistic cortical neurons. Brain Stimul 13:175–189. 10.1016/j.brs.2019.10.002 - DOI - PMC - PubMed
    1. Akiyoshi R, Wake H, Kato D, Horiuchi H, Ono R, Ikegami A, Haruwaka K, Omori T, Tachibana Y, Moorhouse AJ, Nabekura J (2018) Microglia enhance synapse activity to promote local network synchronization. eNeuro 5:ENEURO.0088-18.2018. - PMC - PubMed
    1. Anderson D, Burnham K (2004) Model selection and multi-model inference. New York: Springer.
    1. Arganda-Carreras I, Kaynig V, Rueden C, Eliceiri KW, Schindelin J, Cardona A, Seung HS (2017) Trainable Weka Segmentation: a machine learning tool for microscopy pixel classification. Bioinformatics 33:2424–2426. 10.1093/bioinformatics/btx180 - DOI - PubMed
    1. Badimon A, et al. (2020) Negative feedback control of neuronal activity by microglia. Nature 586:417–423. 10.1038/s41586-020-2777-8 - DOI - PMC - PubMed

Publication types

LinkOut - more resources