. 2023 Mar 28;6(6):e202201735.
doi: 10.26508/lsa.202201735. Print 2023 Jun.

FBXO11 governs macrophage cell death and inflammation in response to bacterial toxins

Affiliations

FBXO11 governs macrophage cell death and inflammation in response to bacterial toxins

Yusun Jeon et al. Life Sci Alliance. .

Abstract

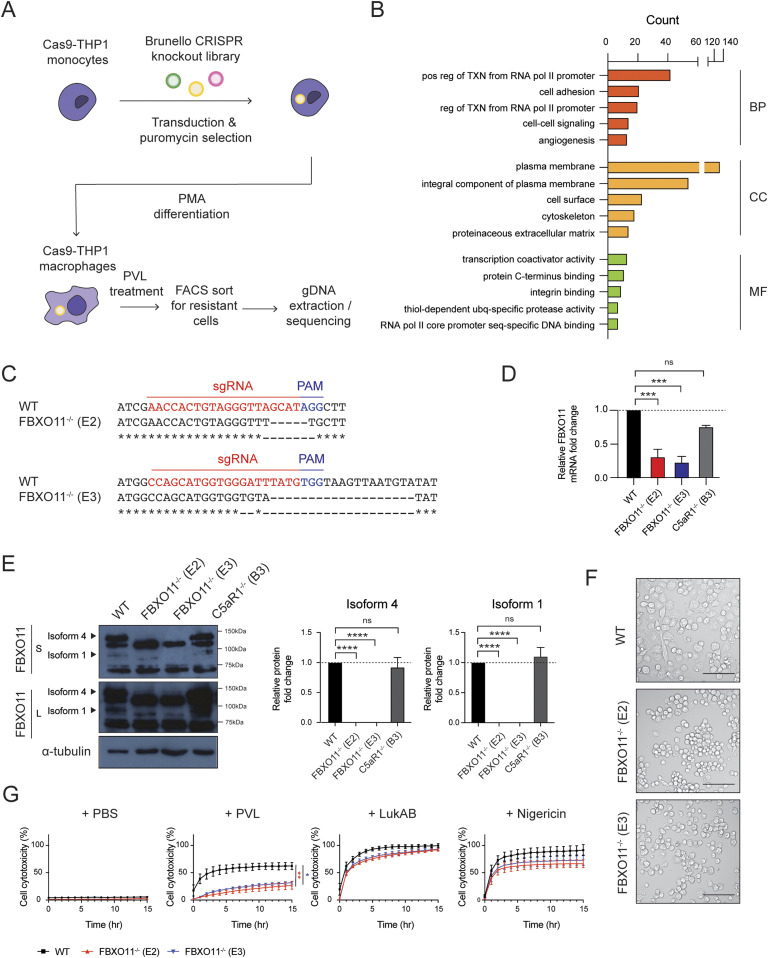
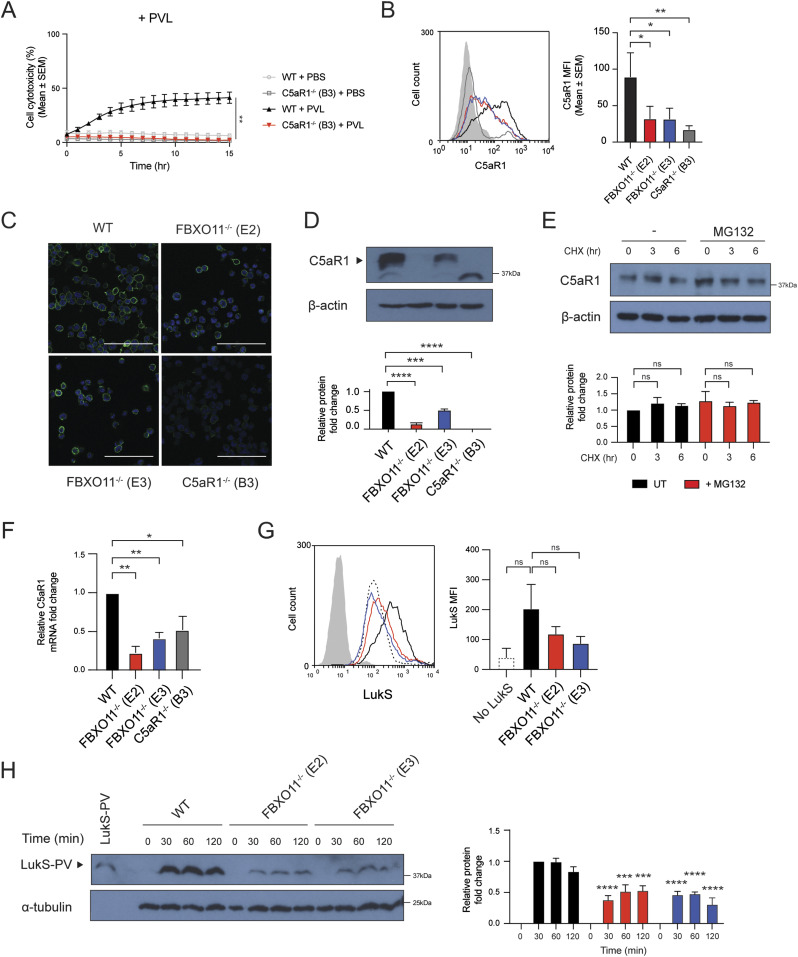
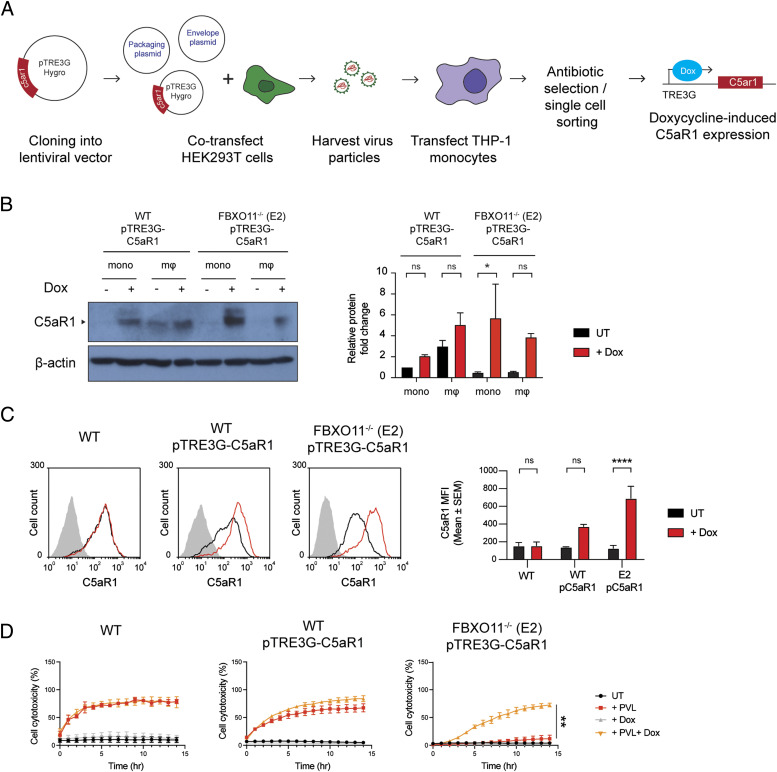
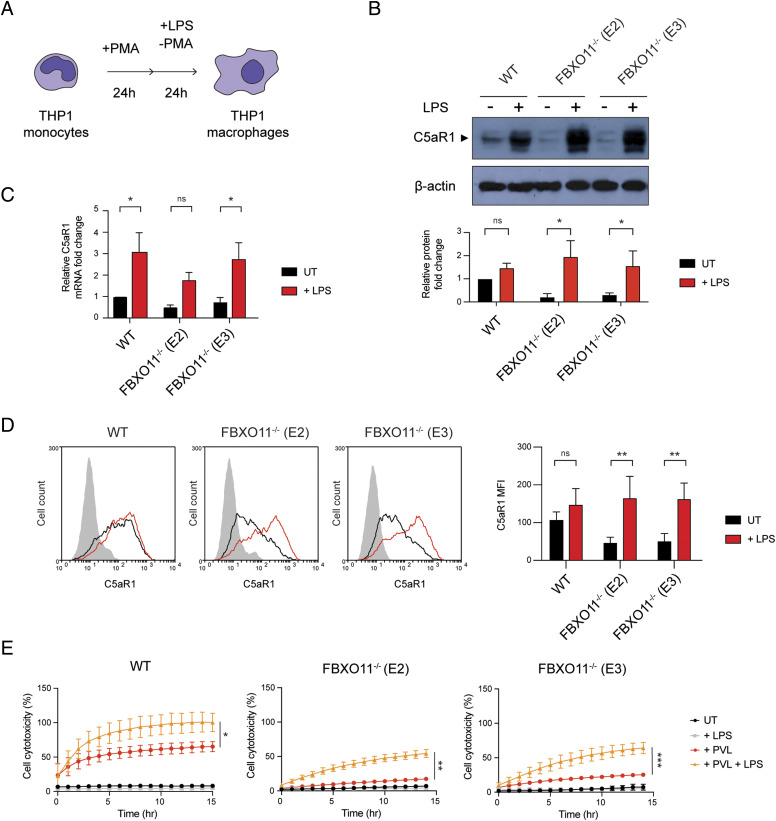
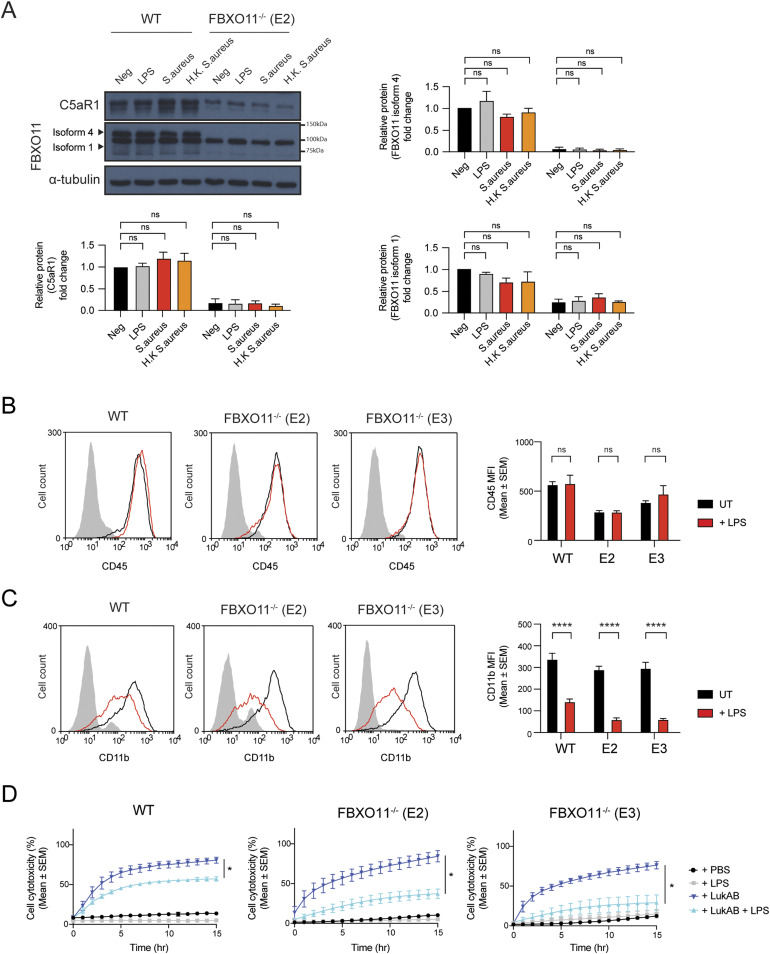
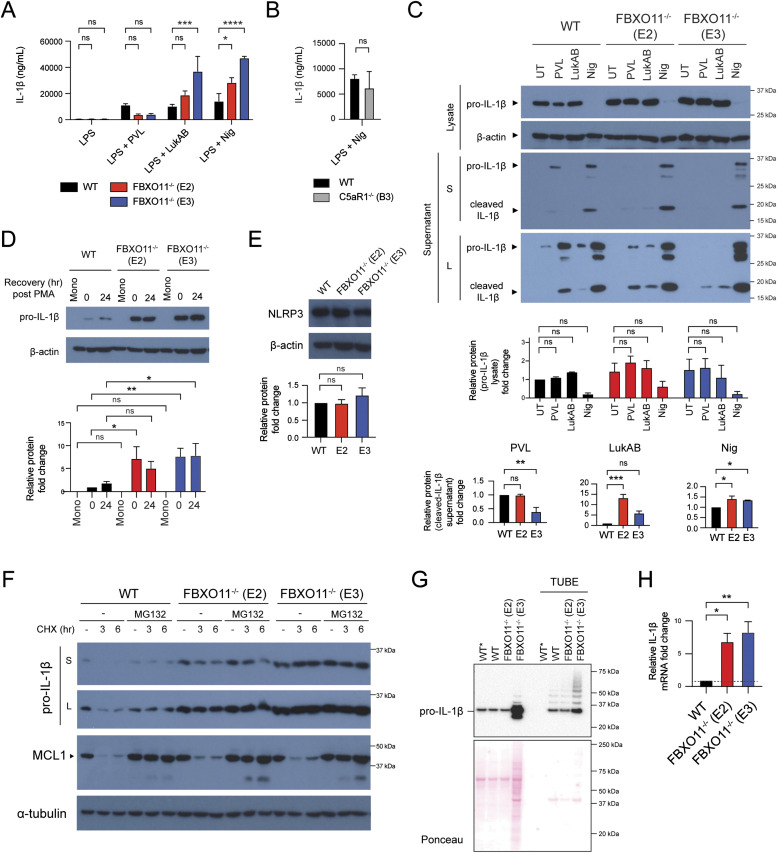
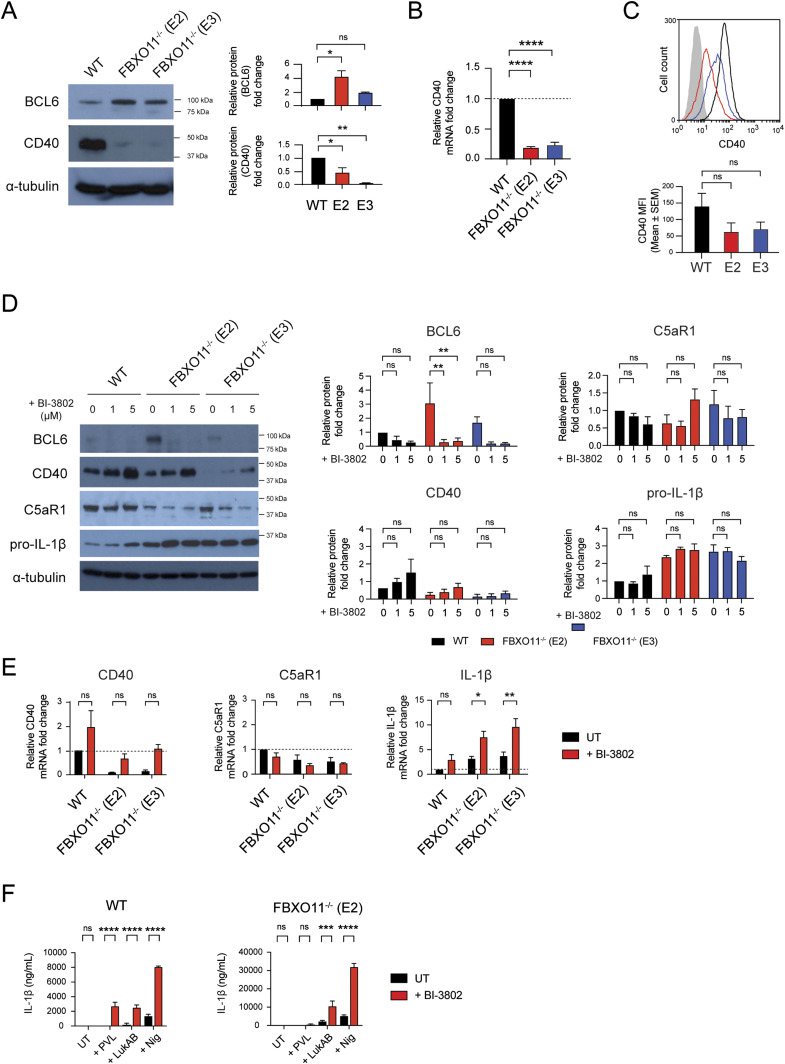
Staphylococcus aureus causes severe infections such as pneumonia and sepsis depending on the pore-forming toxin Panton-Valentine leukocidin (PVL). PVL kills and induces inflammation in macrophages and other myeloid cells by interacting with the human cell surface receptor, complement 5a receptor 1 (C5aR1). C5aR1 expression is tighly regulated and may thus modulate PVL activity, although the mechanisms involved remain incompletely understood. Here, we used a genome-wide CRISPR/Cas9 screen and identified F-box protein 11 (FBXO11), an E3 ubiquitin ligase complex member, to promote PVL toxicity. Genetic deletion of FBXO11 reduced the expression of C5aR1 at the mRNA level, whereas ectopic expression of C5aR1 in FBXO11-/- macrophages, or priming with LPS, restored C5aR1 expression and thereby PVL toxicity. In addition to promoting PVL-mediated killing, FBXO11 dampens secretion of IL-1β after NLRP3 activation in response to bacterial toxins by reducing mRNA levels in a BCL-6-dependent and BCL-6-independent manner. Overall, these findings highlight that FBXO11 regulates C5aR1 and IL-1β expression and controls macrophage cell death and inflammation following PVL exposure.


Conflict of interest statement

The authors declare that they have no conflict of interest.

Figures

Figure 1.
Figure 1.. Genome-wide CRISPR/Cas9 screen identified FBXO11 as critical host factor required for PVL-mediated cell cytotoxicity.
(A) Schematic summary of genome-wide CRISPR/Cas9 screen. (B) Top 5 GO term enrichment analysis of 585 statistically significant (P-value < 0.05) candidates identified in genome-wide CRISPR/Cas9 screen. Candidates were categorised into biological process (BP), cellular component (CC), and molecular function (MF), and the x-axis represents the gene counts. (C) Data from DNA sequencing showing sgRNA target sites (highlighted in red) and PAM sequence (highlighted in blue). (D) qRT-PCR analysis of FBXO11 mRNA in WT, FBXO11−/−, and C5aR1−/− macrophages. FBXO11 mRNA levels were normalised to GAPDH, and fold change relative to WT shown. Mean ± SEM of three independent biological replicates shown. ns = not significant; *** = P < 0.001; by one-way ANOVA followed by Dunnett’s multiple comparison test. (E) Immunoblot analysis of FBXO11 isoform 4 and 1 in WT, FBXO11−/−, and C5aR1−/− macrophages. Protein abundance was normalised to α-tubulin and represented as fold change compared with WT macrophages. Mean ± SEM of three independent biological replicates shown. ns = not significant; **** = P < 0.0001; by one-way ANOVA followed by Dunnett’s multiple Ccomparison test. (F) Brightfield microscopy showing morphology of WT and FBXO11−/− macrophages following PMA differentiation. Scale bar corresponds to 100 μm. (G) Live cell imaging showing the percentage of Draq7-positive (dead) WT and FBXO11−/− macrophages treated with PBS, PVL (62.5 ng/ml), LukAB (62.5 ng/ml), and nigericin (10 μM). Mean ± SEM of three independent biological replicates shown. * = P < 0.05 for WT versus FBXO11−/− (E3) at 15 h post toxin treatment; ** = P < 0.01 for WT versus FBXO11−/− (E2) at 15 h post toxin treatment; by unpaired t test. Source data are available for this figure.
Figure 2.
Figure 2.. FBXO11−/− macrophages have reduced C5aR1 cell surface expression.
(A) Live cell imaging showing the percentage of Draq7-positive (dead) WT and C5aR1−/− macrophages to PBS or PVL (62.5 ng/ml). Mean ± SEM of three independent biological replicates shown. ** = P < 0.01 for WT versus C5aR1−/− at 15 h post toxin treatment; by unpaired t test. (B) Flow cytometric analysis and median fluorescence intensity of C5aR1 cell surface expression. Grey line represents isotype negative control, black line represents WT macrophages, red and blue lines represent FBXO11−/− (E2 and E3, respectively), and dark grey line represents C5aR1−/− macrophages. Mean ± SEM of three independent biological replicates shown. * = P < 0.05, ** = P < 0.01; by one-way ANOVA followed by Dunnett’s multiple comparison test. (C) Confocal microscopy images of WT, FBXO11−/−, and C5aR1−/− macrophages. PFA-fixed cells were stained using anti-C5aR1 (green), and nuclei were stained with DAPI (blue). Scale bar corresponds to 100 μM. (D) Immunoblot analysis of C5aR1 in WT, FBXO11−/−, and C5aR1−/− macrophages. Protein abundance was normalised to β-actin and represented as fold change compared with WT macrophages. Mean ± SEM of three independent biological replicates shown. *** = P < 0.001, **** = P < 0.0001; by one-way ANOVA followed by Dunnett’s multiple comparison test. (E) Immunoblot analysis of C5aR1 in WT macrophages that were treated with CHX (20 μg/ml) with or without MG132 for the indicated amount of time before cell lysate collection. Protein abundance was normalised to β-actin and represented as fold change compared with WT macrophage. Mean ± SEM of three independent biological replicates shown. ns = not significant; by two-way ANOVA with Sidak’s multiple comparisons test. (F) qRT-PCR analysis of C5aR1 mRNA in WT, FBXO11−/−, and C5aR1−/− macrophages. C5aR1 levels were normalised to GAPDH, and fold change relative to WT macrophage shown. Mean ± SEM of three independent biological replicates shown. * = P < 0.05, ** = P < 0.01; by one-way ANOVA followed by Dunnett’s multiple comparison test. (G) Flow cytometric analysis and MFI of recombinant LukS-PV subunit binding to WT and FBXO11−/− macrophages. Grey line represents isotype, dotted black line represents no LukS-PV negative control, solid black line represents WT macrophages, and red and blue lines represent FBXO11−/− macrophages treated with LukS-PV (E2 and E3, respectively). *** = P < 0.001, **** = P < 0.0001; by two-way ANOVA with Sidak’s multiple comparisons test. (H) Western blot analysis of WT and FBXO11−/− macrophages treated with LukS-PV over time. Protein abundance was normalised to α-tubulin and represented as fold change compared with WT macrophages at respective time points. Recombinant LukS-PV is included in the left lane. Mean ± SEM of three independent biological replicates shown. *** = P < 0.001, **** = P < 0.0001;by two-way ANOVA with Sidak’s multiple comparisons test. Source data are available for this figure.
Figure S1.
Figure S1.. Cell surface expression of PVL- and LukAB-specific receptors.
Flow cytometric analysis and MFI of C5L2, CD45, and CD11b cell surface expression. Grey line represents isotype negative control, black line represents WT macrophages, and red and blue lines represent FBXO11−/− macrophages (E2 and E3, respectively). Mean ± SEM of three independent biological replicates shown. ns = not significant; * = P < 0.05, ** = P < 0.01, *** = P < 0.001; by one-way ANOVA followed by Dunnett’s multiple comparison test.
Figure 3.
Figure 3.. Ectopic expression of C5aR1 restores cell susceptibility to PVL.
(A) Graphical summary of the generation of doxycycline inducible C5aR1 overexpression THP1 monocytes using the lentiviral vector pTRE3G-C5aR1. (B) Western blot analysis of C5aR1 in pTRE3G-C5aR1 transfected cells—WT-pTRE3G-C5aR1 and FBXO11−/− (E2) pTRE3G-C5aR1 THP1 monocytes and macrophages. Cells were treated with or without doxycycline (1 μg/ml) for 24 h to induce C5aR1 expression. Abbreviations: macrophages (mΦ); monocytes (mono); doxycycline (Dox). Protein abundance was normalised to β-actin and represented as fold change compared with untreated cells. Mean ± SEM of three independent biological replicates shown. ns = not significant, * = P < 0.05; by two-way ANOVA with Sidak’s multiple comparisons test. (C) Flow cytometric analysis and MFI of C5aR1 cell surface expression on WT and FBXO11−/− (E2) macrophages treated with (black line) or without (red line) doxycycline (1 μg/ml). The grey line represents isotype negative control. Representative of three independent experiments. ns = not significant, **** = P < 0.0001; by two-way ANOVA with Sidak’s multiple comparisons test. (D) Live cell imaging showing the percentage of Draq7-positive (dead) untransfected WT macrophages, and pTRE3G-C5aR1 transfected WT and FBXO11−/− (E2) macrophages to PVL (125 ng/ml). Cells were treated with or without doxycycline (1 μg/ml) for 24 h before toxin treatment. Mean ± SEM of three independent experiments shown. ** = P < 0.01 for “+PVL” versus “+PVL +Dox” at 15 h post toxin treatment; by unpaired t test. Source data are available for this figure.
Figure S2.
Figure S2.. Cell surface expression of CD11b and CD45 after C5aR1 overexpression.
(A, B) Flow cytometric analysis and MFI of (A) CD11b and (B) CD45 cell surface expression in WT and FBXO11−/− (E2) macrophages containing pTRE3G-C5aR1 treated with or without doxycycline (1 μg/ml). Mean ± SEM of three independent biological replicates shown. ns = not significant; by two-way ANOVA with Sidak’s multiple comparisons test.
Figure 4.
Figure 4.. LPS affects C5aR1 expression and PVL susceptibility in FBXO11-deficient macrophages.
(A) Schematic illustration of THP1 PMA–induced differentiation and LPS treatment. (B) Western blot analysis of C5aR1 in WT and FBXO11−/− macrophages, treated with or without LPS for 24 h. Protein abundance was normalised to β-actin and represented as fold change compared with untreated WT macrophages. Mean ± SEM of three independent biological replicates shown. ns = not significant; * = P < 0.05; by two-way ANOVA with Sidak’s multiple comparisons test. (C) qRT-PCR analysis of relative C5aR1 mRNA level, comparing the LPS-treated and -untreated macrophages. The mRNA levels were normalised to the control values of GAPDH, and fold change was LPS-treated cells that were compared with untreated WT macrophages. Mean ± SEM of three independent biological replicates shown. ns = not significant; * = P < 0.05; by two-way ANOVA with Sidak’s multiple comparisons test. (D) Flow cytometric analysis and MFI of C5aR1 in LPS-treated or -untreated WT and FBXO11−/− macrophages. Grey line represents isotype, black line represents untreated, and red line represents LPS-treated macrophages. Mean ± SEM of three independent biological replicates shown. ns = not significant; ** = P < 0.01; by two-way ANOVA with Sidak’s multiple comparisons test. (E) Live cell imaging showing the percentage of Draq7-positive (dead) LPS-treated or -untreated WT and FBXO11−/− macrophages treated with PVL (62.5 ng/ml). Mean ± SEM of three independent biological replicates shown. * = P < 0.05, ** = P < 0.01, *** = P < 0.001 for + PVL versus + PVL + LPS at 14 h post toxin treatment; by unpaired t test. Source data are available for this figure.
Figure S3.
Figure S3.. Effect of LPS treatment on CD45 and CD11b expression.
(A) Western blot analysis of C5aR1 and FBXO11 protein expression in WT and FBXO11−/− (E2) macrophages, exposed to LPS (100 ng/ml), S. aureus (MOI 10), or heat-killed S. aureus (MOI 10) for 3 h. Protein abundance was normalised to α-tubulin and represented as fold change compared with untreated WT macrophages. Mean ± SEM of three independent biological replicates shown. ns = not significant; by two-way ANOVA with Sidak’s multiple comparisons test. (B, C) Flow cytometric analysis and MFI of (B) CD45 and (C) CD11b protein expression in untreated (black line) and LPS-treated (red line) WT, and FBXO11−/− macrophages. Mean ± SEM of three independent biological replicates shown. ns = not significant; **** = P < 0.0001; by two-way ANOVA with Sidak’s multiple comparisons test. (D) Live cell imaging showing the percentage of Draq7-positive (dead) LPS-treated WT and FBXO11−/− macrophages treated with LukAB (62.5 ng/ml). Mean ± SEM of three independent biological replicates shown. * = P < 0.05 for +LukAB versus + LukAB +LPS at 15 h post toxin treatment; by unpaired t test. Source data are available for this figure.
Figure 5.
Figure 5.. FBXO11−/− macrophages exhibit higher IL-1β production.
(A, B) WT, FBXO11−/−, and (B) C5aR1−/− macrophages were primed with LPS (100 ng/ml) for 3 h before PVL (62.5 ng/ml), LukAB (15.6 ng/ml), or nigericin (10 μM) treatment for 2 h. Il-1β in culture supernatants were determined by ELISA. Mean ± SEM of three independent biological replicates shown. ns = not significant,; * = P < 0.05, *** = P < 0.001, **** = P < 0.0001; by two-way ANOVA followed by Sidak’s multiple comparisons test. Abbreviation: Nig, nigericin. (C) Western blot analysis of pro-IL-1β (34 kD) and cleaved IL-1β (17 kD) in cell lysates and supernatants of WT and FBXO11−/− macrophages treated with LPS and/or toxins. Protein abundance was normalised to β-actin and represented as fold change compared with WT macrophages. Abbreviation: S, short exposure; L, long exposure. Mean ± SEM of three independent biological replicates shown. ns = not significant; by two-way ANOVA with Sidak’s multiple comparisons test. (D) Western blot analysis of pro-IL-1β in whole cell lysates of unprimed THP1 cells. Monocyte (Mono) was differentiated with PMA, and macrophages were cultured in PMA-free media for the indicated amount of time. Protein abundance was normalised to β-actin and represented as fold change compared with monocytes. Mean ± SEM of three independent biological replicates shown. ns = not significant; * = P < 0.05, ** = P < 0.01, *** = P < 0.001; by two-way ANOVA with Sidak’s multiple comparisons test. (E) Western blot analysis of NLRP3 in whole-cell lysates of WT and FBXO11−/− macrophage. Protein abundance was normalised to β-actin and represented as fold change compared with WT macrophages. Mean ± SEM of three independent biological replicates shown. ns = not significant; by one-way ANOVA followed by Dunnett’s multiple comparison test. (F) Western blot analysis of pro-IL-1β and MCL-1 in WT and FBXO11−/− macrophages. Cells were primed with LPS (100 ng/ml) for 2 h, with MG132 (20 μM) and Q-VD-OPh (20 μM) added in the last 30 min alongside. Cells were then treated with CHX (20 μg/ml) with or without MG132 for the indicated amount of time before cell lysate collection. Protein abundance was normalised to α-tubulin and represented as fold change compared with WT macrophages. Mean ± SEM of three independent biological replicates shown. ns = not significant; by two-way ANOVA with Sidak’s multiple comparisons test. (G) Western blot analysis of pro-IL-1β in WT and FBXO11−/− macrophage cell lysates and TUBE-isolated ubiquitinated proteins. WT* indicates agarose beads only as control. (H) qRT-PCR analysis of relative IL-1β mRNA level. The mRNA levels were normalised to the control values of GAPDH. Mean ± SEM of three independent biological replicates shown. * = P < 0.05, ** = P < 0.01; by one-way ANOVA followed by Dunnett’s multiple comparison test. Source data are available for this figure.
Figure 6.
Figure 6.. Loss of BCL-6 promotes CD40 and IL-1β but not C5aR1 expression.
(A) Western blot analysis of BCL-6 and CD40 in WT and FBXO11−/− macrophage whole-cell lysate. Protein abundance was normalised to α-tubulin and represented as fold change compared with untreated WT macrophages. Mean ± SEM of three independent biological replicates shown. ns = not significant, * = P < 0.05, ** = P < 0.01; by one-way ANOVA followed by Dunnett’s multiple comparison test. (B) qRT-PCR analysis of CD40 mRNA in WT and FBXO11−/− macrophages. CD40 mRNA levels were normalised to GAPDH, and fold change relative to WT macrophage shown. Mean ± SEM of three independent biological replicates shown. **** = P < 0.0001; by one-way ANOVA followed by Dunnett’s multiple comparison test. (C) Flow cytometric analysis and MFI of CD40 cell surface expression. Grey line represents isotype negative control, black line represents WT macrophages, and red and blue lines represent FBXO11−/− macrophages (E2 and E3, respectively). Mean ± SEM of three independent biological replicates shown. ns = not significant; by one-way ANOVA followed by Dunnett’s multiple comparison test. (D) Western blot analysis of BCL-6, CD40, C5aR1, and IL-1β in WT and FBXO11−/− macrophage whole-cell lysate treated with or without BI-3802 (1 or 5 μM) during recovery period. Protein abundance was normalised to α-tubulin and represented as fold change compared with untreated WT macrophages at respective time points. Mean ± SEM of three independent biological replicates shown. ns = not significant; * = P < 0.05, ** = P < 0.01, *** = P < 0.001; by two-way ANOVA with Sidak’s multiple comparisons test. (E) qRT-PCR analysis of CD40, C5aR1, and IL-1β mRNA in WT and FBXO11−/− macrophages treated with or without BI-3802 (5 μM). mRNA levels were normalised to GAPDH, and fold change relative to WT macrophage shown. Mean ± SEM of three independent biological replicates shown. ns = not significant; * = P < 0.05, ** = P < 0.01; by two-way ANOVA with Sidak’s multiple comparisons test. (F) BI-3802 (5 μM) untreated or treated WT, FBXO11−/− (E2) macrophages were treated with PVL (62.5 ng/ml), LukAB (62.5 ng/ml) or nigericin (10 μM) for 2 h. Il-1β levels in culture supernatants were determined by ELISA. Mean ± SEM of three independent biological replicates shown. ns = not significant; ** = P < 0.01, *** = P < 0.001, **** = P < 0.0001; by two-way ANOVA followed by Sidak’s multiple comparisons test. Abbreviation: Nig, nigericin. Source data are available for this figure.

References

    1. Abbas T, Dutta A (2011) CRL4Cdt2: Master coordinator of cell cycle progression and genome stability. Cell Cycle 10: 241–249. 10.4161/cc.10.2.14530 - DOI - PMC - PubMed
    1. Abida WM, Nikolaev A, Zhao W, Zhang W, Gu W (2007) FBXO11 promotes the Neddylation of p53 and inhibits its transcriptional activity. J Biol Chem 282: 1797–1804. 10.1074/jbc.M609001200 - DOI - PMC - PubMed
    1. Ainscough JS, Frank Gerberick G, Zahedi-Nejad M, Lopez-Castejon G, Brough D, Kimber I, Dearman RJ (2014) Dendritic cell IL-1α and IL-1β are polyubiquitinated and degraded by the proteasome. J Biol Chem 289: 35582–35592. 10.1074/jbc.M114.595686 - DOI - PMC - PubMed
    1. Baron BW, Nucifora G, McCabe N, Espinosa R 3rd, Le Beau MM, McKeithan TW (1993) Identification of the gene associated with the recurring chromosomal translocations t(3;14)(q27;q32) and t(3;22)(q27;q11) in B-cell lymphomas. Proc Natl Acad Sci U S A 90: 5262–5266. 10.1073/pnas.90.11.5262 - DOI - PMC - PubMed
    1. Basso K, Dalla-Favera R (2010) BCL6: Master regulator of the germinal center reaction and key oncogene in B cell lymphomagenesis. Adv Immunol 105: 193–210. 10.1016/S0065-2776(10)05007-8 - DOI - PubMed

Publication types

LinkOut - more resources