. 2023 Mar 28;14(1):1726.
doi: 10.1038/s41467-023-37223-3.

Domain-specific p53 mutants activate EGFR by distinct mechanisms exposing tissue-independent therapeutic vulnerabilities

Affiliations

Domain-specific p53 mutants activate EGFR by distinct mechanisms exposing tissue-independent therapeutic vulnerabilities

Teresa Lai Fong Ho et al. Nat Commun. .

Abstract

Mis-sense mutations affecting TP53 promote carcinogenesis both by inactivating tumor suppression, and by conferring pro-carcinogenic activities. We report here that p53 DNA-binding domain (DBD) and transactivation domain (TAD) mis-sense mutants unexpectedly activate pro-carcinogenic epidermal growth factor receptor (EGFR) signaling via distinct, previously unrecognized molecular mechanisms. DBD- and TAD-specific TP53 mutants exhibited different cellular localization and induced distinct gene expression profiles. In multiple tissues, EGFR is stabilized by TAD and DBD mutants in the cytosolic and nuclear compartments respectively. TAD mutants promote EGFR-mediated signaling by enhancing EGFR interaction with AKT via DDX31 in the cytosol. Conversely, DBD mutants maintain EGFR activity in the nucleus, by blocking EGFR interaction with the phosphatase SHP1, triggering c-Myc and Cyclin D1 upregulation. Our findings suggest that p53 mutants carrying gain-of-function, mis-sense mutations affecting two different domains form new protein complexes that promote carcinogenesis by enhancing EGFR signaling via distinctive mechanisms, exposing clinically relevant therapeutic vulnerabilities.


Conflict of interest statement

The authors declare no competing interests.

Figures
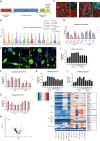
Fig. 1
Fig. 1. TAD and DBD-mutant colorectal tumors and cells bear unique molecular differences.
A Domain structure of p53. B Frequency of different domain-specific TP53 mutations as reported in tissue-specific cancers. C Representative immunofluorescence staining of p53 (red) in colorectal tumor tissues. DAPI staining (cyan) shows nuclei. Scale bar = 30 μm. D Quantification of the percentage of cells with cytosolic p53 staining in TAD mutant colorectal tumors (Mean ± SEM). Different regions of the tumor (TC: tumor core; TIF: tumor invasive front) and surrounding normal tissue (2 cm and 5 cm from the tumor invasive front) were analyzed. Each mutation represents an individual patient. E Representative immunofluorescence staining of p53 (green) in HCT116 cells expressing TP53 mutants. DAPI staining shows nuclei. n = 3 independent experiments. Scale bar = 10 μm. F, G Quantification of p53 protein turnover in HCT116 (F) cytosolic and (G) nuclear cellular fractions following treatment with cycloheximide. n = 2. H Volcano plot of IP-MS analysis of TP53 mutant expressing HCT116 cells. Each point represents a p53 protein interactor with adjusted p values on the y axis and log fold change in abundance on the x axis. Proteins with negative log fold change in abundance are relatively enriched in TAD mutant cells (red and purple points) while those with positive log fold change in abundance are relatively enriched in DBD-mutant cells (blue points). I Heat map indicating differential sensitivities of HCT116 and MCF7 cells expressing WT and mutant p53 to a customized library of small molecule inhibitors. Compounds are grouped according to signaling and metabolic pathways and/or molecular function. n = 2. HCT_WT_V1 contains endogenous p53 while HCT_WT_2 is a p53 null line where WT p53 has been reintroduced. Cell lines expressing the TAD mutants W23Y and DT and DBD-mutant R248W were used. JL Quantification of protein levels of J pAKT, K pS6K and L pmTOR in HCT116 cells expressing WT and mutant p53. n = 2. Source data are provided as a Source Data file.
Fig. 2
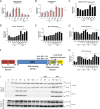
Fig. 2. TAD and DBD mutant p53 stabilize EGFR and promote different facets of EGFR function.
A, B Quantification of EGFR protein turnover in HCT116 A cytosolic and B nuclear cellular fractions following treatment with cycloheximide. n = 2. CE Quantification of C pEGFR (Y1101), D Cyclin D1 and E c-Myc protein levels in HCT116 cells expressing WT and mutant p53. Statistical tests performed on TAD versus DBD. n = 2. F Domain structure of p53 with nuclear localization (NLS) and export signal (NES) residues indicated. G, H Quantification of G Cyclin D1 and H pAKT protein levels in HCT116 cells expressing WT and mutant p53. n = 2. I Protein levels of EGFR and AKT pulled down with p53 and/or EGFR in HCT116 and H1299 cells expressing WT and mutant p53. n = 2. Two-tailed unpaired Student’s t test was performed on TAD (n = 3 independent mutants) versus DBD (n = 3 independent mutants). (*p < 0.05, **p < 0.01, ***p < 0.001, ****p < 0.0001). Source data are provided as a Source Data file.
Fig. 3
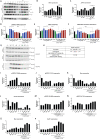
Fig. 3. TAD mutants promote EGFR-AKT signaling while DBD mutants reduce EGFR-SHP1 interaction.
A Protein levels of EGFR, AKT and pAKT in input cytosolic fractions from HCT116 cells expressing TAD mutants under untreated and cycloheximide-treated conditions. Protein levels of AKT pulled down with EGFR. n = 2. B, C Quantification of B AKT and C pAKT protein levels in HCT116 cells expressing TAD mutants under untreated and cycloheximide-treated conditions. Statistical tests performed on TAD (n = 3 independent mutants) versus TAD + CHX (n = 3 independent mutants). n = 2. DF Quantification of cytosolic D pEGFR (Y1068), E pAKT, and F AKT (after EGFR pulldown) protein levels in HCT116 cells expressing WT and mutant p53 under untreated and DDX31 siRNA treated conditions. Statistical tests performed on TAD (n = 3 independent mutants) versus TAD + DDX31 siRNA (n = 3 independent mutants). n = 2. G Protein levels of SHP1 pulled down with EGFR or p53 in HCT116 and H1299 cells expressing WT and mutant p53. n = 2. H Table of EGFR mutants with contrasting affinities for SHP1 used in this study. IL Quantification of I, J pEGFR, K c-Myc, and L Cyclin D1 protein levels in HCT116 cells expressing DBD mutants. Cells were treated with EGFR siRNA and expressed EGFR EpoR (high affinity for SHP1). n = 2. MP Quantification of M, N p EGFR, O c-Myc, and P Cyclin D1 protein levels in HCT116 cells expressing DBD mutants. Cells were treated with EGFR siRNA and expressed EGFR Y1173F (reduced affinity for SHP1). n = 2. Two-tailed unpaired Student’s t test was performed. (*p < 0.05, **p < 0.01, ***p < 0.001, ****p < 0.0001). Source data are provided as a Source Data file.
Fig. 4
Fig. 4. p53 TAD and DBD mutant CRC tumors recapitulate differential EGFR-dependent changes.
AC Quantification of A c-Myc, B Cyclin D1, and C nuclear pEGFR (Y1101) protein levels in p53 null and TAD and DBD mutant patient colorectal tumors. DF Quantification of D nuclear SHP1 (after EGFR pulldown), E cytosolic AKT (after EGFR pulldown), and F cytosolic DDX31 (after EGFR pulldown) protein levels in p53 null and TAD and DBD mutant patient colorectal tumors. HCT116 cells expressing WT p53 as a control. All statistical tests performed on TAD (n = 7 independent patients) versus DBD (n = 9 independent patients). Two-tailed unpaired Student’s t test was performed. (*p < 0.05, **p < 0.01, ***p < 0.001, ****p < 0.0001). Source data are provided as a Source Data file.
Fig. 5
Fig. 5. TAD and DBD mutants interact with EGFR at specific sites.
A Structure of the modeled EGFR-p53TAD mutant complexes. EGFR is shown with its surface colored by the electrostatic potential (with red to blue colors corresponding to potentials of −5 kcal/mol to + 5 kcal/mol) and the p53 TAD peptides shown as cartoon (TAD1: Cyan, TAD2: yellow). Top middle: zoom in view of the EGFR-p53TAD2 complex, with EGFR and p53TAD2 shown as cartoon, with residues E685 from EGFR and K52/Q52 from TAD2 shown as sticks; the likely salt bridge between E685 and K52 is highlighted in dashed lines (black). Top right: zoom in view of the EGFR-p53TAD2 complex, with EGFR and p53TAD2 shown as cartoon and the suggested mutation E685K in EGFR and Q52K in TAD2 shown as sticks. Bottom right: view of the EGFR-p53TAD complex highlighting the interactions (black dashed lines) between residue F688 from EGFR with residue Q53 from TAD2 and K690 from EGFR with residue S54 from TAD2. Top left: zoom in view of the EGFR-p53TAD1 complex with residue K715 from EGFR and W23Y from Tad1 shown as sticks; the likely hydrogen bond interaction between K715-Y23 is highlighted in dashed lines (black). Bottom left: zoom in view of the EGFR-p53TAD1 complex highlighting the interactions (back dashed lines) between residue K704 from EGFR and residue Q22 from TAD1 and K715 from EGFR and residue S23 from TAD1. B Structure of EGFR-p53DBDR175H complex. EGFR is shown with its surface colored according to the electrostatic potential (with red to blue color corresponding to −5kcal/mol to + 5 kcal/mol) and the p53DBD-R175H shown as cartoon (Cyan) with the solvent exposed hydrophobic patch highlighted in magenta. Top left: zoom in view of EGFR-p53 DBD-R175H shown as cartoon and residues F113, L114 from p53 DBD and L736, L758 from EGFR shown as sticks. Top right: zoom in view of the mutant EGFR-p53DBD-R175H complex, highlighting the disruption of hydrophobic interactions due to L736K and L758K mutations. C, D Quantification of EGFR (after p53 pulldown) protein levels in HCT116 cells expressing (C) EGFR mutants that disrupt TAD binding (E685K, E685F) and D mutants that disrupt DBD binding (L736K, L758K). n = 2. E, F Quantification of pAKT and c-Myc protein levels in HCT116 cells expressing E EGFR mutants that disrupt TAD binding (E685K, E685F) and F mutants that disrupt DBD binding (L736K, L758K). n = 2. Source data are provided as a Source Data file.
Fig. 6
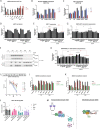
Fig. 6. Presence of TAD mutants confer resistance to EGFR inhibition.
A Quantification of pEGFR (pan) protein levels in HCT116 cells expressing WT and mutant p53 treated with EGFR inhibitor. n = 2. B, C Quantification of B nuclear pEGFR (pan) and C whole-cell c-Myc protein levels in HCT116 cells expressing WT and mutant p53 treated with EGFR inhibitor. n = 2. D, E Quantification of D pAKT and E SGLT1 protein levels in HCT116 cells expressing WT and mutant p53 and treated with EGFRi. n = 2. F Protein levels of cytosolic and nuclear EGFR pulled down with p53 in HCT116 and H1299 cells expressing WT and mutant p53. n = 2. G, H Quantification of G AKT (after EGFR pulldown) and H SGLT1 (after EGFR pulldown) protein levels in HCT116 cells expressing WT and mutant p53 and treated with EGFRi. n = 2. I Dose response curves of HCT116 cells expressing WT and mutant p53 treated with EGFR inhibitor in combination with mTORi. n = 3 independent experiments. J, K Quantification of crystal violet intensity from colony formation assays using SAECK cells constitutively expressing WT and mutant p53. Cells were treated with J EGFRi or EGFRi+mTORi and K inducible expression of shControl or shEGFR and/or shmTOR n = 4 independent replicates. Error bars denote Mean ± SEM. p < 0.0001 for DBD untreated vs DBD EGFRi/DBD shEGFR and TAD untreated vs TAD EGFRi+mTORi/shEGFR+shmTOR (n = 3 mutants each). L Quantification of tumor volume of xenograft tumors derived from HCT116 cells constitutively expressing WT and mutant p53 with inducible knockdown of EGFR and mTOR. n = 2–5 mice and n = 4-10 tumors per mutant per shRNA condition. Individual data points denote individual tumors. Statistical tests performed on TAD or DBD shControl versus shEGFR or shEGFR+shmTOR. Two-tailed unpaired Student’s t test was performed. (*p < 0.05, **p < 0.01, ***p < 0.001, ****p < 0.0001). M Model of TAD and DBD mutant p53 modulation of cytoplasmic and nuclear EGFR functions respectively. Created with BioRender.com. Source data are provided as a Source Data file.

References

    1. Oren M, Rotter V. Mutant p53 gain-of-function in cancer. Cold Spring Harb. Perspect. Biol. 2010;2:a001107. doi: 10.1101/cshperspect.a001107. - DOI - PMC - PubMed
    1. Bargonetti J, Prives C. Gain-of-function mutant p53: history and speculation. J. Mol. Cell Biol. 2019;11:605. doi: 10.1093/jmcb/mjz067. - DOI - PMC - PubMed
    1. Walerych D, Lisek K, Del G. Sal, mutant p53: one, no one, and one hundred thousand. Front. Oncol. 2015;5:289. doi: 10.3389/fonc.2015.00289. - DOI - PMC - PubMed
    1. Sabapathy K, Lane DP. Therapeutic targeting of p53: all mutants are equal, but some mutants are more equal than others. Nat. Rev. Clin. Oncol. 2018;15:13. doi: 10.1038/nrclinonc.2017.151. - DOI - PubMed
    1. Kim MP, Lozano G. Mutant p53 partners in crime. Cell Death Differ. 2018;25:161. doi: 10.1038/cdd.2017.185. - DOI - PMC - PubMed

Publication types

MeSH terms

Substances