. 2023 Mar 29;12(1):80.
doi: 10.1038/s41377-023-01115-4.

Correlative light-electron microscopy using small gold nanoparticles as single probes

Affiliations

Correlative light-electron microscopy using small gold nanoparticles as single probes

Iestyn Pope et al. Light Sci Appl. .

Abstract

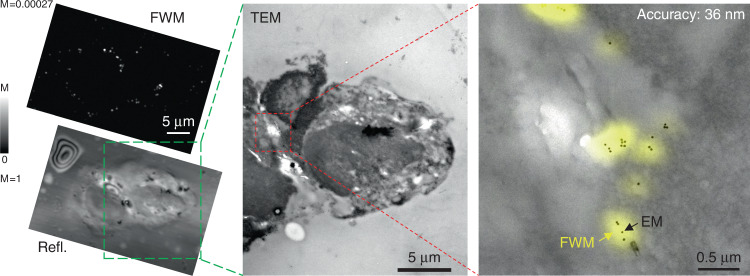
Correlative light-electron microscopy (CLEM) requires the availability of robust probes which are visible both in light and electron microscopy. Here we demonstrate a CLEM approach using small gold nanoparticles as a single probe. Individual gold nanoparticles bound to the epidermal growth factor protein were located with nanometric precision background-free in human cancer cells by light microscopy using resonant four-wave mixing (FWM), and were correlatively mapped with high accuracy to the corresponding transmission electron microscopy images. We used nanoparticles of 10 nm and 5 nm radius, and show a correlation accuracy below 60 nm over an area larger than 10 µm size, without the need for additional fiducial markers. Correlation accuracy was improved to below 40 nm by reducing systematic errors, while the localisation precision is below 10 nm. Polarisation-resolved FWM correlates with nanoparticle shapes, promising for multiplexing by shape recognition in future applications. Owing to the photostability of gold nanoparticles and the applicability of FWM microscopy to living cells, FWM-CLEM opens up a powerful alternative to fluorescence-based methods.


Conflict of interest statement

The authors declare no competing interests.

Figures

Fig. 1
Fig. 1. Correlative light electron microscopy using FWM imaging.
a Sketch of FWM setup. Short optical pulses in resonance with the LSPR of AuNPs are focused onto the sample, using an inverted microscope, and generate a FWM field which is collected in epi-geometry, detected with a heterodyne interference scheme (see Methods). AOM: acousto-optic modulator. (P)BS: (polarising) beam splitter. P: polariser. MO: microscope objective. b Example of volumetric FWM microscopy on a single 10nm-radius AuNP, with line-profiles along x and z at the y-position in the centre of the AuNP and corresponding Gaussian fits (red lines). The centroid localisation precision (δx0, δz0) and the fullwidth at half maximum (FWHM) obtained from the fit are indicated. c CLEM of 10nm-radius AuNPs bound to the EGF protein in HeLa cells. Individual AuNPs are detected background-free in FWM (left), measured directly on 300 nm thick resin sections post-cell fixation, ready for EM analysis. The same pattern is found in TEM, highlighted by the orange circles. Two cells are visible, with their nucleus indicated (N). The nucleus is surrounded by the organelle-containing cytoplasm. The top row shows crops (0.2 µm × 0.2 µm) of the TEM image for each AuNP as numbered. The confocal reflection image simultaneously acquired with FWM is shown underneath the TEM image. Greyscales are from 0 to M as indicated (M = 1 correspond to 31 mV rms detected, see also Methods for details of the excitation and detection conditions)
Fig. 2
Fig. 2. FWM dependence on the AuNP aspect ratio and orientation.
High-magnification TEM images of selected nanoparticles (numbered as in Fig. 1c) were fitted with an elliptical shape (shown in yellow). AuNP 15 is not captured by the TEM overview in Fig. 1c and is shown in SI Fig. S2 and Fig. S7. The corresponding major and minor axis and the orientation angle γ were obtained (see also sketch). The ratio of the cross- to co-circularly polarised FWM components in amplitude (AFWM/AFWM+) and phase ΦFWMΦFWM+ is shown versus the in-plane elliptical aspect ratio and orientation angle. Vertical error bars represent the single-pixel shot noise in the FWM measurements. Single-sided horizontal bars were obtained by fitting the TEM images with a variable contrast threshold (see text). For AFWM/AFWM+, red (blue) lines are calculated dependences assuming a prolate (oblate) ellipsoid with axis a > b = c (a < b = c) aligned along the x, y, z directions respectively. Dotted lines assume that the NP a and c axis are tilted by 45 degrees in the x, z plane, having a projected axis in the x direction as derived in Section S3.i
Fig. 3
Fig. 3. CLEM correlation accuracy.
Overlay of FWM field amplitude (yellow) and TEM image (grey) from Fig. 1c (contrast adjusted for visibility). The FWM image is transformed into the EM reference system using a linear transformation matrix that accounts for translation, rotation, shear and scaling (see text). The correlation accuracy is indicated
Fig. 4
Fig. 4. Surface height profile of resin section in FWM imaging.
Colour-coded height profile (blue: 0, red: 8.51 µm) obtained from the phase of the reflected probe field, shown in the inset on a grey scale from −π (black) to π (white), for the region in Fig. 1c and Fig. S7. The FWM field amplitude of AuNPs is overlaid on the left panel and AuNPs are labelled. The surface profile shows height differences of several microns, indicating a ripple in the pioloform layer and the supported 300 nm thin resin section. AuNPs labelled in red are those excluded from the CLEM correlation analysis as they are too out of focus (AuNP 10 is 1.9 µm below and AuNP 13 is 0.8 µm above AuNP 5). Scale bar: 10 µm
Fig. 5
Fig. 5. CLEM correlation accuracy with 5nm-radius AuNPs.
HeLa cells incubated with 5nm-radius AuNPs bound to the EGF protein. Individual AuNPs are detected background-free in FWM (left) measured on 300 nm thin resin sections post-cell fixation, ready for EM analysis. The confocal reflection image simultaneously acquired with FWM is shown below (linear grey scales are from m to M as indicated; M = 1 correspond to 65 mV rms detected, see Methods for details of the excitation and detection conditions). A large overview TEM of the same region is shown. On the area indicated by the black dashed frame, a series of high resolution EM images were taken and stitched together. Individual AuNPs are highlighted by the circles. The overlay between FWM (yellow) and TEM (grey) is shown on the centre and further zoomed into the indicated red dashed area on the right side (contrast adjusted to aid visualisation). For the correlation analysis, of the 19 individual AuNPs highlighted by the circles, 6 (white circles) were discarded as being of focus. The FWM image was transformed into the EM reference system using a linear transformation matrix that accounts for translation, rotation, shear and scaling of axes. On the right side, individual AuNPs identified in FWM (yellow spots) are seen in EM (black dots). The correlation accuracy is indicated
Fig. 6
Fig. 6. CLEM correlation accuracy with 3D FWM analysis.
FWM-CLEM using 10 nm-radius AuNPs bound to EGF internalised in HeLa cells whereby the coordinates of the particles in FWM are measured in 3D via a z-stack. A large FWM overview in 2D with corresponding reflection image measured simultaneously is shown on the left (linear grey scales are from 0 to M as indicated; M = 1 corresponds to 33 mV rms detected; see Methods for details of the excitation and detection conditions). A TEM overview of the same region is shown in the centre, as indicated by the green dashed frame. On the right, an overlay of FWM field amplitude (yellow) and TEM image (grey) is shown for the region highlighted by the red dashed frame, where FWM is a maximum amplitude projection from a 3D z-stack (50 nm step size in z). AuNPs form small clusters and are no longer resolved as individual particles in FWM. The centroid position of each cluster was determined in 3D from the FWM z-stack (see Methods), and its 2D in-plane coordinates were compared with the position of the geometrical centre of the cluster in TEM (which is a 2D transmission projection) for the correlation analysis. The resulting correlation accuracy from the comparison of the six clusters shown in the figure is indicated
Fig. 7
Fig. 7. FWM-CLEM workflow.
Sections are first visualised by bright-field transmission and DIC microscopy, followed by simultaneous reflection and FWM imaging. Sections are then retrieved for TEM analysis, where the same cell regions are identified. a Bright-field transmission microscopy overview image using white-light illumination (halogen tungsten lamp V2-A LL 100 W; Nikon) with a 0.72NA dry condenser, a 10 × 0.3 NA dry objective, and a monochrome CCD camera (Hamamatsu Orca-285). It shows three sections with some folds in section 2 and another imperfection at the top of section 2. b Higher magnification DIC image (red boxed area from a), using white-light illumination, a 1.34 NA oil condenser, a 60 × 1.27 NA water objective and a colour consumer camera (Canon EOS 40D); the folds are visible as well as the outlines of cells and other features in the section. c Confocal reflection of the corresponding blue boxed area (on an amplitude log scale from 0.1 mV (black) to 200 mV (white) rms detected). d FWM acquired simultaneously with reflection, as a maximum amplitude projection over a z-stack (on an amplitude log scale, contrast adjusted for visual purposes). e The grid is retrieved for TEM analysis and a similar overview image is acquired. f Higher magnification TEM showing the same folds and outlines as in (b), as highlighted by the blue frame. g Magnified crop of the TEM area in (f) where parts of the cells are recognised as seen in confocal reflection c. h Overlay of the reflection, FWM and TEM area. FWM was acquired with a pump-probe delay time of 0.5 ps, pump (probe) power at the sample of 30 µW (15 µW), 1-ms-pixel dwell time, pixel size in plane 72 nm, 500 nm step size in z and 13 z steps (6 µm total range). A high-resolution TEM image is shown in (i) for the region indicated by the orange frame in (d) and (h). An overlay of the AuNPs seen in FWM (yellow) and this TEM area is provided in (j), where the nucleus has been highlighted in blue, the mitochondria in red and segments of the plasma membrane in green. Scale bar in (e) is 250 μm and also applies to (a); scale bar in (f) is 20 μm and also applies to (b); scale bar in (d) is 20 μm and also applies to (c), (g) and (h); scale bar in (i) is 1 μm and also applies to (j)

References

    1. Ando T, et al. The 2018 correlative microscopy techniques roadmap. J. Phys. D: Appl. Phys. 2018;51:443001. doi: 10.1088/1361-6463/aad055. - DOI - PMC - PubMed
    1. Muller-Reichert, T. & Verkade, P. Correlative light and electron microscopy. In Methods in Cell Biology (Elsevier, Academic Press, Cambridge MA, United States, 2021, Series Editors: Leslie Wilson and Phong Tran).
    1. Brown E, Verkade P. The use of markers for correlative light electron microscopy. Protoplasma. 2010;244:91–97. doi: 10.1007/s00709-010-0165-1. - DOI - PubMed
    1. Tanner H, et al. Fluorescent platinum nanoclusters as correlative light electron microscopy probes. Methods Cell Biol. 2021;162:39–68. doi: 10.1016/bs.mcb.2020.12.002. - DOI - PubMed
    1. Kandela IK, Albrecht RM. Fluorescence quenching by colloidal heavy metals nanoparticles: Implications for correlative fluorescence and electron microscopy studies. Scanning. 2007;29:152–161. doi: 10.1002/sca.20055. - DOI - PubMed