

Crop Type Maps for Operational Global Agricultural Monitoring
- PMID: 36977689
- PMCID: PMC10050185
- DOI: 10.1038/s41597-023-02047-9
Crop Type Maps for Operational Global Agricultural Monitoring
Abstract
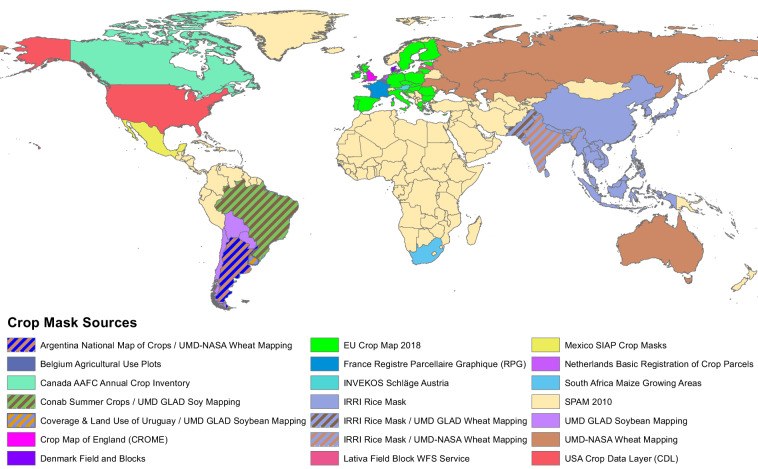
Crop type maps identify the spatial distribution of crop types and underpin a large range of agricultural monitoring applications ranging from early warning of crop shortfalls, crop condition assessments, production forecasts, and damage assessment from extreme weather, to agricultural statistics, agricultural insurance, and climate mitigation and adaptation decisions. Despite their importance, harmonized, up-to-date global crop type maps of the main food commodities do not exist to date. To address this critical data gap of global-scale consistent, up-to-date crop type maps, we harmonized 24 national and regional datasets from 21 sources covering 66 countries to develop a set of Best Available Crop Specific masks (BACS) over the major production and export countries for wheat, maize, rice, and soybeans, in the context of the G20 Global Agriculture Monitoring Program, GEOGLAM.
© 2023. The Author(s).
Conflict of interest statement
There are no known conflicts of interest associated with this article and there has been no significant financial support for this work that could have influenced its outcome. The primary source of external funding for this work is from the NASA Applied Sciences Program in addition to the in-kind contributions from all the crop monitor partner agencies.
Figures
References
-
- Rezaei EE, Ghazaryan G, Moradi R, Dubovyk O, Siebert S. Crop harvested area, not yield, drives variability in crop production in Iran. Environ. Res. Lett. 2021;16:064058. doi: 10.1088/1748-9326/abfe29. - DOI
-
- Becker-Reshef I, et al. The GEOGLAM crop monitor for AMIS: Assessing crop conditions in the context of global markets. Global Food Security. 2019;23:173–181. doi: 10.1016/j.gfs.2019.04.010. - DOI
-
- Cannes Summit Final Declaration. G20 Information Centre (2011).
-
- Hao P, Tang H, Chen Z, Meng Q, Kang Y. Early-season crop type mapping using 30-m reference time series. Journal of Integrative Agriculture. 2020;19:1897–1911. doi: 10.1016/S2095-3119(19)62812-1. - DOI
-
- Whitcraft AK, Becker-Reshef I, Justice CO. Agricultural growing season calendars derived from MODIS surface reflectance. International Journal of Digital Earth. 2014;8:173–197. doi: 10.1080/17538947.2014.894147. - DOI
Publication types
Grants and funding
- 80NSSC18K1571 P00008/National Aeronautics and Space Administration (NASA)
- 80NSSC18K1571 P00008/National Aeronautics and Space Administration (NASA)
- 80NSSC18K1571 P00008/National Aeronautics and Space Administration (NASA)
- 80NSSC18K1571 P00008/National Aeronautics and Space Administration (NASA)
- 80NSSC18K1571 P00008/National Aeronautics and Space Administration (NASA)
LinkOut - more resources
Full Text Sources
Miscellaneous
