. 2023 Mar 28;13(1):5074.
doi: 10.1038/s41598-023-31818-y.

A low dose of RBD and TLR7/8 agonist displayed on influenza virosome particles protects rhesus macaque against SARS-CoV-2 challenge

Affiliations

A low dose of RBD and TLR7/8 agonist displayed on influenza virosome particles protects rhesus macaque against SARS-CoV-2 challenge

Gerrit Koopman et al. Sci Rep. .

Abstract

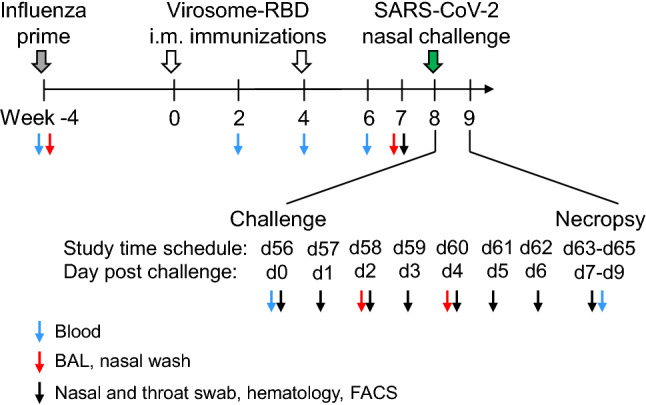
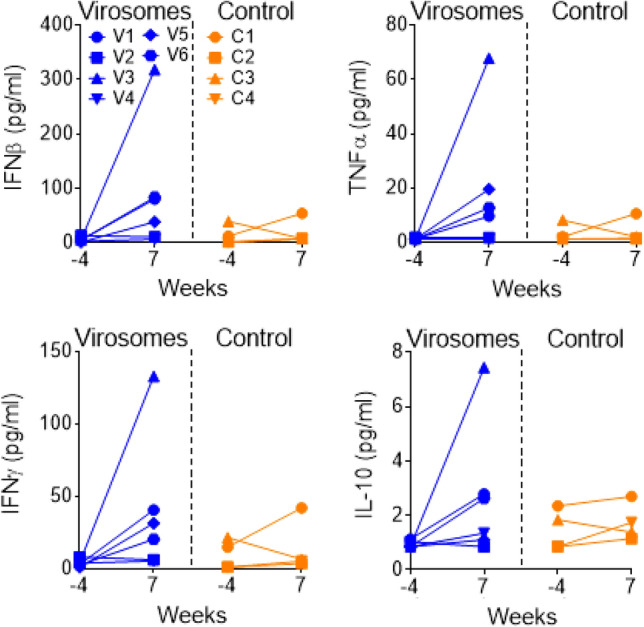
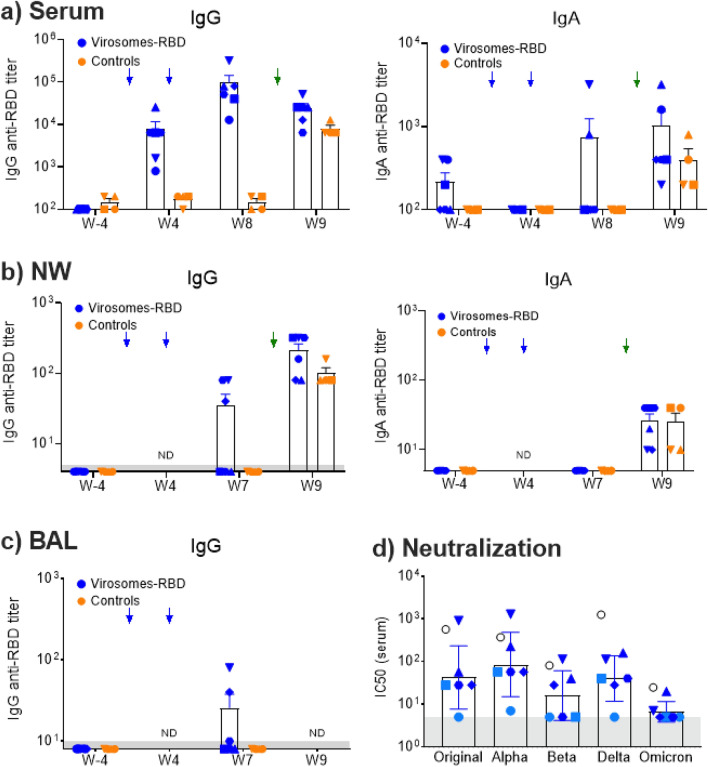
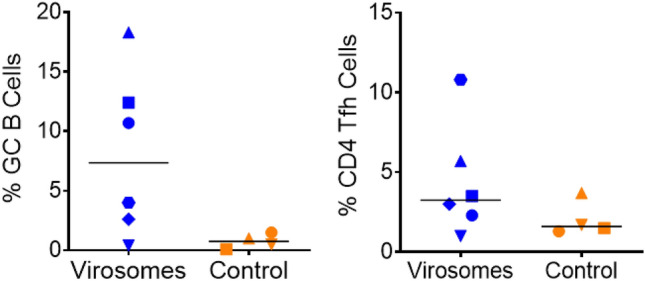
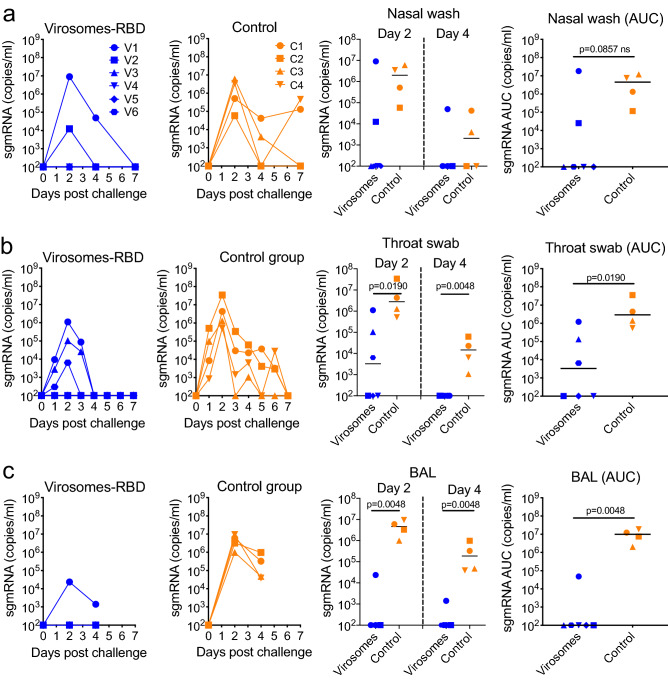
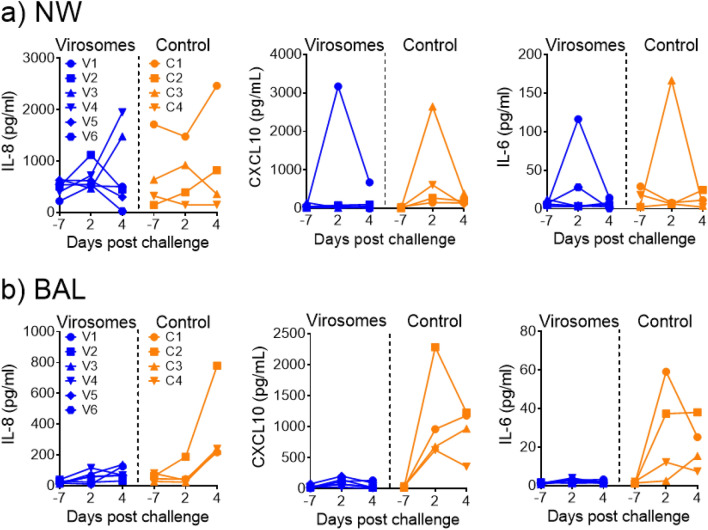
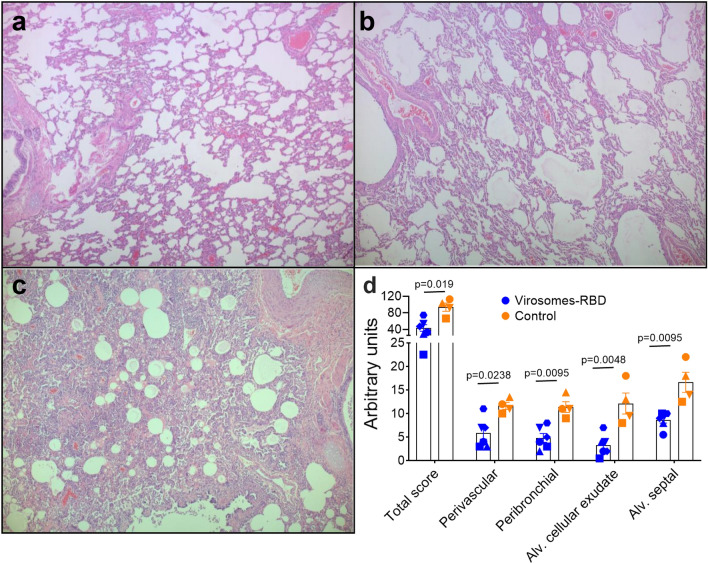
Influenza virosomes serve as antigen delivery vehicles and pre-existing immunity toward influenza improves the immune responses toward antigens. Here, vaccine efficacy was evaluated in non-human primates with a COVID-19 virosome-based vaccine containing a low dose of RBD protein (15 µg) and the adjuvant 3M-052 (1 µg), displayed together on virosomes. Vaccinated animals (n = 6) received two intramuscular administrations at week 0 and 4 and challenged with SARS-CoV-2 at week 8, together with unvaccinated control animals (n = 4). The vaccine was safe and well tolerated and serum RBD IgG antibodies were induced in all animals and in the nasal washes and bronchoalveolar lavages in the three youngest animals. All control animals became strongly sgRNA positive in BAL, while all vaccinated animals were protected, although the oldest vaccinated animal (V1) was transiently weakly positive. The three youngest animals had also no detectable sgRNA in nasal wash and throat. Cross-strain serum neutralizing antibodies toward Wuhan-like, Alpha, Beta, and Delta viruses were observed in animals with the highest serum titers. Pro-inflammatory cytokines IL-8, CXCL-10 and IL-6 were increased in BALs of infected control animals but not in vaccinated animals. Virosomes-RBD/3M-052 prevented severe SARS-CoV-2, as shown by a lower total lung inflammatory pathology score than control animals.


Conflict of interest statement

S.F. and T.S. own equity in the mother company Mymetics Corporation that holds Mymetics BV and Mymetics SA. The remaining authors G.K., M.A., E.J.V., B.E.V., F.B., D.B., K.P.B., Z.F., G.K.-K., D.M., D.E.V., H.N., R.F.A., I.K., Y.S.K., W.M. J. M.B., and P.M. declare that the research was conducted in the absence of any financial and non-financial (also S.F. and T.S.) relationships that could be construed as a potential conflict of interest.

Figures

Figure 1
Figure 1
Immunization and challenge schedule in rhesus macaques. Four weeks before vaccination (week -4), Rhesus macaques of the virosome vaccine group (n = 6) and the control group (n = 4) were immunized intramuscularly (i.m.) with inactivated influenza virus particles (grey arrow) to prime immune responses against influenza specifically the hemagglutinin (HA). Subsequently, animals of the vaccine group were immunized at weeks 0 and 4 by the i.m. route with influenza-derived virosomes displaying the RBD derived from the SARS-CoV-2 Wuhan strain (open arrow). At week 8 (day 56: d56 of the study design), all animals were challenged (corresponding to d0) by the combined intranasal and intratracheal route with 1 × 105 TCID50 of SARS-CoV-2 (green arrow). At different timepoints before and after challenge (d56 to d63-d65), diverse types of samples were collected, as indicated by color coded arrowheads. Animals were sacrificed either at day 7 (d63), 8 (d64) or 9 (d65) post-challenge.
Figure 2
Figure 2
Cytokine responses in nasal washes during immunization. IFNβ (upper left panel), TNFα (upper right panel), IFNγ (lower left panel) and IL-10 (lower right panel) cytokine levels (pg/mL) measured in nasal washes, either before immunization (week -4) or three weeks after the second immunization (week 7). Macaques immunized with virosomes-RBD (V1 to V6 in blue) and control animals (C1 to C4 in orange). Each animal is represented by a different symbol. For the serum, week -4 versus week 7 (21 days after last immunization), the vaccinated group is not significantly different from the control group for IFNβ, TNFα, IFNγ and IL-10 (Mann–Whitney test). However, there is a significant increase of cytokines in nasal washes of virosome vaccinated animals (week-4 versus week 7, Mann–Whitney test) for IFNβ (p = 0.087), TNFα (p = 0.013), IFNγ (p = 0.087), and IL-10 (p = 0.433), while these increases are not observed in control animals.
Figure 3
Figure 3
RBD specific IgG and IgA ELISA and serum neutralizing activity. (a) ELISA serum IgG (left graph) and IgA (right graph) antibody titers overtime toward SARS-CoV-2 RBD are shown for the vaccinated and control group. Serum IgG titers at week 4 (p = 0.0095) and week 8 (p = 0.0095) are significanlty higher in the vaccinated group than the control group, but at week 9 there is no significant difference (p = 0.076). (b) ELISA nasal wash (NW) IgG (left graph) and IgA (right graph) antibody titers overtime against SARS-CoV-2 RBD. (c) ELISA BAL IgG (left graph) antibody titers overtime against SARS-CoV-2 RBD. Each animal is represented by a symbol, blue for vaccinated animals and orange for control animals. Mean and SEM are shown in columns for each group of animals. Blue arrows indicate the day of immunization at week 0 and week 4, green arrow the day of the challenge at d56/week 8. For IgA in serums, NWs and BALs, there was no significant difference between the groups (p > 0.05). (d) Individual serum neutralizing antibody titers from week 8/d56 were determined by neutralization assays with five different live SARS-CoV-2 strains. The determined geomean (GM) neutralizing titers (NT) are the following: Italian strain INMI1 from 2019 as an original Wuhan-like (GM NT 42), Alpha B.1.1. 7 (GM NT 85), Beta B.1.351 (GM NT 16), Delta B.1.617.2 (GM NT 40) and Omicron B.1.1.529 (geomean NT 7). There was no significant differences for the neutralizing titers between the Wuhan-like original strain with the Beta (p = 0.125) and Delta strain (p = 0.750), but a higher neutralizing titer against the Alpha strain was observed (p = 0.031). However, we observe an apparent reduced neutralizing activity toward the Omicron strain, respective to the Wuhan. The closed circles and squares in light blue are animals with the lowest serum RBD titers that are also the oldest animals. NIBSC 21/234 serves as a positive control (open black circle). The grey area is the baseline observed for pre-immune neutralizing activity (dilution 1/5), and serums for the V1 and V2 old animals. Data points beneath this area are below the detection limit.
Figure 4
Figure 4
Immunization with Virosomes-RBD induces germinal center B cells in the spleen. The relative percentage of germinal center (GC) B cells over total B cells (left panel) and CD4 + T follicular helper cells (Tfh) over total CD4 + T cells (right panel) in the spleen is shown. Virosomes-RBD vaccinated (blue) and control animals (orange). Median values are indicated by horizontal black lines. Although we observed an increase in the percentage of GC B cells in the spleen at the day of necropsy in the virosomes-RBD group, it does not reach the 0.05 significance threhold (p = 0.068), in part because the increase was observed for only 3 out of 6 animals. Tfh cells were not significantly different between the virosomes-RBD vaccine and the control group (p = 0.325).
Figure 5
Figure 5
Control of SARS-CoV-2 replication by virosomes-RBD vaccine. SARS-CoV-2 sgRNA load (copies/mL) and area under the curve (AUC) for the sgRNA load (copies/mL) in nasal washes (a), throat (b) and lung bronchoalveolar lavages (BAL) (c) of virosomes-RBD immunized macaques (blue, left panels) and control animals (orange, middle panels) at different days post-challenge. Each animal is represented by a symbol. All data are shown relative to the day of challenge (day 0, day of virus administration) done at day 56 of the study. Panels on the right show statistical evaluation on SARS-CoV-2 sgRNA load in nasal washes on day 2 and 4 (upper right), in the throat (middle right panel) and in BAL fluid on day 2 and 4 (lower right panel). Median values are indicated by horizontal black lines. Significant differences between the groups are indicated in the graph by a horizontal line and p-value (Mann–Whitney test).
Figure 6
Figure 6
Control of SARS-CoV-2-induced cytokine storm in BAL fluids, but not in nasal washes, after intramuscular virosomes-RBD vaccination. Pro-inflammatory cytokine levels of IL-8, CXCL10 and IL-6 in (a) nasal washes (NW) and (b) BAL fluid of virosomes-RBD immunized (blue) and control (orange) animals. All data are shown relative to the day of challenge (day 0). Levels in each individual animal (indicated by different symbols) in time are shown. No measurements were performed on day of challenge, but data obtained at day 7 before challenge are shown.
Figure 7
Figure 7
Immunization with virosomes-RBD reduces lung inflammatory pathology. Lung histopathology visualized by light microscopy of hematoxylin and eosin (H&E) tissue staining of lung lobes from representative animals of each group. (a) Lung tissue from an uninfected animal showing intact pulmonary structures and lack of inflammation. (b) Lung tissue of animal V3 from the virosomes-RBD vaccine group exhibits minimal to mild interstitial infiltrate of inflammatory cells, and rare oedema and fibrin. (c) Lung tissue of animal C1 from unvaccinated, infected (control) group with histological features of moderate to severe interstitial inflammation, alveolar cellular infiltrates, abundant oedema and frequent fibrin presence. Image magnification 50x, representative images are shown. (d) Lung inflammatory pathology scores for the vaccinated (blue dots) and control group (orange dots). The total pathology score as well as the scores for perivascular inflammatory infiltrates, peribronchiolar inflammatory infiltrates, alveolar cellular exudate, and alveolar septal inflammatory cells are shown for animals immunized with virosomes-RBD (blue symbols) and control animals (orange symbols). Maximum total score is 336 and maximum score per individual parameter is 28. Significant differences between the groups are indicated in the graph by a horizontal line and p-value (Mann–Whitney test).

References

    1. Li Q, et al. Early transmission dynamics in Wuhan, China, of novel coronavirus-infected pneumonia. N. Engl. J. Med. 2020;382:1199–1207. doi: 10.1056/NEJMoa2001316. - DOI - PMC - PubMed
    1. Zhou P, et al. A pneumonia outbreak associated with a new coronavirus of probable bat origin. Nature. 2020;579:270–273. doi: 10.1038/s41586-020-2012-7. - DOI - PMC - PubMed
    1. Wu P, et al. Real-time tentative assessment of the epidemiological characteristics of novel coronavirus infections in Wuhan, China, as at 22 January 2020. Euro. Surveill. 2020 doi: 10.2807/1560-7917.ES.2020.25.3.2000044. - DOI - PMC - PubMed
    1. Morawska L, Cao J. Airborne transmission of SARS-CoV-2: The world should face the reality. Environ. Int. 2020;139:105730. doi: 10.1016/j.envint.2020.105730. - DOI - PMC - PubMed
    1. Zhang R, Li Y, Zhang AL, Wang Y, Molina MJ. Identifying airborne transmission as the dominant route for the spread of COVID-19. Proc. Natl. Acad. Sci. U.S.A. 2020;117:14857–14863. doi: 10.1073/pnas.2009637117. - DOI - PMC - PubMed

Publication types