. 2023 Mar 28;13(1):5032.
doi: 10.1038/s41598-023-32035-3.

Lonafarnib and everolimus reduce pathology in iPSC-derived tissue engineered blood vessel model of Hutchinson-Gilford Progeria Syndrome

Affiliations

Lonafarnib and everolimus reduce pathology in iPSC-derived tissue engineered blood vessel model of Hutchinson-Gilford Progeria Syndrome

Nadia O Abutaleb et al. Sci Rep. .

Abstract

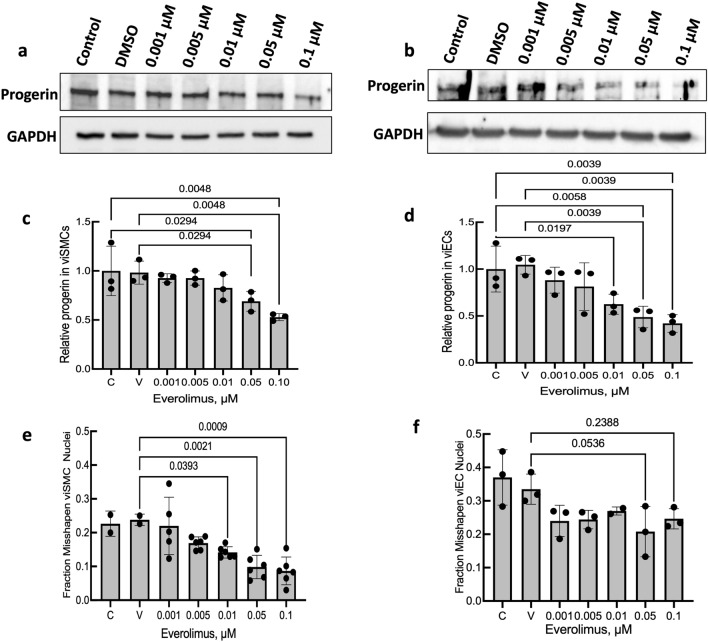
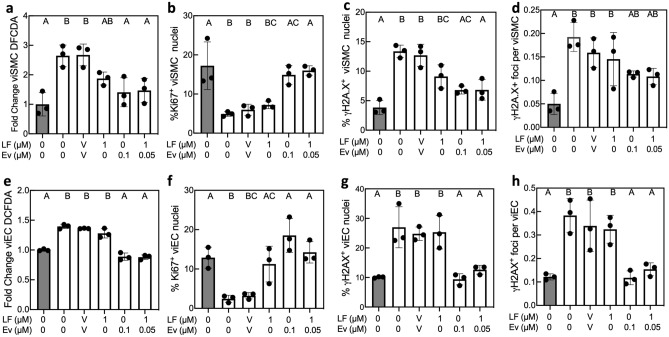
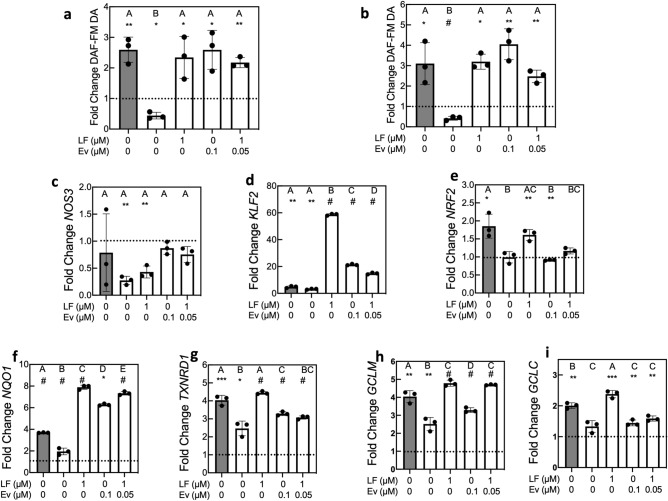
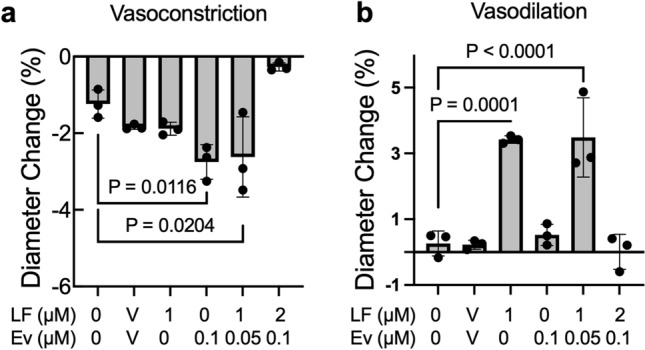
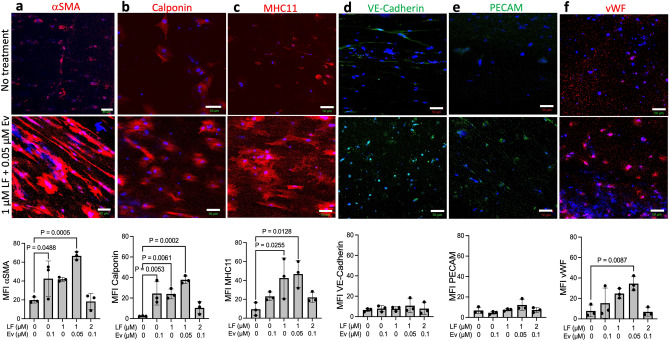
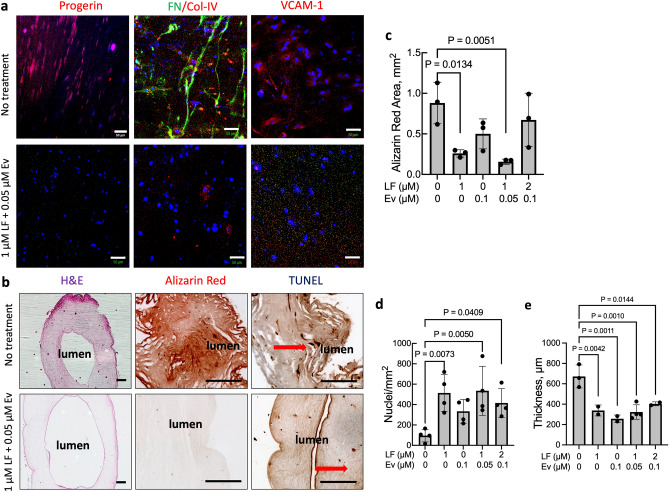
Hutchinson-Gilford Progeria Syndrome (HGPS) is a rare, fatal genetic disease that accelerates atherosclerosis. With a limited pool of HGPS patients, clinical trials face unique challenges and require reliable preclinical testing. We previously reported a 3D tissue engineered blood vessel (TEBV) microphysiological system fabricated with iPSC-derived vascular cells from HGPS patients. HGPS TEBVs exhibit features of HGPS atherosclerosis including loss of smooth muscle cells, reduced vasoactivity, excess extracellular matrix (ECM) deposition, inflammatory marker expression, and calcification. We tested the effects of HGPS therapeutics Lonafarnib and Everolimus separately and together, currently in Phase I/II clinical trial, on HGPS TEBVs. Everolimus decreased reactive oxygen species levels, increased proliferation, reduced DNA damage in HGPS vascular cells, and improved vasoconstriction in HGPS TEBVs. Lonafarnib improved shear stress response of HGPS iPSC-derived endothelial cells (viECs) and reduced ECM deposition, inflammation, and calcification in HGPS TEBVs. Combination treatment with Lonafarnib and Everolimus produced additional benefits such as improved endothelial and smooth muscle marker expression and reduced apoptosis, as well as increased TEBV vasoconstriction and vasodilation. These results suggest that a combined trial of both drugs may provide cardiovascular benefits beyond Lonafarnib, if the Everolimus dose can be tolerated.


Conflict of interest statement

The authors declare no competing interests.

Figures

Figure 1
Figure 1
Everolimus reduces progerin expression and misshapen nuclei in HGPS viSMCs and viECs. (a, b) Cropped images of Western blot gels of progerin and (c, d) quantification in HGPS 167 CL2 viSMCs (a) and viECs (b) treated with Everolimus (Ev). Entire gels for each of the experiments performed with viSMCs and viECs are shown in Fig. S2. Data presented as fold change progerin expression compared with untreated HGPS control. ‘V’ indicates DMSO vehicle control. (e, f) Misshapen nuclei in HGPS 167 CL2 viSMCs (e) and viECs (f) treated with Everolimus for 7 days. Representative images are shown in Fig. S4. ‘V’ indicates DMSO vehicle control. Data presented as mean ± SD. N = 2–6 experiments per group.
Figure 2
Figure 2
Everolimus reduces ROS levels, increases proliferation, and decreases DNA damage in HGPS 167 CL2 viSMCs and viECs. Healthy viSMCs (ad) and viECs (eh) and HGPS 167 CL2 viSMCs and viECs were treated with different combinations of Lonafarnib (LF) and Everolimus (Ev). ‘V’ indicates DMSO vehicle control. viECs and viSMCs from healthy donors are shown as gray bars and HGPS viECs and viSMCs are shown as white bars. Fold change of DCFDA mean fluorescence intensity compared with healthy in viSMCs (a) and viECs (e). Percent positive Ki67 nuclei in viSMCs (b) and viECs (f). Percent nuclei with ɣH2A.X foci in viSMCs (c) and viECs (g). Number of ɣH2A.X foci per total cells in viSMCs (d) and viECs (h). Data presented as mean ± SD. N = 3 experiments per group. Groups connected by the same letter are not significantly different from each other (p > 0.05). Groups labeled with different letters are significantly different from each other (p < 0.05). Exact p-values for significant differences are provided in Table S1.
Figure 3
Figure 3
Lonafarnib and Everolimus improve NO production and flow-mediated gene expression in HGPS viECs exposed to physiological shear stress. (a, b) DAF-FM diacetate (DA) mean fluorescence intensity (MFI) in healthy (gray), HGPS 167 CL2 (a), and HGPS 003 CL1D (b) viECs exposed to 12 dynes/cm2 for 24 h. Data presented as fold change DAF-FM DA MFI under shear stress compared with static condition from the same group. Gray bar represents healthy viECs. (c-i) Gene expression of (c) NOS3, (d) KLF2, (e) NRF2, (f) NQO1, (g) TXNRD1, (h) GCLM, and (i) GCLC in HGPS 167 CL2 viECs exposed to 12 dynes/cm2. Data were normalized to GAPDH expression and gene expression in viECs exposed to shear stress was normalized to respective viECs under static culture from the same group. Dashed line indicates normalized static control. Data presented as mean ± SD. N = 3 experiments per group. Asterisks indicate significant differences between each shear stress value and its own static control: *p < 0.05, **p < 0.01, ***p < 0.001, #p < 0.0001. Letters indicate significant differences between treatment groups under shear stress: groups labeled with different letters are significantly different from each other (p < 0.05). Exact p-values for significant differences for comparisons between treatment groups under shear stress are provided in Table S2.
Figure 4
Figure 4
Lonafarnib and Everolimus treatment improves HGPS TEBV vasoactivity. HGPS 167 CL2 TEBVs were matured for 3 weeks, treated with Lonafarnib (LF) and Everolimus (Ev) for 1 week, then exposed to 1 µM phenylephrine followed by 1 µM acetylcholine for 5 min each and diameter change measured. Data presented as mean ± SD. N = 3 experiments per group. Results are compared to the reference condition without Lonafarnib and Everolimus.
Figure 5
Figure 5
Lonafarnib and Everolimus treatment improves expression of contractile proteins in HGPS TEBVs. HGPS 167 CL2 TEBVs were matured for 3 weeks, treated with Lonafarnib (LF) and Everolimus (Ev) for 1 week and then processed for immunostaining. Representative images and quantification of SMC markers α-smooth muscle actin (αSMA, a), calponin (b), and myosin heavy chain-11 (MHC11, c) and endothelial markers vascular endothelial cadherin (VE-Cadherin, d), platelet endothelial cell adhesion molecule (PECAM, e), and von Willebrand factor (vWF, f). Scale bar: 50 µm. Data presented as mean ± SD. N = 3 experiments per group. Results are compared to the reference condition without Lonafarnib and Everolimus using Dunnett’s test. Representative images for the 1 µM Lonafarnib treatment, 0.1 µM Everolimus treatment, and 2 µM Lonafarnib + 0.1 µM Everolimus treatment conditions are shown in Fig. S11.
Figure 6
Figure 6
Lonafarnib and Everolimus treatment mitigates HGPS TEBV pathology. Representative immunofluorescence images of (a) progerin, fibronectin (FN), collagen IV (Col-IV), vascular cell adhesion molecule-1 (VCAM-1), and (b) H&E staining, alizarin red staining, and TUNEL staining in HGPS 167 CL2 TEBVs matured for 3 weeks then treated with 1 µM Lonafarnib (LF) + 0.05 µM Everolimus (Ev) for 1 week. Scale bar 50 µm for progerin, FN/Col-IV, and VCAM-1, and 200 µm for H&E, alizarin red, and TUNEL. (c) Quantification of alizarin red-positive area in untreated and treated HGPS 167 Cl2 TEBVs. (d) Nuclei density and (e) TEBV thickness in untreated and treated HGPS 167 CL2 TEBVs. Data presented as mean ± SD. N = 3 TEBVs per group for alizarin red and 4 TEBVs per group for cell density. *p < 0.05, **p < 0.01 compared with untreated case. Representative images for the 1 µM Lonafarnib treatment, 0.1 µM Everolimus treatment, and 2 µM Lonafarnib + 0.1 µM Everolimus treatment conditions are shown in Figs. S12 and S13.

References

    1. Gordon, L. B., Brown, W. T. & Collins, F. S. in GeneReviews® (eds M. Adam, P. et al.) (University of Washington, 2019).
    1. Strandgren C, Revêchon G, Carvajal AS, Eriksson M. Emerging candidate treatment strategies for Hutchinson-Gilford progeria syndrome. Biochem. Soc. Trans. 2017;45:1279–1293. doi: 10.1042/BST20170141. - DOI - PubMed
    1. Gordon LB, et al. Association of lonafarnib treatment vs no treatment with mortality rate in patients with hutchinson-gilford progeria syndrome. JAMA. 2018;319:1687–1695. doi: 10.1001/jama.2018.3264. - DOI - PMC - PubMed
    1. Olive M, et al. Cardiovascular pathology in hutchinson-gilford progeria: Correlation with the vascular pathology of aging. Arterioscler. Thromb. Vasc. Biol. 2010;30:2301–2309. doi: 10.1161/atvbaha.110.209460. - DOI - PMC - PubMed
    1. Merideth MA, et al. Phenotype and course of hutchinson-gilford progeria syndrome. N. Engl. J. Med. 2008;358:592–604. doi: 10.1056/NEJMoa0706898. - DOI - PMC - PubMed

Publication types