

Abdominal fat and muscle distributions in different stages of colorectal cancer
- PMID: 36978044
- PMCID: PMC10044362
- DOI: 10.1186/s12885-023-10736-2
Abdominal fat and muscle distributions in different stages of colorectal cancer
Abstract
Background: The purpose of this study is to explore the difference of abdominal fat and muscle composition, especially subcutaneous and visceral adipose tissue, in different stages of colorectal cancer (CRC).
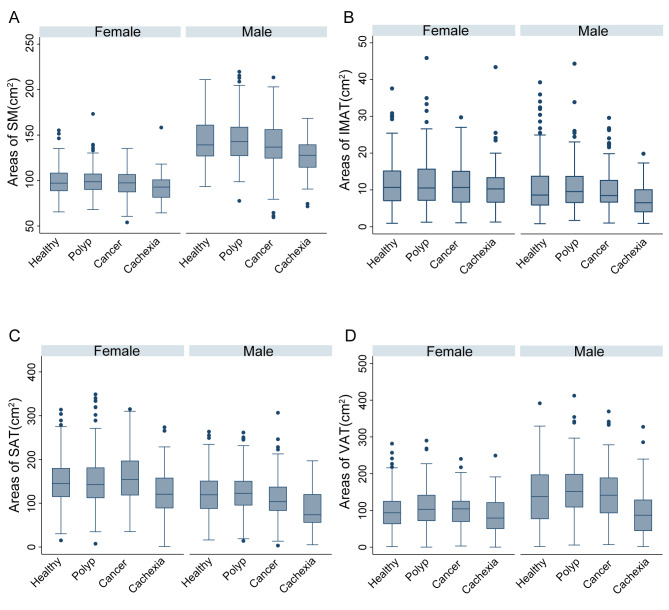
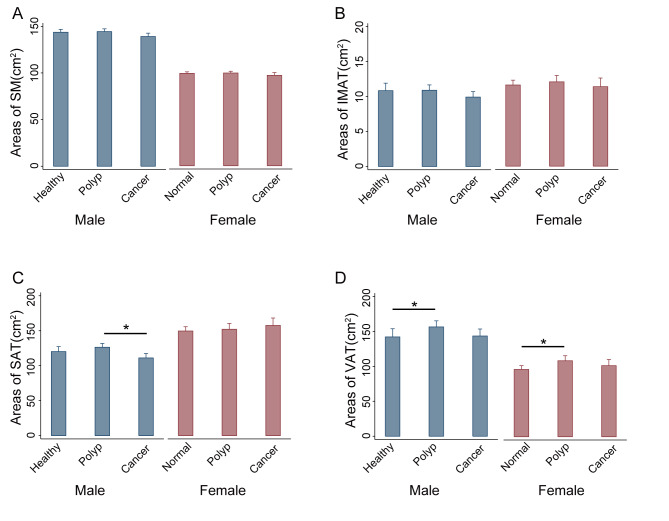
Materials and methods: Patients were divided into 4 groups: healthy controls (patients without colorectal polyp), polyp group (patients with colorectal polyp), cancer group (CRC patients without cachexia), and cachexia group (CRC patients with cachexia). Skeletal muscle (SM), subcutaneous adipose tissue (SAT), visceral adipose tissue (VAT), and intermuscular adipose tissue (IMAT) were assessed at the third lumbar level on computed tomography images obtained within 30 days before colonoscopy or surgery. One-way ANOVA and linear regression were used to analyze the difference of abdominal fat and muscle composition in different stages of CRC.
Results: A total of 1513 patients were divided into healthy controls, polyp group, cancer group, and cachexia group, respectively. In the development of CRC from normal mucosa to polyp and cancer, the VAT area of the polyp group was significantly higher than that of the healthy controls both in male (156.32 ± 69.71 cm2 vs. 141.97 ± 79.40 cm2, P = 0.014) and female patients (108.69 ± 53.95 cm2 vs. 96.28 ± 46.70 cm2, P = 0.044). However, no significant differences were observed of SAT area between polyp group and healthy controls in both sexes. SAT area decreased significantly in the male cancer group compared with the polyp group (111.16 ± 46.98 cm2 vs. 126.40 ± 43.52 cm2, P = 0.001), while no such change was observed in female patients. When compared with healthy controls, the SM, IMAT, SAT, and VAT areas of cachexia group was significantly decreased by 9.25 cm2 (95% CI: 5.39-13.11 cm2, P < 0.001), 1.93 cm2 (95% CI: 0.54-3.32 cm2, P = 0.001), 28.84 cm2 (95% CI: 17.84-39.83 cm2, P < 0.001), and 31.31 cm2 (95% CI: 18.12-44.51 cm2, P < 0.001) after adjusting for age and gender.
Conclusion: Abdominal fat and muscle composition, especially SAT and VAT, was differently distributed in different stages of CRC. It is necessary to pay attention to the different roles of subcutaneous and visceral adipose tissue in the development of CRC.
Keywords: Cancer cachexia; Colorectal cancer; Colorectal polyp; Subcutaneous adipose tissue; Visceral adipose tissue.
© 2023. The Author(s).
Conflict of interest statement
The authors declare that they have no competing interests.
Figures
References
-
- Greuter MJ, Demirel E, Lew JB, Berkhof J, Xu XM, Canfell K, et al. Long-term impact of the dutch Colorectal Cancer Screening Program on Cancer incidence and mortality-model-based exploration of the serrated pathway. Cancer Epidemiol Biomarkers Prev. 2016;25:135–44. doi: 10.1158/1055-9965.EPI-15-0592. - DOI - PubMed
MeSH terms
Grants and funding
LinkOut - more resources
Full Text Sources
Medical
Research Materials
