

Identifying potential biomarkers for the diagnosis and treatment of IgA nephropathy based on bioinformatics analysis
- PMID: 36978098
- PMCID: PMC10044383
- DOI: 10.1186/s12920-023-01494-y
Identifying potential biomarkers for the diagnosis and treatment of IgA nephropathy based on bioinformatics analysis
Abstract
Background: IgA nephropathy (IgAN) has become the leading cause of end-stage renal disease in young adults. Nevertheless, the current diagnosis exclusively relies on invasive renal biopsy, and specific treatment is deficient. Thus, our study aims to identify potential crucial genes, thereby providing novel biomarkers for the diagnosis and therapy of IgAN.
Methods: Three microarray datasets were downloaded from GEO official website. Differentially expressed genes (DEGs) were identified by limma package. GO and KEGG analysis were conducted. Tissue/organ-specific DEGs were distinguished via BioGPS. GSEA was utilized to elucidate the predominant enrichment pathways. The PPI network of DEGs was established, and hub genes were mined through Cytoscape. The CTD database was employed to determine the association between hub genes and IgAN. Infiltrating immune cells and their relationship to hub genes were evaluated based on CIBERSORT. Furthermore, the diagnostic effectiveness of hub markers was subsequently predicted using the ROC curves. The CMap database was applied to investigate potential therapeutic drugs. The expression level and diagnostic accuracy of TYROBP was validated in the cell model of IgAN and different renal pathologies.
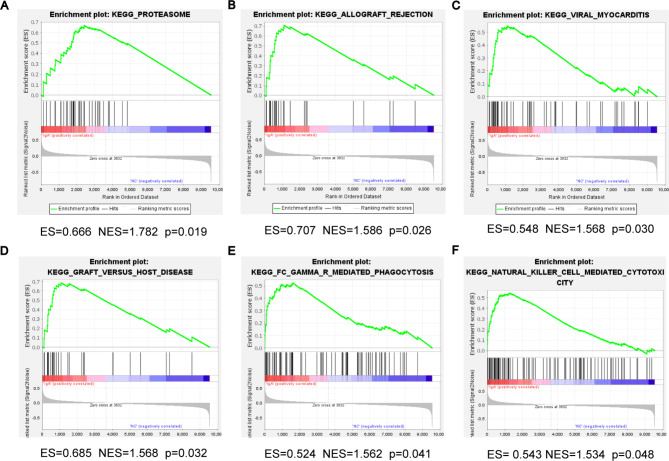
Results: A total of 113 DEGs were screened, which were mostly enriched in peptidase regulator activity, regulation of cytokine production, and collagen-containing extracellular matrix. Among these DEGs, 67 genes manifested pronounced tissue and organ specificity. GSEA analysis revealed that the most significant enriched gene sets were involved in proteasome pathway. Ten hub genes (KNG1, FN1, ALB, PLG, IGF1, EGF, HRG, TYROBP, CSF1R, and ITGB2) were recognized. CTD showed a close connection between ALB, IGF, FN1 and IgAN. Immune infiltration analysis elucidated that IGF1, EGF, HRG, FN1, ITGB2, and TYROBP were closely associated with infiltrating immune cells. ROC curves reflected that all hub genes, especially TYROBP, exhibited a good diagnostic value for IgAN. Verteporfin, moxonidine, and procaine were the most significant three therapeutic drugs. Further exploration proved that TYROBP was not only highly expressed in IgAN, but exhibited high specificity for the diagnosis of IgAN.
Conclusions: This study may offer novel insights into the mechanisms involved in IgAN occurrence and progression and the selection of diagnostic markers and therapeutic targets for IgAN.
Keywords: Bioinformatics analysis; Biomarkers; Diagnosis; Hub genes; IgA nephropathy; Therapeutics.
© 2023. The Author(s).
Conflict of interest statement
The authors declare that the research was performed without any conflicts of interest.
Figures


Similar articles
-
To establish and validate autophagy related biomarkers for the diagnosis of IgA nephropathy.Sci Rep. 2025 Apr 22;15(1):13944. doi: 10.1038/s41598-025-98591-y. Sci Rep. 2025. PMID: 40263537 Free PMC article.
-
Identification and validation of glomerulotubular crosstalk genes mediating IgA nephropathy by integrated bioinformatics.BMC Nephrol. 2022 Apr 13;23(1):143. doi: 10.1186/s12882-022-02779-7. BMC Nephrol. 2022. PMID: 35418061 Free PMC article.
-
Bioinformatics analysis reveals novel hub gene pathways associated with IgA nephropathy.Eur J Med Res. 2020 Sep 7;25(1):40. doi: 10.1186/s40001-020-00441-2. Eur J Med Res. 2020. PMID: 32894197 Free PMC article.
-
Monitoring Immune Responses in IgA Nephropathy: Biomarkers to Guide Management.Front Immunol. 2020 Oct 6;11:572754. doi: 10.3389/fimmu.2020.572754. eCollection 2020. Front Immunol. 2020. PMID: 33123151 Free PMC article. Review.
-
Long non-coding RNA in IgA nephropathy: a comprehensive review.Ren Fail. 2025 Dec;47(1):2495836. doi: 10.1080/0886022X.2025.2495836. Epub 2025 May 6. Ren Fail. 2025. PMID: 40329456 Free PMC article. Review.
Cited by
-
Cathepsin S (CTSS) in IgA nephropathy: an exploratory study on its role as a potential diagnostic biomarker and therapeutic target.Front Immunol. 2024 Jun 24;15:1390821. doi: 10.3389/fimmu.2024.1390821. eCollection 2024. Front Immunol. 2024. PMID: 38979419 Free PMC article.
-
Screening core genes for minimal change disease based on bioinformatics and machine learning approaches.Int Urol Nephrol. 2025 Feb;57(2):655-671. doi: 10.1007/s11255-024-04226-y. Epub 2024 Oct 9. Int Urol Nephrol. 2025. PMID: 39382604
-
Urinary TYROBP and HCK as genetic biomarkers for non-invasive diagnosis and therapeutic targeting in IgA nephropathy.Front Genet. 2024 Dec 24;15:1516513. doi: 10.3389/fgene.2024.1516513. eCollection 2024. Front Genet. 2024. PMID: 39777260 Free PMC article.
-
Therapy of IgA nephropathy: time for a paradigm change.Front Med (Lausanne). 2024 Aug 15;11:1461879. doi: 10.3389/fmed.2024.1461879. eCollection 2024. Front Med (Lausanne). 2024. PMID: 39211339 Free PMC article. Review.
-
Proteomics analysis reveals age-related proteins in the urine of chronic kidney disease patients.Front Med (Lausanne). 2025 Jan 6;11:1506134. doi: 10.3389/fmed.2024.1506134. eCollection 2024. Front Med (Lausanne). 2025. PMID: 39835101 Free PMC article.
References
-
- McGrogan A, Franssen C, de Vries C. The incidence of primary glomerulonephritis worldwide: a systematic review of the literature. Nephrology, dialysis, transplantation: official publication of the european Dialysis and Transplant Association. Eur Ren Association. 2011;26(2):414–30. - PubMed
Publication types
MeSH terms
Substances
LinkOut - more resources
Full Text Sources
Miscellaneous
