. 2023 Feb 24;12(3):461.
doi: 10.3390/antibiotics12030461.

Clinical Resistant Strains of Enterococci and Their Correlation to Reduced Susceptibility to Biocides: Phenotypic and Genotypic Analysis of Macrolides, Lincosamides, and Streptogramins

Affiliations

Clinical Resistant Strains of Enterococci and Their Correlation to Reduced Susceptibility to Biocides: Phenotypic and Genotypic Analysis of Macrolides, Lincosamides, and Streptogramins

Amr Selim Abu Lila et al. Antibiotics (Basel). .

Abstract

Enterococci are troublesome nosocomial, opportunistic Gram-positive cocci bacteria showing enhanced resistance to many commonly used antibiotics. This study aims to investigate the prevalence and genetic basis of antibiotic resistance to macrolides, lincosamides, and streptogramins (MLS) in Enterococci, as well as the correlation between MLS resistance and biocide resistance. From 913 clinical isolates collected from King Khalid Hospital, Hail, Saudi Arabia, 131 isolates were identified as Enterococci spp. The susceptibility of the clinical enterococcal isolates to several MLS antibiotics was determined, and the resistance phenotype was detected by the triple disk method. The MLS-involved resistance genes were screened in the resistant isolates. The current results showed high resistance rates to MLS antibiotics, and the constitutive resistance to all MLS (cMLS) was the most prevalent phenotype, observed in 76.8% of resistant isolates. By screening the MLS resistance-encoding genes in the resistant isolates, the erythromycin ribosome methylase (erm) genes that are responsible for methylation of bacterial 23S rRNA were the most detected genes, in particular, ermB. The ereA esterase-encoding gene was the most detected MLS modifying-encoding genes, more than lnuA (adenylation) and mphC (phosphorylation). The minimum inhibitory concentrations (MICs) of commonly used biocides were detected in resistant isolates and correlated with the MICs of MLS antibiotics. The present findings showed a significant correlation between MLS resistance and reduced susceptibility to biocides. In compliance with the high incidence of the efflux-encoding genes, especially mefA and mefE genes in the tolerant isolates with higher MICs to both MLS antibiotics and biocides, the efflux of resistant isolates was quantified, and there was a significant increase in the efflux of resistant isolates with higher MICs as compared to those with lower MICs. This could explain the crucial role of efflux in developing cross-resistance to both MLS antibiotics and biocides.

Keywords: Enterococci; Enterococci faecalis; Enterococci faecium; MLS phenotypes; biocides; genotyping; lincosamides; macrolides; streptogramins.


Conflict of interest statement

The authors declare no conflict of interest.

Figures

Figure 1
Figure 1
Incidence of Enterococcal spp. Among 913 clinical samples, 35.6% were Gram-positive cocci that contained about 40.3% Enterococci spp. Further, the Enterococcal spp. were presumptively distinguished into E. faecalis (51.1%), E. faecium (39.7%), or other Enterococci species (9.2%).
Figure 2
Figure 2
Percentages of resistance to tested MLS antibiotics. The chi-square test was used to compare the difference in the percentages of resistant isolates to tested antibiotics. There was no significant difference in the resistance of different Enterococci spp. to tested antibiotics; (χ210 = 4.98, p = 0.892).
Figure 3
Figure 3
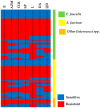
The resistance patterns to the tested MLS antibiotics. The heat map represents the resistance, where red represents the resistant isolates, and blue represents the sensitive isolates. The highest resistance was observed to erythromycin and lincomycin in both E. faecalis and E. faecium. E = Erythromycin, AZM = Azithromycin, CLR = Clarithromycin, SP = Spiramycin, L = Lincomycin, DA = Clindamycin, and QD = Quinupristin/Dalfopristin.
Figure 4
Figure 4
MLS resistance phenotypes. The inhibition zones to erythromycin (E), clindamycin (DA), and lincomycin (L) were observed. (A) Constitutive macrolide/lincosamide/streptogramin resistance (cMLS) phenotype: isolates resistant to the three drugs. (B) Inducible macrolide/lincosamide/streptogramin resistance (iMLS) phenotype: isolates show flattening or blunting of the shape of the clindamycin zone and are resistant to erythromycin and lincomycin. (C) M phenotypes: isolates resistant to erythromycin only but sensitive to clindamycin and lincomycin. (D) L phenotype: isolates resistant to lincomycin and sensitive to clindamycin and erythromycin. E: erythromycin, DA: clindamycin, and L: lincomycin.
Figure 5
Figure 5
MLS resistance genotypes. (A) The distribution of the genes involved in the resistance to MLS in the different resistant isolates. The erm genes, particularly ermB, were the most predominant in all resistant isolates. (B) Heat map represents the percentage of the MLS resistance genes in different phenotypes. (C) Heat map represents the distribution of resistance genes in the resistance to different antibiotics.
Figure 6
Figure 6
The percentages of reduced susceptible isolates to biocides (MIC ≥ MIC50) in the antibiotics-resistant isolates with MIC ≥ MIC50. The chi-square test was used to compare the difference in the percentage of antibiotic-resistant isolates with MIC above or below the MIC50 of tested biocides. It was observed that in the antibiotic-resistant isolates, the percentages of reduced susceptible isolates to all biocides except thiomersal were increased significantly. ns: p > 0.05, *: p ≤ 0.05, **: p ≤ 0.01, ***: p ≤ 0.001.
Figure 7
Figure 7
The Correlation between the reduced susceptibility to biocides and antibiotic resistance was calculated. Pearson’s correlation coefficients of pairwise comparison were employed to assess the correlation between MIC values for antibiotics and biocides of individual isolates, which showed MIC ≥ MIC50. There were significant correlations between the numbers of resistant isolates to antibiotics and the number of isolates with increased susceptibility to all biocides except thiomersal.
Figure 8
Figure 8
The distribution of MLS genes in the highly resistant isolates that showed MIC ≥ MIC50. The efflux encoding genes mefA and mefE were significantly increased in the highly resistant isolates (MIC ≥ MIC50) than in other resistant isolates with MIC < MIC50. That could explain the increased role of efflux in resistance to both antibiotics and biocides. * p < 0.05.
Figure 9
Figure 9
Increased efflux in highly resistant isolates. A quantitative fluorometric assay of EtBr efflux was performed for 20 high-resistant isolates (MIC > MIC50 to MLS antibiotics and biocides) against 20 resistant isolates (MIC < MIC50 to MLS antibiotics and biocides). The efflux assay was performed at conditions that cause maximum accumulation of EtBr in the presence of efflux pump inhibitor verapamil and limited energy supply (absence of glucose and low temperature). The efflux of EtBr is presented in terms of relative fluorescence (RF), which is obtained from the comparison between the fluorescence observed for the bacteria in the presence or absence of glucose and the control in which the cells are exposed to conditions of minimum efflux in the absence of glucose and presence of verapamil. All fluorescence readings were made at excitation and emission wavelengths for EtBr (530 nm and 585 nm, respectively). All data were acquired in cycles of 60 s, during 1 h time intervals, and at 25 °C. Each experiment was conducted in triplicate, and the results obtained were averaged. The relative fluorescence was calculated for each isolate with MICs to biocides >MIC50 or <MIC50, and results were expressed as means ± standard deviation. *** p-value < 0.001 was considered significant using Student’s t-test. Significantly, the efflux of EtBr was increased in the isolates with MIC > MIC50, indicating high efflux activity that could explain high resistance to both biocides and antibiotics.

References

    1. Semedo-Lemsaddek T., Barreto-Crespo M.T., Tenreiro R. Occurrence of putative pathogenicity islands in enterococci from distinct species and of differing origins. Appl. Environ. Microbiol. 2009;75:7271–7274. doi: 10.1128/AEM.00687-09. - DOI - PMC - PubMed
    1. Monstein H.J., Quednau M., Samuelsson A., Ahrne S., Isaksson B., Jonasson J. Division of the genus Enterococcus into species groups using PCR-based molecular typing methods. Pt 5Microbiology. 1998;144:1171–1179. doi: 10.1099/00221287-144-5-1171. - DOI - PubMed
    1. Sharifi Y., Hasani A., Ghotaslou R., Naghili B., Aghazadeh M., Milani M., Bazmany A. Virulence and antimicrobial resistance in enterococci isolated from urinary tract infections. Adv. Pharm. Bull. 2013;3:197–201. doi: 10.5681/apb.2013.032. - DOI - PMC - PubMed
    1. Kirschner C., Maquelin K., Pina P., Ngo Thi N.A., Choo-Smith L.P., Sockalingum G.D., Sandt C., Ami D., Orsini F., Doglia S.M., et al. Classification and identification of enterococci: A comparative phenotypic, genotypic, and vibrational spectroscopic study. J. Clin. Microbiol. 2001;39:1763–1770. doi: 10.1128/JCM.39.5.1763-1770.2001. - DOI - PMC - PubMed
    1. Fiore E., Van Tyne D., Gilmore M.S. Pathogenicity of Enterococci. Microbiol. Spectr. 2019;7:79–87. doi: 10.1128/microbiolspec.GPP3-0053-2018. - DOI - PMC - PubMed

LinkOut - more resources