. 2023 Mar 11;10(3):348.
doi: 10.3390/bioengineering10030348.

Reduced Fibroblast Activation on Electrospun Polycaprolactone Scaffolds

Affiliations

Reduced Fibroblast Activation on Electrospun Polycaprolactone Scaffolds

Joe P Woodley et al. Bioengineering (Basel). .

Abstract

In vivo, quiescent fibroblasts reside in three-dimensional connective tissues and are activated in response to tissue injury before proliferating rapidly and becoming migratory and contractile myofibroblasts. When deregulated, chronic activation drives fibrotic disease. Fibroblasts cultured on stiff 2D surfaces display a partially activated phenotype, whilst many 3D environments limit fibroblast activation. Cell mechanotransduction, spreading, polarity, and integrin expression are controlled by material mechanical properties and micro-architecture. Between 3D culture systems, these features are highly variable, and the challenge of controlling individual properties without altering others has led to an inconsistent picture of fibroblast behaviour. Electrospinning offers greater control of mechanical properties and microarchitecture making it a valuable model to study fibroblast activation behaviour in vitro. Here, we present a comprehensive characterisation of the activation traits of human oral fibroblasts grown on a microfibrous scaffold composed of electrospun polycaprolactone. After over 7 days in the culture, we observed a reduction in proliferation rates compared to cells cultured in 2D, with low KI67 expression and no evidence of cellular senescence. A-SMA mRNA levels fell, and the expression of ECM protein-coding genes also decreased. Electrospun fibrous scaffolds, therefore, represent a tuneable platform to investigate the mechanisms of fibroblast activation and their roles in fibrotic disease.

Keywords: 3D cell culture; biomaterials; electrospinning; fibroblast; scaffold.


Conflict of interest statement

The authors declare no conflict of interest. The funders had no role in the design of the study; in the collection, analyses, or interpretation of data; in the writing of the manuscript, or in the decision to publish the results.

Figures

Figure 1
Figure 1
(A) Representative SEM images of 10, 12, and 15% (w/v) PCL electrospun scaffolds. Beading is evident at 10% and fibres vary in diameter at 12% before homogenizing at 15%. Further characterisation was only completed with 15% (w/v) scaffolds. (B) Fibre diameters are normally distributed according to the D’Agostino and Pearson normality test, and a Gaussian non-linear regression was plotted. (C) Fibre angle distribution. For angle and diameter, 10 fibres were measured in each of 27 images taken from 9 samples and isolated from 3 scaffolds (biological replicates = 3, technical replicates = 3). (D) Mercury Intrusion Porosimetry. Pore diameter distribution was plotted from intrusion data using GraphPad Prism. Only one sample was used for intrusion data (E) Surface pore area distribution (biological replicates = 3, technical replicates = 3).
Figure 2
Figure 2
PrestoBlue™ and PicoGreen™ assay data using 3T3 fibroblasts. (A) PrestoBlue Viability data (B) PicoGreen data. Fluorescence and absorbance were read using a Tecan M200 plate reader and Magellan analysis software. GraphPad Prism software was used to generate graphs. ** p < 0.01, * p < 0.05. Error bars represent the standard error, (biological replicates = 3, technical replicates = 3).
Figure 3
Figure 3
PrestoBlue™ and PicoGreen™ assay data using NOF. (A) PrestoBlue viability data (B) PicoGreen data. Fluorescence and absorbance were read using a Tecan M200 plate reader and Magellan analysis software. GraphPad Prism software was used to generate graphs. * p < 0.05. Error bars represent standard deviation, (biological replicates = 3, technical replicates = 3).
Figure 4
Figure 4
Representative live dead fluorescent images taken at day 1, 4, and 7 during the post seeding of normal oral fibroblasts onto PCL scaffolds and glass cover slips. The same image enhancement using ImageJ software to subtract background fluorescence and increase brightness was used for all images. Live cells are stained green and dead cells are stained red. Scale bar (white) is equal to 200 μm.
Figure 5
Figure 5
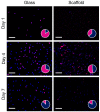
Representative Ki67 immunofluorescent images. The same image enhancement using ImageJ software to subtract background fluorescence and increase brightness was used for all images. Ki67 expressing NOFs were visualized with a CY3 conjugated secondary antibody and appeared purple in the merged images. All cell nuclei were counter stained with DAPI. Superimposed pie-charts show the proportion of cells which were proliferative (Ki67+/DAPI+) in purple and the proportion that were quiescent (Ki67-/DAPI+) in blue. Pie charts were generated after counting all the cell nuclei from 3 randomly positioned images taken from 3 technical replicates from each of the 3 biological replicates for a total of 27 images per time point. Scale bar (white) is equal to 100μm.
Figure 6
Figure 6
Further analysis of the low proliferation state observed in scaffold grown NOF. (A) Shows representative β-gal staining in H2O2-treated NOF with arrows indicating some of the β-gal-stained cells. (B) NOF grown to confluence as a model of quiescence. (C) Graphs displaying qPCR results for senescence associated genes P16, P21, and IL6. Fold changes in gene expression are ‘vs’ senescent NOF and are presented on a logarithmic axis. ** p < 0.01, * p < 0.05. Error bars represent standard deviation. TCP and scaffold (biological replicates = 9, technical replicates = 3), Senescent and Quiescent (biological replicates = 3, technical replicates = 3).
Figure 7
Figure 7
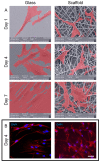
(A): Representative SEM images showing NOF morphology on glass cover slips and electrospun scaffolds. Images are magnified 2000× and scale bars are included with each image. Fibroblasts have been artificially coloured red using Adobe Photoshop 2021. (B): F-actin (red) immunofluorescent staining and DAPI (blue) staining of NOF grown on TCP and scaffolds. The scaffold grown fibroblasts were imaged using a z-stack; TCP is a single focus image. Scale bar = 50 um.
Figure 8
Figure 8
Graphs displaying qPCR results for cytoskeletal genes (A) ACTA2 and (B) VIM. Fold changes in gene expression are ‘vs’ TCP NOF and presented on a logarithmic axis. Comparison bars indicate significant differences: * p < 0.05, ** p < 0.01, **** p < 0.0001. Error bars represent standard deviation. TCP and scaffold (biological replicates = 9, technical replicates = 3), Senescent and Quiescent (biological replicates = 3, technical replicates = 3). TGFβ TCP and Scaffold (biological replicates = 6, technical replicates = 3).
Figure 9
Figure 9
Graphs displaying qPCR results for Extracellular matrix genes. (A) Relative VCAN (V1), (B) COL1A, and (C) COL3A expression. (D) FN1 expression at day 1, 4, and 7. Fold changes in gene expression are ‘vs’ TCP NOF and are presented on a logarithmic axis. Comparison bars indicate significant differences: ** p < 0.01, *** p < 0.001, **** p < 0.0001. Error bars represent standard deviation. A-C: TCP and scaffold (biological replicates = 9, technical replicates = 3), Senescent and Quiescent (biological replicates = 3, technical replicates = 3). (D) Per day (biological repeats = 3, technical repeats = 3).

References

    1. Plikus M.V., Wang X.J., Sinha S., Forte E., Thompson S.M., Herzog E.L., Driskell R.R., Rosenthal N., Biernaskie J., Horsley V. Fibroblasts: Origins, definitions, and functions in health and disease. Cell. 2021;184:3852–3872. doi: 10.1016/j.cell.2021.06.024. - DOI - PMC - PubMed
    1. Hinz B. Formation and function of the myofibroblast during tissue repair. J. Invest. Dermatol. 2007;127:526–537. doi: 10.1038/sj.jid.5700613. - DOI - PubMed
    1. Kalluri R., Zeisberg M. Fibroblasts in cancer. Nat. Rev. Cancer. 2006;6:392–401. doi: 10.1038/nrc1877. - DOI - PubMed
    1. Woodley J.P., Lambert D.W., Asencio I.O. Understanding Fibroblast Behavior in 3D Biomaterials. Tissue Eng. Part. B Rev. 2022;28:569–578. doi: 10.1089/ten.teb.2021.0010. - DOI - PubMed
    1. Cukierman E., Pankov R., Yamada K.M. Cell interactions with three-dimensional matrices. Curr. Opin. Cell Biol. 2002;14:633–639. doi: 10.1016/S0955-0674(02)00364-2. - DOI - PubMed

LinkOut - more resources