. 2023 Feb 21;12(3):537.
doi: 10.3390/antiox12030537.

Over-Expressed GATA-1S, the Short Isoform of the Hematopoietic Transcriptional Factor GATA-1, Inhibits Ferroptosis in K562 Myeloid Leukemia Cells by Preventing Lipid Peroxidation

Affiliations

Over-Expressed GATA-1S, the Short Isoform of the Hematopoietic Transcriptional Factor GATA-1, Inhibits Ferroptosis in K562 Myeloid Leukemia Cells by Preventing Lipid Peroxidation

Silvia Trombetti et al. Antioxidants (Basel). .

Abstract

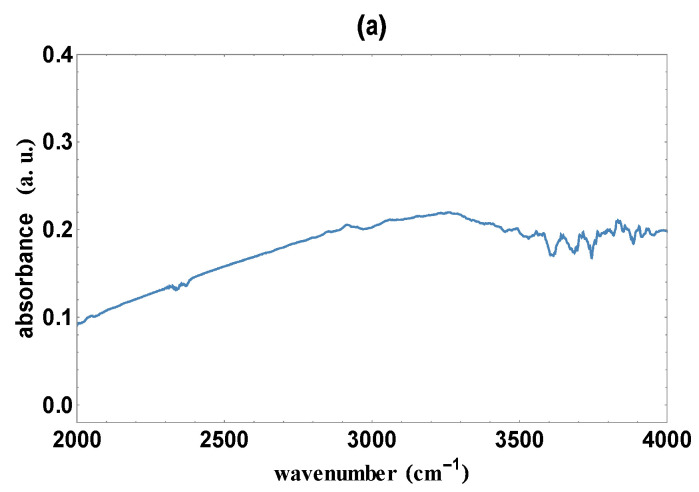
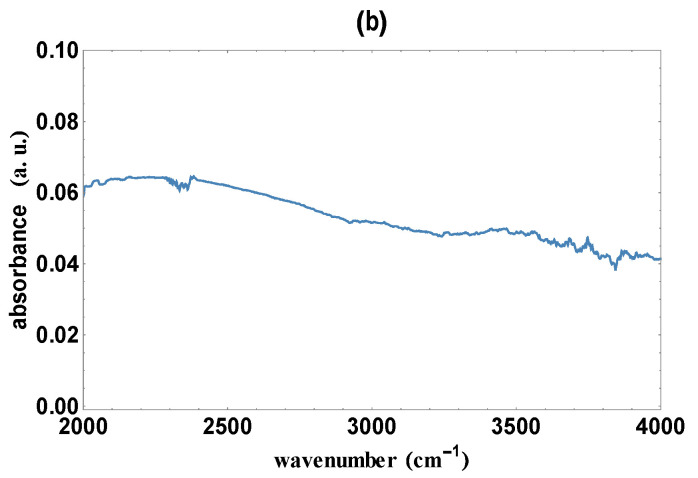
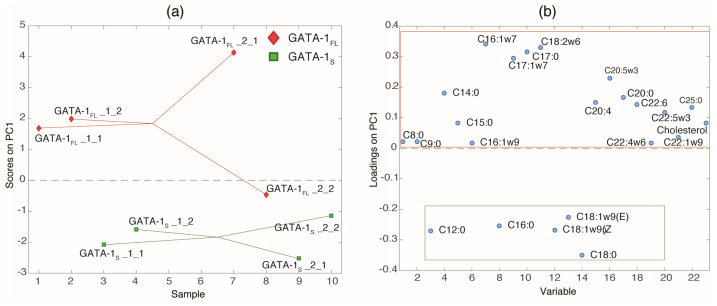
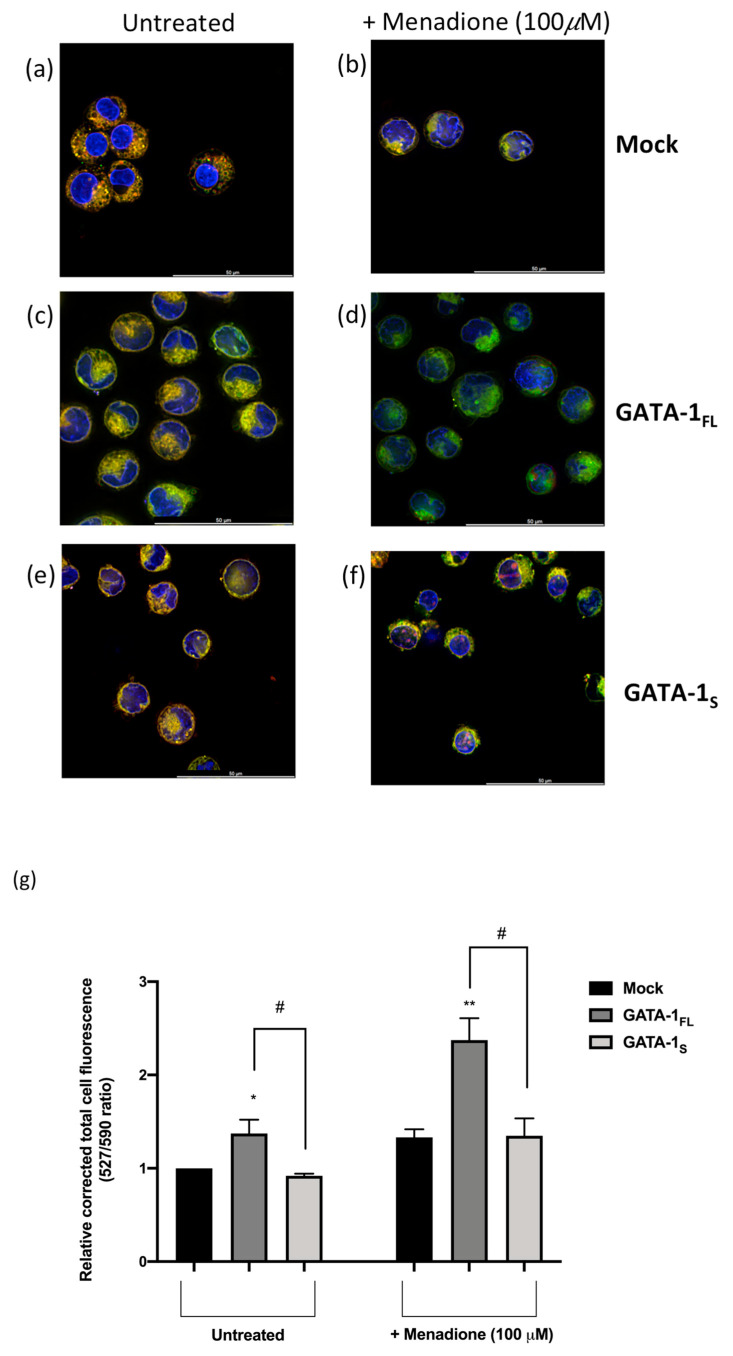
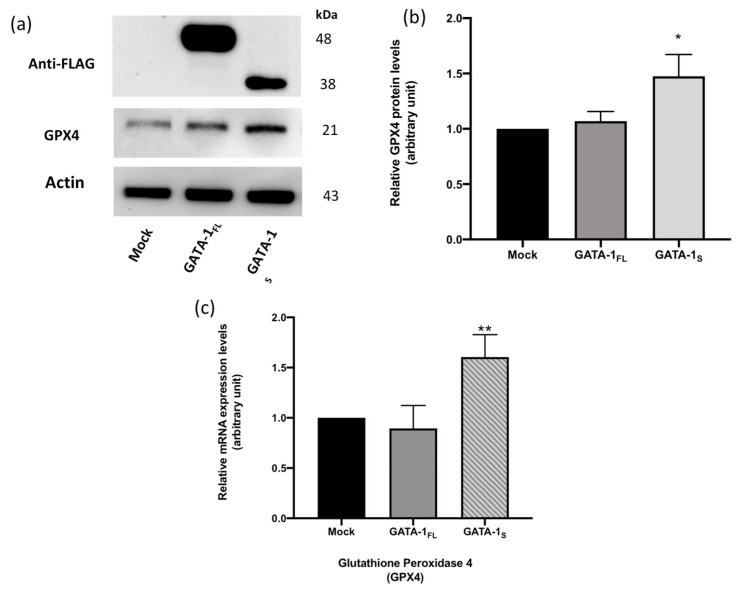
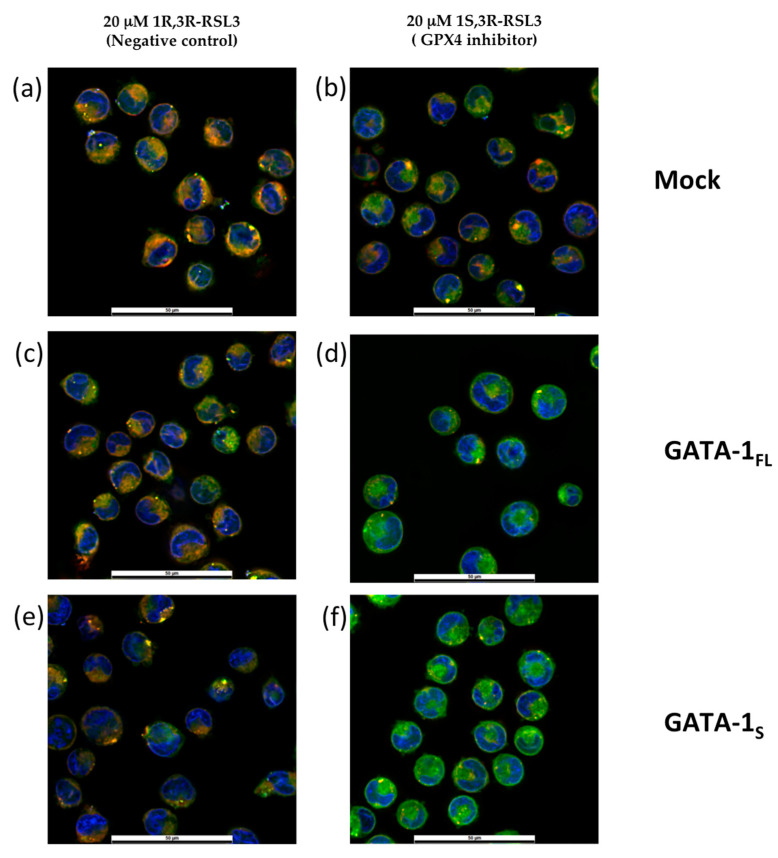
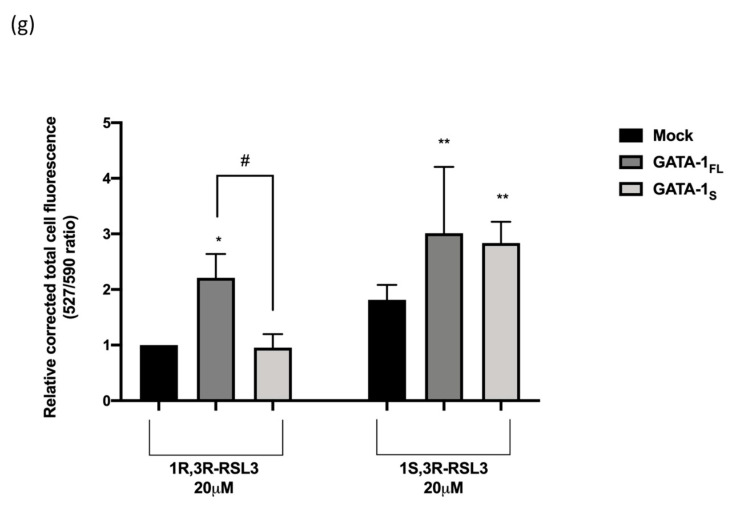
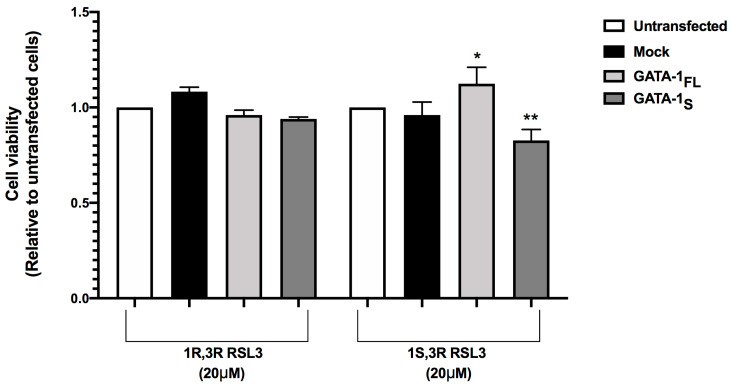
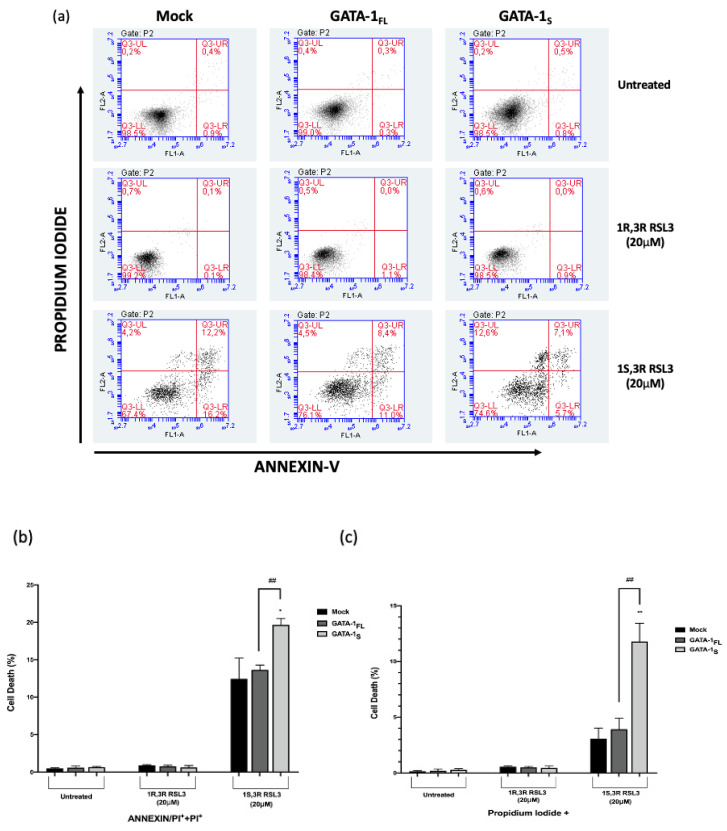
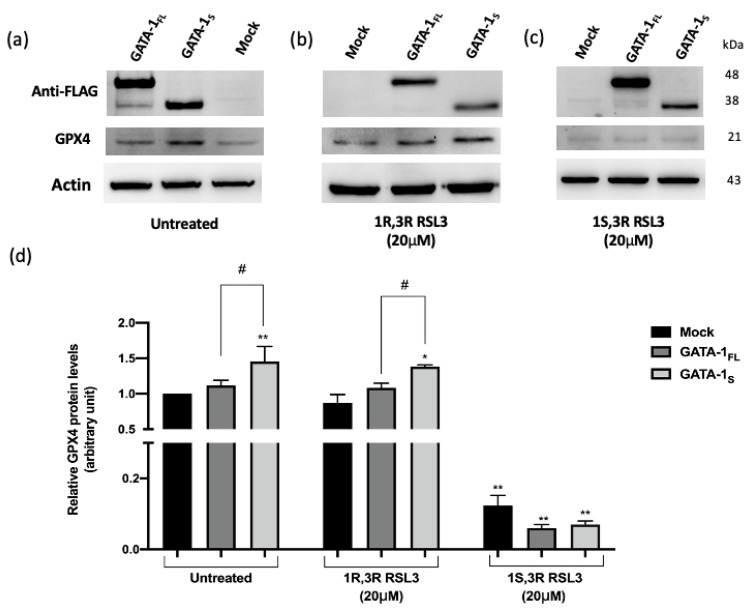
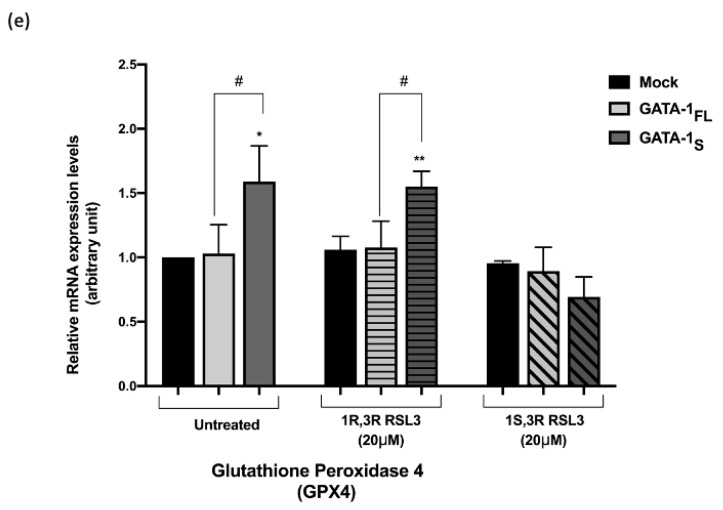
Ferroptosis is a recently recognized form of regulated cell death involving lipid peroxidation. Glutathione peroxidase 4 (GPX4) plays a central role in the regulation of ferroptosis through the suppression of lipid peroxidation generation. Connections have been reported between ferroptosis, lipid metabolism, cancer onset, and drug resistance. Recently, interest has grown in ferroptosis induction as a potential strategy to overcome drug resistance in hematological malignancies. GATA-1 is a key transcriptional factor controlling hematopoiesis-related gene expression. Two GATA-1 isoforms, the full-length protein (GATA-1FL) and a shorter isoform (GATA-1S), are described. A balanced GATA-1FL/GATA-1S ratio helps to control hematopoiesis, with GATA-1S overexpression being associated with hematological malignancies by promoting proliferation and survival pathways in hematopoietic precursors. Recently, optical techniques allowed us to highlight different lipid profiles associated with the expression of GATA-1 isoforms, thus raising the hypothesis that ferroptosis-regulated processes could be involved. Lipidomic and functional analysis were conducted to elucidate these mechanisms. Studies on lipid peroxidation production, cell viability, cell death, and gene expression were used to evaluate the impact of GPX4 inhibition. Here, we provide the first evidence that over-expressed GATA-1S prevents K562 myeloid leukemia cells from lipid peroxidation-induced ferroptosis. Targeting ferroptosis is a promising strategy to overcome chemoresistance. Therefore, our results could provide novel potential therapeutic approaches and targets to overcome drug resistance in hematological malignancies.

Keywords: GATA-1 isoforms; RLS3; cell death; ferroptosis; glutathione peroxidase 4; lipid peroxidation; myeloid leukemia.


Conflict of interest statement

The authors declare no conflict of interest. The funders had no role in study design, data collection and analysis, decision to publish, or preparation of the manuscript. S.T. was supported by a “Nuove emergenze in sicurezza alimentare: strategie per la riduzione del rischio e per la valorizzazione delle produzioni animali- SAFORISK” postdoctoral fellowship.

Figures

Figure 1
Figure 1
Infrared absorbance spectra of K562 cells transiently transfected with (a) GATA-1FL and (b) GATA-1S expression vectors. Spectra wavenumbers are represented on the abscissa and the absorbance is plotted on the ordinate scale.
Figure 1
Figure 1
Infrared absorbance spectra of K562 cells transiently transfected with (a) GATA-1FL and (b) GATA-1S expression vectors. Spectra wavenumbers are represented on the abscissa and the absorbance is plotted on the ordinate scale.
Figure 2
Figure 2
Comparative lipidomic analysis revealing significant changes in fatty acid content in GATA-1FL and GATA-1S groups. The figure shows (a) scores and (b) loadings plots derived from the ASCA output performed by including only GATA-1FL and GATA-1S groups.
Figure 3
Figure 3
Lipid peroxidation in K562 cells transfected with GATA-1 isoforms. Cells were stained with BODIPY 581/591 C11 reagent for measurement of lipid peroxidation: the red to green shift corresponds to lipid peroxidation. Nuclei of live cells were stained with Hoechst 33342 (blue). (af) Representative fluorescence merged images of K562 cells stained with BODIPY™ 581/591 C11 reagent after exposure to RSL3 for 24 h to assess the generation of lipid peroxidation under basal (a,c,e) and pro-oxidant conditions induced by menadione treatment (b,d,f). (g) Quantitative fluorescence ratio analysis of green signals at 527 nm (representing peroxidized lipids)/red signals at 590 nm (representing nonperoxidized lipids) quantified by ImageJ, as elsewhere reported [20,21]. Scale bar = 50 μm. All data shown are representative of three independent experiments. Statistical analysis was performed by one-way ANOVA, followed by Dunnett’s multiple comparisons test, where appropriate. * p-value ≤ 0.05, and ** p-value ≤ 0.001 compared to untreated control group, # p-value ≤ 0.05, GATA-1FL cells versus GATA-1S cells.
Figure 4
Figure 4
Overexpressed GATA-1S is associated with enhanced GPX4 protein and mRNA levels. (ac) Western blot analysis showing overexpressed FLAG-tagged GATA-1FL and GATA-1S isoforms and GPX4 expression levels in total protein extracts obtained from GATA-1FL and GATA-1S cells and from a mock control, respectively. Representative image of three independent experiments is shown. (b) Densitometric analysis of western blot results showing increased GPX4 levels only in K562 cells overexpressing the GATA-1S isoform. For each sample, band intensities were quantified from three independent experiments, and normalized to actin used as a loading control. (c) Quantitative real-time PCR analysis of GPX4 mRNA in cells overexpressing GATA-1 isoforms and in a mock control. mRNA expression levels were normalized against actin. Results showed increased GPX4 mRNA levels in cells overexpressing GATA-1S, according to western blot analysis. All data represent the mean ± SD of three independent experiments. Statistical analysis was performed by one-way ANOVA, followed by Dunnett’s multiple comparisons test, where appropriate. * p-value ≤ 0.05, and ** p-value ≤ 0.001 versus mock control.
Figure 5
Figure 5
Effects of GPX4 inhibition on lipid peroxidation in K562 cells overexpressing GATA-1 isoforms. (af) Representative fluorescence merged images of K562 cells stained with BODIPY™ 581/591 C11 reagent for measurement of cellular lipid peroxidation after exposure to RSL3 for 24 h: the red to green shift corresponds to lipid peroxidation. Nuclei were stained with Hoechst 33342. (a,c,e) Cells treated with 20 μM 1R,3R-RSL3 (inactive enantiomer of 1S,3R-RSL3) were used as negative control. (b,d,f) Cells treated with 20 μM 1S,3R-RSL3 (glutathione peroxidase 4 inhibitor). (g) Quantitative fluorescence ratio analysis of green signals at 527 nm (representing peroxidized lipids)/red signals at 590 nm (representing nonperoxidized lipids) quantified by ImageJ as elsewhere reported [20,21]. Scale bar = 50 μm. All data shown are representative of three independent experiments. Statistical analysis was performed by one-way ANOVA, followed by Dunnett’s multiple comparisons test, where appropriate. * p-value ≤ 0.05, and ** p-value ≤ 0.001 compared to mock control; # p-value ≤ 0.05, GATA-1FL cells versus GATA-1S cells.
Figure 5
Figure 5
Effects of GPX4 inhibition on lipid peroxidation in K562 cells overexpressing GATA-1 isoforms. (af) Representative fluorescence merged images of K562 cells stained with BODIPY™ 581/591 C11 reagent for measurement of cellular lipid peroxidation after exposure to RSL3 for 24 h: the red to green shift corresponds to lipid peroxidation. Nuclei were stained with Hoechst 33342. (a,c,e) Cells treated with 20 μM 1R,3R-RSL3 (inactive enantiomer of 1S,3R-RSL3) were used as negative control. (b,d,f) Cells treated with 20 μM 1S,3R-RSL3 (glutathione peroxidase 4 inhibitor). (g) Quantitative fluorescence ratio analysis of green signals at 527 nm (representing peroxidized lipids)/red signals at 590 nm (representing nonperoxidized lipids) quantified by ImageJ as elsewhere reported [20,21]. Scale bar = 50 μm. All data shown are representative of three independent experiments. Statistical analysis was performed by one-way ANOVA, followed by Dunnett’s multiple comparisons test, where appropriate. * p-value ≤ 0.05, and ** p-value ≤ 0.001 compared to mock control; # p-value ≤ 0.05, GATA-1FL cells versus GATA-1S cells.
Figure 6
Figure 6
Effects of GPX4 inhibition on cell viability in GATA-1FL and GATA-1S cells. The effects of treatment with 20 μM 1R,3R RSL3 (negative control) and 20 μM 1S,3S RSL3 (GPX4 inhibitor) were evaluated with an MTT assay with respect to untransfected cells and mock control. In this context, it should be underlined that statistical significance of MTT signals in GATA-1FL cells relative to untransfected and mock controls was of limited significance (* p value = 0.047), whereas a more robust significant difference was observed between GATA-1S cells and untransfected and mock controls (** p value = 0.0046). The graph represents the mean and SD of three separate experiments.
Figure 7
Figure 7
Effects of GPX4 inhibition on cell death in K562 cells overexpressing GATA-1 isoforms. (a) Representative images of flow cytometric evaluation of cell death. Necrotic and apoptotic cells were detected by annexin V and PI staining followed by flow cytometry analysis 48 h after transfection and 24 h of RSL3 treatment. The LR, UR, and UL quadrants show the annexin V+/PI− (early apoptosis), annexin V+/PI+ (late apoptosis/necrosis), and annexin V–/PI+ (necrosis), respectively. The LL quadrants measure the percentage of double-negative cells. No variation in annexin-V and PI percentage was observed in cells treated with the inactive enantiomer of RSL3 (1S,3R RSL3) compared to untreated cells. In contrast, the treatment with 20 μM 1S,3R RSL3 resulted in enhanced necrotic pathways in GATA-1S cells; (b) Cumulative percentage of annexin-V+/PI+ and annexin-V–/PI+ cells; (c) Percentage of annexin-V–/PI+ cells. The graphs represent the mean and SD of three independent experiments. Statistical analysis was performed by one-way ANOVA, followed by Dunnett’s multiple comparison test, where appropriate. * p < 0.05, ** p < 0.0001 versus mock control, ## p < 0.0001, GATA-1S cells versus GATA-1FL cells.
Figure 8
Figure 8
Effects of RSL3 treatment on GPX4 levels. (ac) Representative western blot images and densitometric analysis of GPX4 levels in total protein extracts obtained from cells overexpressing FLAG-tagged GATA-1FL or GATA-1S and from mock control in (a) untreated cells and (b,c) cells treated with 1R,3R-RSL3 (inactive enantiomer, used as negative control) or with 1S,3R-RSL3 (glutathione peroxidase 4 inhibitor); (d) Densitometric quantification of western blot results showing higher GPX4 levels accompanied by GATA-1S overexpression in untreated cells or cells treated with the RSL inactive enantiomer compared to GATA-1FL. Conversely, in all cell types (mock, GATA_1FL cells and GATA_1S cells) GPX4 levels were dramatically reduced after treatment with 1S,3R RSL3. For each sample, band intensities of the GPX4 signal were quantified and normalized to actin used as a loading control. All data represent the mean ± SD of three independent experiments. (e) Quantitative RT-PCR (qRT-PCR) analysis of GPX4 after treatment with RSL3. mRNA expression levels were normalized against β-actin. Results showed a more dramatic reduction of GPX4 mRNA levels in GATA-1S cells treated with RSL3. Statistical analysis was performed by one-way ANOVA, followed by Dunnett’s multiple comparisons test, where appropriate. For each group * p-value ≤ 0.05, and ** p-value ≤ 0.001 compared to corresponding mock control, # p-value ≤ 0.05, GATA-1FL cells versus GATA-1S cells.
Figure 8
Figure 8
Effects of RSL3 treatment on GPX4 levels. (ac) Representative western blot images and densitometric analysis of GPX4 levels in total protein extracts obtained from cells overexpressing FLAG-tagged GATA-1FL or GATA-1S and from mock control in (a) untreated cells and (b,c) cells treated with 1R,3R-RSL3 (inactive enantiomer, used as negative control) or with 1S,3R-RSL3 (glutathione peroxidase 4 inhibitor); (d) Densitometric quantification of western blot results showing higher GPX4 levels accompanied by GATA-1S overexpression in untreated cells or cells treated with the RSL inactive enantiomer compared to GATA-1FL. Conversely, in all cell types (mock, GATA_1FL cells and GATA_1S cells) GPX4 levels were dramatically reduced after treatment with 1S,3R RSL3. For each sample, band intensities of the GPX4 signal were quantified and normalized to actin used as a loading control. All data represent the mean ± SD of three independent experiments. (e) Quantitative RT-PCR (qRT-PCR) analysis of GPX4 after treatment with RSL3. mRNA expression levels were normalized against β-actin. Results showed a more dramatic reduction of GPX4 mRNA levels in GATA-1S cells treated with RSL3. Statistical analysis was performed by one-way ANOVA, followed by Dunnett’s multiple comparisons test, where appropriate. For each group * p-value ≤ 0.05, and ** p-value ≤ 0.001 compared to corresponding mock control, # p-value ≤ 0.05, GATA-1FL cells versus GATA-1S cells.

References

    1. Li D., Li Y. The Interaction between Ferroptosis and Lipid Metabolism in Cancer. Sig. Transduct. Target Ther. 2020;5:108. doi: 10.1038/s41392-020-00216-5. - DOI - PMC - PubMed
    1. Kang R., Kroemer G., Tang D. The Tumor Suppressor Protein P53 and the Ferroptosis Network. Free Radic. Biol. Med. 2019;133:162–168. doi: 10.1016/j.freeradbiomed.2018.05.074. - DOI - PMC - PubMed
    1. Yuan H., Li X., Zhang X., Kang R., Tang D. Identification of ACSL4 as a Biomarker and Contributor of Ferroptosis. Biochem. Biophys. Res. Commun. 2016;478:1338–1343. doi: 10.1016/j.bbrc.2016.08.124. - DOI - PubMed
    1. Zhang C., Liu X., Jin S., Chen Y., Guo R. Ferroptosis in Cancer Therapy: A Novel Approach to Reversing Drug Resistance. Mol. Cancer. 2022;21:47. doi: 10.1186/s12943-022-01530-y. - DOI - PMC - PubMed
    1. Yang L., Cao L., Zhang X., Chu B. Targeting Ferroptosis as a Vulnerability in Pulmonary Diseases. Cell Death Dis. 2022;13:649. doi: 10.1038/s41419-022-05070-7. - DOI - PMC - PubMed

LinkOut - more resources