. 2023 Mar 4;12(3):641.
doi: 10.3390/antiox12030641.

The Transcription Factor NRF2 Has Epigenetic Regulatory Functions Modulating HDACs, DNMTs, and miRNA Biogenesis

Affiliations

The Transcription Factor NRF2 Has Epigenetic Regulatory Functions Modulating HDACs, DNMTs, and miRNA Biogenesis

Ignacio Silva-Llanes et al. Antioxidants (Basel). .

Abstract

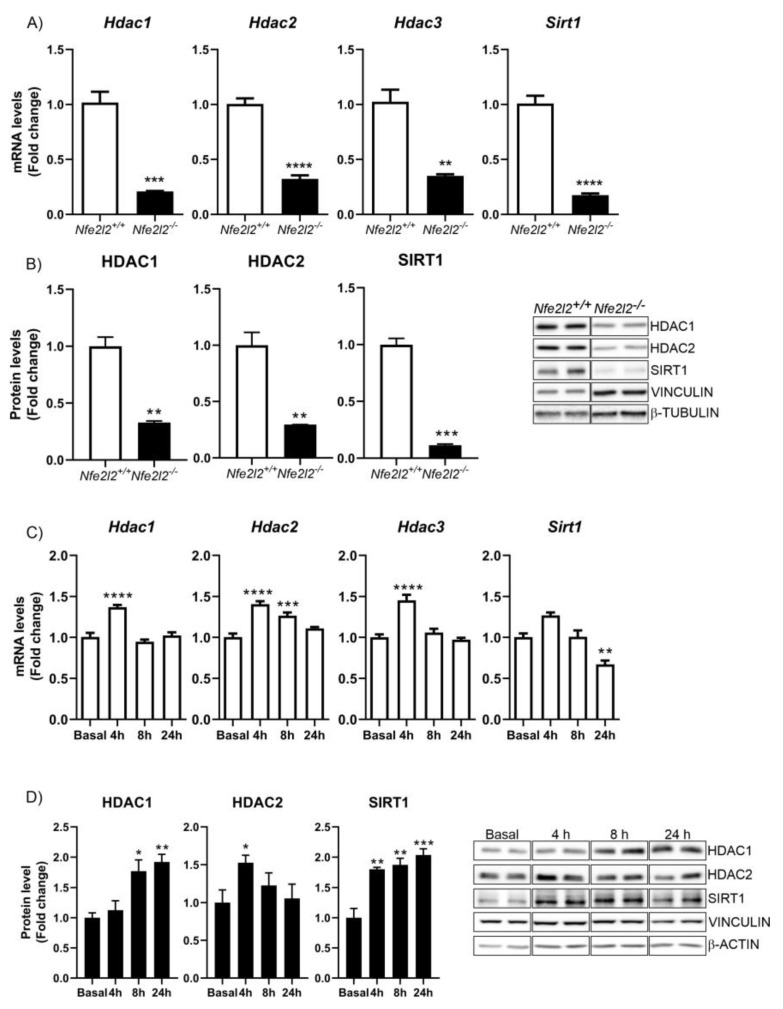
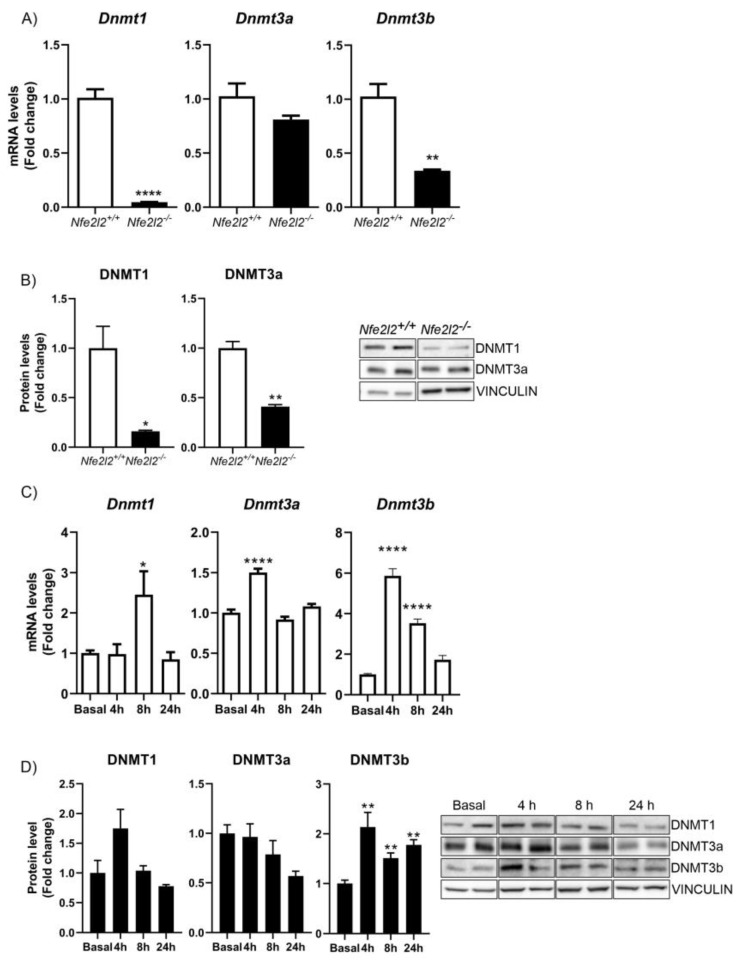
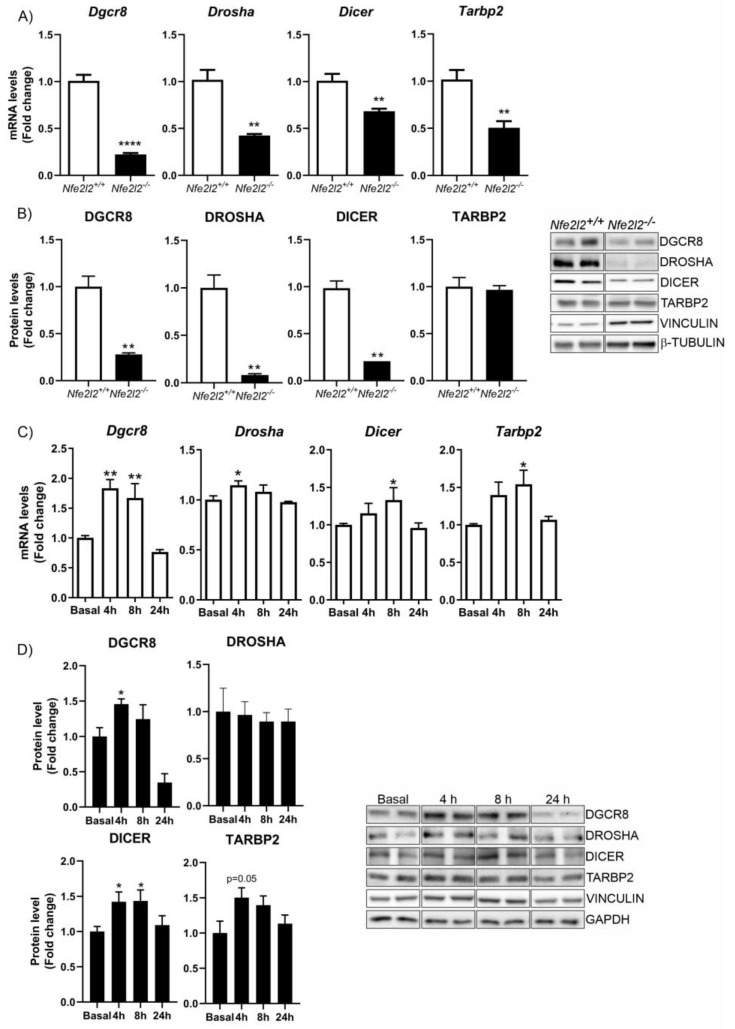
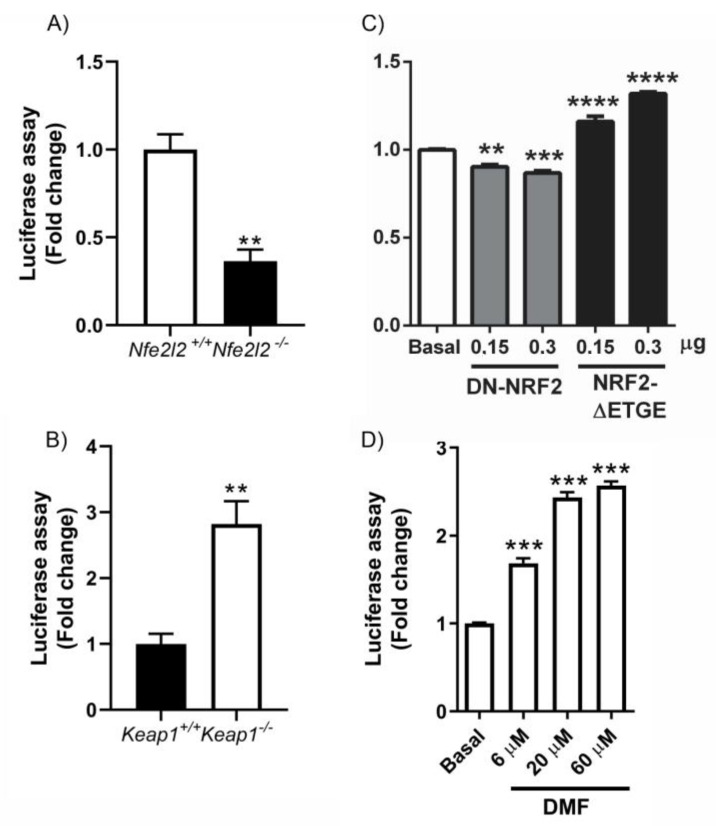
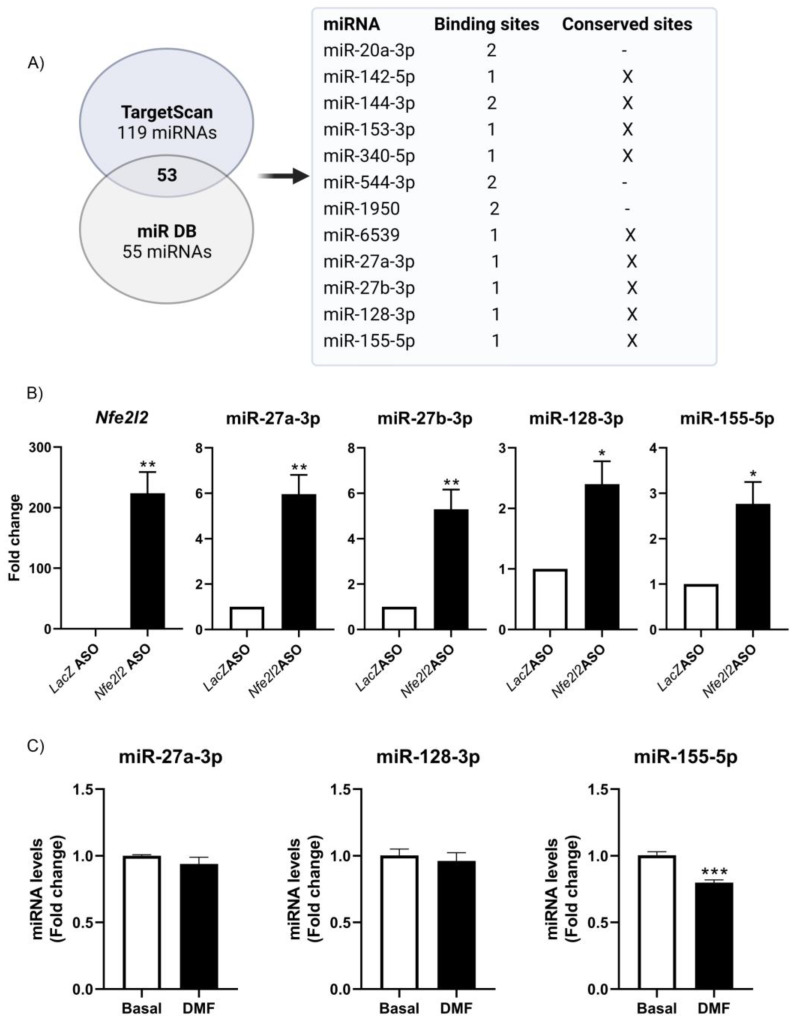
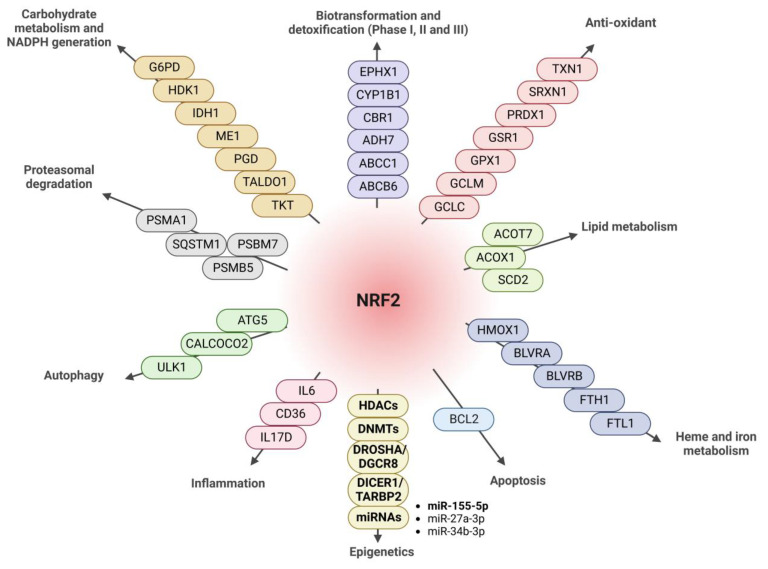
The epigenetic regulation of gene expression is a complex and tightly regulated process that defines cellular identity and is associated with health and disease processes. Oxidative stress is capable of inducing epigenetic modifications. The transcription factor NRF2 (nuclear factor erythroid-derived 2-like 2) is a master regulator of cellular homeostasis, regulating genes bearing antioxidant response elements (AREs) in their promoters. Here, we report the identification of ARE sequences in the promoter regions of genes encoding several epigenetic regulatory factors, such as histone deacetylases (HDACs), DNA methyltransferases (DNMTs), and proteins involved in microRNA biogenesis. In this research, we study this possibility by integrating bioinformatic, genetic, pharmacological, and molecular approaches. We found ARE sequences in the promoter regions of genes encoding several HDACs, DNMTs, and proteins involved in miRNA biogenesis. We confirmed that NRF2 regulates the production of these genes by studying NRF2-deficient cells and cells treated with dimethyl fumarate (DMF), an inducer of the NRF2 signaling pathway. In addition, we found that NRF2 could be involved in the target RNA-dependent microRNA degradation (TDMD) of miR-155-5p through its interaction with Nfe2l2 mRNA. Our data indicate that NRF2 has an epigenetic regulatory function, complementing its traditional function and expanding the regulatory dimensions that should be considered when developing NRF2-centered therapeutic strategies.

Keywords: DMF; DNMT; HDAC; NRF2; TDMD; epigenetics; miRNA; oxidative stress.


Conflict of interest statement

The authors declare no conflict of interest.

Figures

Figure 1
Figure 1
NRF2 promotes the expression of HDCAs. (A) qPCR analysis of the levels of Hdac1, Hdac2, Hdac3, and Sirt1 mRNAs in Nfe2l2+/+ and Nfe2l2−/− MEFs. n = 34 samples ± SEM. (B) The protein levels of HDAC1, HDAC2, HDAC3, and SIRT1 were analyzed via immunoblotting and their respective quantification based on densitometry using the same samples as in (A). n = 3–4 samples per experimental group ± SEM. Asterisks denote significant differences ** p < 0.01 and *** p < 0.001, comparing the indicated group with the wild-type mice according to a Student’s t-test. Time-course analysis of treatment of hippocampal HT22 cells with DMF (20 μM). (C) RT-qPCR analysis of the levels of Hdac1, Hdac2, Hdac3, and Sirt1 mRNAs. n = 4−5 samples ± SEM. (D) The protein levels of HDAC1, HDAC2, HDAC3, and SIRT1 were analyzed via immunoblotting and their respective quantification based on densitometry. n = 3−4 samples per experimental group ± SEM. The one-way ANOVA test with a Newman–Keuls posterior test was used to evaluate differences in significance between groups: * p < 0.05, ** p < 0.01, *** p < 0.001 and **** p < 0.0001 compared to basal levels.
Figure 2
Figure 2
NRF2 promotes the expression of DNMT1 and DNMT3b. (A) qPCR measurement of the levels of Dnmt1, Dnmt3a, and Dnmt3b mRNAs in Nfe2l2+/+ and Nfe2l2−/− MEFs. n = 3−4 samples ± SEM. (B) The protein levels of DNMT1, DNMT3a, and DNMT3b were analyzed via immunoblotting and quantification based on densitometry using the same samples as in (A). n = 3−4 samples per experimental group ± SEM. Asterisks denote significant differences: * p < 0.05, ** p < 0.01, and **** p < 0.0001, comparing the indicated group with the wild-type mice according to a Student’s t-test. Time-course analysis of treatment of hippocampal HT22 cells with DMF (20 μM). (C) RT-qPCR analysis of the levels of Dnmt1, Dnmt3a, and Dnmt3b mRNAs. n = 4−5 samples ± SEM. (D) Protein levels of DNMT1, DNMT3a, and DNMT3b were analyzed via immunoblotting and respective quantification based on densitometry. n = 3−4 samples per experimental group ± SEM. The one-way ANOVA test with a Newman–Keuls posterior test was used to evaluate differences in significance between groups: ** p < 0.01 compared to basal levels.
Figure 3
Figure 3
Impact of NRF2 on the expression levels of several proteins implicated in miRNA biogenesis. (A) qPCR analysis of the levels of Dgcr8, Drosha, Dicer1, and Tarbp2 mRNAs n = 3−4 samples ± SEM. (B) In the same cells described in (A), the levels of DGCR8, DROSHA, DICER, and TARBP2 proteins were analyzed via immunoblotting and quantification based on densitometry using the same samples as in (A). n = 3−4 samples per experimental group ± SEM. Asterisks denote significant differences: ** p < 0.01 and **** p < 0.0001, comparing the indicated group with the wild-type mice according to a Student’s t-test. Time-course analysis of treatment of hippocampal HT22 cells with DMF (20 μM). (C) qPCR analysis of the levels of Dgcr8, Drosha, Dicer1, and Tarbp2 mRNAs. n = 4−5 samples ± SEM. (D) In the cells described in (C), the levels of DGCR8, DROSHA, DICER, and TARBP2 were analyzed via immunoblotting and respective quantification based on densitometry. n = 3−4 samples per experimental group ± SEM. The one-way ANOVA test with a Newman–Keuls posterior test was used to evaluate differences in significance between groups: * p < 0.05 and ** p < 0.01 compared to basal levels.
Figure 4
Figure 4
Function of the 3’UTR-Nfe2l2 via luciferase reporter analysis. The potential ability of miRNAs or other factors to regulate the 3’ untranslated region (3’UTR) of Nfe2l2 mRNA was evaluated using a luciferase reporter. (A) Nfe2l2+/+ and Nfe2l2−/− MEFs cells and (B) Keap1−/− and Keap1+/+ MEF cells were transfected with pSGG-NRF2-3’UTR. (C) HT22 cells were transfected with pSGG-NRF2-3’UTR, pEF-ΔNRF2(DN), or pcDNA3.1/V5HisB-mNRF2ΔETGE, respectively. Asterisks denote significant differences: ** p < 0.01, *** p < 0.001 and **** p < 0.0001, comparing the indicated group with the control group according to a Student’s t-test. (D) HT22 cells were transfected with pSGG-NRF2-3’UTR and treated with DMF at 6 μM, 20 μM, or 60 μM for 16h. All luciferase activities were measured 24 h after transfection. The luciferase activities were normalized to the renilla luciferase activities from the co-transfected reporter. The relative luciferase activities were calculated by normalizing them to those of controls. n = 3 samples per experimental group ± SEM. The one-way ANOVA test with a Newman–Keuls posterior test was used to evaluate differences in significance between groups: ** p < 0.01 and *** p < 0.001 compared to basal levels.
Figure 5
Figure 5
Association of miR-27a-3p, miR-27b-3p, miR-128-3p and miR-155-5p with Nfe2l2 mRNA and possible role of NRF2 mRNA in TDMD of miR-155-5p. (A) Study design. Of the 53 miRNAs common between both databases, we examined which ones contained either two binding sites or conserved sites or both. These 12 miRNAs were further analyzed. (B) Biotinylated antisense oligomers (ASOs) complementary to the Nfe2l2 mRNA and LacZ were incubated with HT22 lysates. After affinity pulldown using streptavidin beads, the levels of miRNA enrichment in the ASO-pulldown samples were assessed via RT-qPCR analysis, and only miR-27a-3p, miR-27b-3p, miR-128-3p, and miR-155-5p were enriched (relative to the enrichment of Gapdh mRNA, a transcript that does not bind the ASOs and encodes a housekeeping protein) in the pulldown samples. (C) HT22 cells were treated with DMF (20 μM) for 16 h, and miRNA levels were measured via qPCR analysis. Asterisks denote a significant difference: * p < 0.05, ** p < 0.01, and *** p < 0.001 compared to the corresponding control group according to a Student’s t-test.
Figure 6
Figure 6
GO biological process analysis using the ShinyGo 0.76.2 platform. Neuronal-related functions are highlighted (blue). Using the TargetScan platform, the list of genes that can be modulated by miR-155-5p was extracted. These genes were analyzed using the ShinyGO 0.76.2 pathway database GO biological process platform.
Figure 7
Figure 7
Diagram of the main targets of NRF2. NRF2 is implicated in the regulation of biotransformation and detoxification proteins (Phase I, II, III). ABCB6: ATP-binding cassette, subfamily B (MDR/Tap) member 6; ABCC1: ATP-binding cassette, subfamily C (CFTR/MRP); ADH7: alcohol dehydrogenase class 4 mu/sigma chain; CBR1: carbonyl reductase 1; CYP1B1: cytochrome P450; EPHX1 epoxide hydrolase 1, microsomal. Antioxidants: GCLC: glutamate–cysteine ligase, catalytic subunit; GCLM: glutamate–cysteine ligase, modifier subunit; GPX1: glutathione peroxidase 1; GSR1: glutathione reductase 1; PRDX1: peroxiredoxin 1; SRXN1: sulfiredoxin 1; TXN1: thioredoxin. Lipid metabolism: ACOT7: acetyl-CoA thioesterase 7; ACOX1: acetyl-CoA oxidase 1; SCD2: stearoyl-CoA desaturase-2. Heme and iron metabolism: HMOX1: heme oxygenase 1; BLVRA: biliverdin reductase A; BLVRB: biliverdin reductase B; FTH1: ferritin, heavy polypeptide; FTL1: ferritin, light polypeptide. Apoptosis: BCL2 B:-cell lymphoma 2. Epigenetics: Type-I HDACs (HDAC1, HDAC2, HDAC3, and SIRT1); DNMTs (DNMT1, DNMT3a, and DNMT3b); DROSHA, DGCR8, DICER1, and TARBP2; miRNAs associated with NRF2: miR-155-5p, miR27a-3p, and miR-34b-3p. Inflammation: IL6: interleukin 6; CD36: cluster of differentiation 36; IL17D: interleukin-17D. Autophagy: ATG5: autophagy protein 5; CALCOCO2: calcium-binding and coiled-coil domain-containing protein 2; ULK1: Unc-51-like kinase 1. Proteasomal degradation: PSMB5: proteasome subunit beta type-5; PSMB7: proteasome subunit beta type-7; SQSTM1: sequestosome 1 (p62); PSMA1: proteasome 20S subunit alpha 1. Carbohydrate metabolism and NADPH generation: TKT: transketolase isoform 1; TALDO1: transaldolase; PGD: 6-phosphogluconate dehydrogenase; ME1: malic enzyme 1; IDH1: NADP-dependent isocitrate dehydrogenase; HDK1: hexokinase domain-containing 1; G6PD: glucose-6-phosphate dehydrogenase. Modified from [46] and highlighting the new NRF2 targets described in this study.

Similar articles

Cited by

References

    1. Stephens K.E., Miaskowski C.A., Levine J.D., Pullinger C.R., Aouizerat B.E. Epigenetic regulation and measurement of epigenetic changes. Biol. Res. Nurs. 2013;15:373–381. doi: 10.1177/1099800412444785. - DOI - PMC - PubMed
    1. Jaenisch R., Bird A. Epigenetic regulation of gene expression: How the genome integrates intrinsic and environmental signals. Nat. Genet. 2003;33:245–254. doi: 10.1038/ng1089. - DOI - PubMed
    1. Kreuz S., Fischle W. Oxidative stress signaling to chromatin in health and disease. Epigenomics. 2016;8:843–862. doi: 10.2217/epi-2016-0002. - DOI - PMC - PubMed
    1. Dinkova-Kostova A.T., Kostov R.V., Kazantsev A.G. The role of Nrf2 signaling in counteracting neurodegenerative diseases. FEBS J. 2018;285:3576–3590. doi: 10.1111/febs.14379. - DOI - PMC - PubMed
    1. Cuadrado A. Brain-Protective Mechanisms of Transcription Factor NRF2: Toward a Common Strategy for Neurodegenerative Diseases. Annu. Rev. Pharmacol. Toxicol. 2022;62:255–277. doi: 10.1146/annurev-pharmtox-052220-103416. - DOI - PubMed

LinkOut - more resources