

Larval Dispersal Modeling Reveals Low Connectivity among National Marine Protected Areas in the Yellow and East China Seas
- PMID: 36979088
- PMCID: PMC10044727
- DOI: 10.3390/biology12030396
Larval Dispersal Modeling Reveals Low Connectivity among National Marine Protected Areas in the Yellow and East China Seas
Abstract
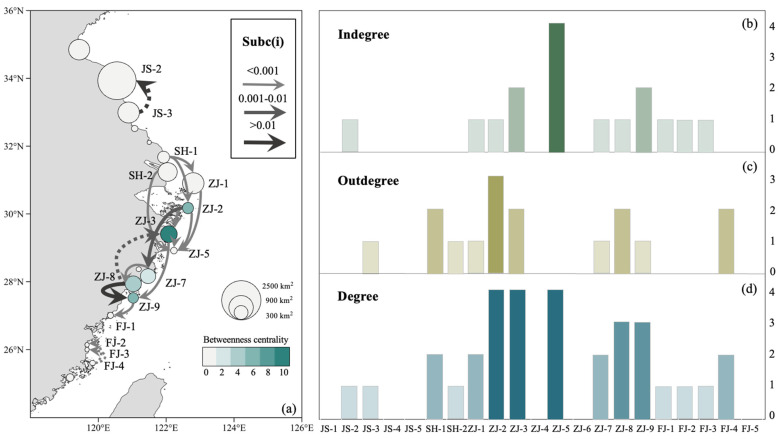
Marine protected areas (MPAs) are vital for protecting biodiversity, maintaining ecosystem integrity, and tackling future climate change. The effectiveness of MPA networks relies on connectivity, yet connectivity assessments are often skipped in the planning process. Here we employed a multi-species biophysical model to examine the connectivity patterns formed among the 21 national MPAs in the Yellow and East China Seas. We simulated the potential larval dispersal of 14 oviparous species of five classes. Larvae of non-migratory species with pelagic larval duration (PLD) were assumed to be passive floating particles with no explicit vertical migration. A total of 217,000 particles were released according to spawning period, living depth, and species distribution, and they were assumed to move with currents during the PLD. Most larvae were dispersed around the MPAs (0-60 m isobaths) and consistent with the currents. Larval export increased with PLD and current velocity, but if PLD was too long, few larvae survived due to high daily mortality during pelagic dispersal. The overall connectivity pattern exhibited a north-to-south dispersal trend corresponding to coastal currents. Our results indicated that the national MPAs in the Yellow and East China Seas did not form a well-connected network and nearly 30% of them were isolated. These MPAs formed three distinct groups, one in the Yellow Sea ecoregion and two in the East China Sea ecoregion. Four MPAs (all in coastal Zhejiang) emerged as key nodes for ensuring multi-generational connectivity. Under the pressure of future climate change, high self-recruitment and low connectivity present significant challenges for building well-connected MPA networks. We suggest adding new protected areas as stepping stones for bioecological corridors. Focused protection of the Yellow Sea ecoregion could have a good effect on the southern part of the population recruitment downstream. Conservation management should be adjusted according to the life cycles and distributions of vulnerable species, as well as seasonal changes in coastal currents. This study provides a scientific basis for improving ecological connectivity and conservation effectiveness of MPAs in the Yellow and East China Seas.
Keywords: biophysical modeling; connectivity; larval dispersal; marine protected areas; network.
Conflict of interest statement
We declare that we have no known competing financial interests or personal relationships that could have appeared to influence the work reported in this paper.
Figures


References
-
- Lin J., Liu X. Evaluation of the Management Effectiveness of Marine Protected Areas: A Brief Review of Recent Research Progress. J. Oceanol. Limnol. 2019;26:286–294.
-
- Woodley S., Bertzky B., Crawhall N., Dudley N., Sandwith T. Meeting Aichi Target 11: What does success look like for Protected Area systems? Parks. 2012;18:23–36.
-
- Harrison H.B., Williamson D.H., Evans R.D., Almany G.R., Thorrold S.R., Russ G.R., Feldheim K.A., van Herwerden L., Planes S., Srinivasan M., et al. Larval Export from Marine Reserves and the Recruitment Benefit for Fish and Fisheries. Curr. Biol. 2012;22:1023–1028. doi: 10.1016/j.cub.2012.04.008. - DOI - PubMed
-
- Olds A., Connolly R., Pitt K., Maxwell P. Habitat connectivity improves reserve performance. Conserv. Lett. 2012;5:56–63. doi: 10.1111/j.1755-263X.2011.00204.x. - DOI
Grants and funding
- 2022YFC3102400/Ministry of Science and Technology of the People's Republic of China
- 42142018/National Natural Science Foundation of China
- 42206082/National Natural Science Foundation of China
- 21TQ1400220/Shanghai Pilot Program for Basic Research-Shanghai Jiao Tong University
- SL2021PT101/Oceanic Interdisciplinary Program of Shanghai Jiao Tong University
LinkOut - more resources
Full Text Sources
Other Literature Sources
