. 2023 Mar 10;13(3):511.
doi: 10.3390/biom13030511.

Behavioral and Transcriptomic Changes Following Brain-Specific Loss of Noradrenergic Transmission

Affiliations

Behavioral and Transcriptomic Changes Following Brain-Specific Loss of Noradrenergic Transmission

Elsa Isingrini et al. Biomolecules. .

Abstract

Noradrenaline (NE) plays an integral role in shaping behavioral outcomes including anxiety/depression, fear, learning and memory, attention and shifting behavior, sleep-wake state, pain, and addiction. However, it is unclear whether dysregulation of NE release is a cause or a consequence of maladaptive orientations of these behaviors, many of which associated with psychiatric disorders. To address this question, we used a unique genetic model in which the brain-specific vesicular monoamine transporter-2 (VMAT2) gene expression was removed in NE-positive neurons disabling NE release in the entire brain. We engineered VMAT2 gene splicing and NE depletion by crossing floxed VMAT2 mice with mice expressing the Cre-recombinase under the dopamine β-hydroxylase (DBH) gene promotor. In this study, we performed a comprehensive behavioral and transcriptomic characterization of the VMAT2DBHcre KO mice to evaluate the role of central NE in behavioral modulations. We demonstrated that NE depletion induces anxiolytic and antidepressant-like effects, improves contextual fear memory, alters shifting behavior, decreases the locomotor response to amphetamine, and induces deeper sleep during the non-rapid eye movement (NREM) phase. In contrast, NE depletion did not affect spatial learning and memory, working memory, response to cocaine, and the architecture of the sleep-wake cycle. Finally, we used this model to identify genes that could be up- or down-regulated in the absence of NE release. We found an up-regulation of the synaptic vesicle glycoprotein 2c (SV2c) gene expression in several brain regions, including the locus coeruleus (LC), and were able to validate this up-regulation as a marker of vulnerability to chronic social defeat. The NE system is a complex and challenging system involved in many behavioral orientations given it brain wide distribution. In our study, we unraveled specific role of NE neurotransmission in multiple behavior and link it to molecular underpinning, opening future direction to understand NE role in health and disease.

Keywords: SV2c; anxiety; circadian rhythms; cocaine sensitization; depression; noradrenaline; sleep.


Conflict of interest statement

The authors declare no conflict of interest.

Figures

Figure 1
Figure 1
Anxiety and depression-like behavior in VMAT2DBHcre mice. (A) Percentage of time spent in the open arms of the elevated plus maze in VMAT2DBHcre WT (n = 29) and KO (n = 29) mice (t56 = −1.5, p = 0.14, ns). (B). Latency (s) to eat the food pellet placed at the center of the open field in the novelty-suppressed feeding test in VMAT2DBHcre WT (n = 25) and KO (n = 27) mice (t50 = 3.70, *** p = 0.0005). (C) Number of buried marbles with bedding during 30 min in VMAT2DBHcre WT (n = 18) and KO (n = 17) mice (t33 = 2.07, * p = 0.047). (D) Percentage of immobility time in the forced swim test in VMAT2DBHcre WT and KO mice injected intraperitoneally with NaCl (0.9%; WT n = 8, KO n = 8), citalopram (10 mg/kg; WT n = 6, KO n = 8) and reboxetine (20 mg/kg; WT n = 8, KO n = 6; genotype × treatment: F(2,38) = 4.73, p = 0.015; post-hoc test: compared to the NaCl group of the same genotype * p = 0.048 ** p = 0.002 *** p = 0.00004, compared to WT group with the same treatment *** p = 0.0009). (E) Percentage of sucrose preference over drinking water during 4 consecutive days in VMAT2DBHcre WT (n = 10) and KO (n = 9) mice (genotype × day: F(3,48) = 0.81, p = 0.49, ns). (F) Plasma corticosterone level (ng/mL) at baseline, after 30 min of restrain stress and 90 min after the end of the stress in VMAT2DBHcre WT (n = 18) and KO (n = 17) mice (genotype × time: F(2,66) = 7.63, p = 0.001; post-hoc test: compared to the WT group at the same time *** p = 0.00017). (G) Percentage of dexamethasone-induced suppression of plasma corticosterone level in VMAT2DBHcre WT (n = 5) and KO (n = 5) (t8 = 2.72, * p = 0.026).
Figure 2
Figure 2
Emotional memory and nociception in VMAT2DBHcre mice. (A) Percentage of immobility time during the 2 min adaptation period and the two pairings (2 min ITI) of a 30-sec tone (80 dB) ending with a 2 sec 0.5 mA foot shock in VMAT2DBHcre WT (n = 7) and KO (n = 8) mice (genotype: F(1,13) = 0.17, p = 0.69; tone: F(2,26) = 76.20, ** p < 0.01, *** p < 0.001; genotype × tone: F(2,26) = 1.67, p = 0.21; left). Percentage of immobility during the 3 min of the contextual fear memory test performed 24 h after the fear conditioning (t13 = 2.86, * p = 0.013; middle). Percentage of immobility during the 2 min habituation and the 30 sec tone (80 dB) in the cued memory test performed 24 h after the fear conditioning (genotype: F(1,13) = 1, p = 0.33; tone: F(1,13) = 365.25, p < 0.001; genotype × tone: F(1,13) = 0.053, p = 0.82; right). (B) Latency (s) to respond to the heat stimulus with vigorous flexion of the tail when the water temperature is maintained at 48 °C for a first session and then at 52 °C in VMAT2DBHcre WT (n = 10) and KO (n = 9) mice (genotype: F(1,17) = 0.44, p = 0.52; temperature: F(1,17) = 92.91, *** p < 0.001; genotype × temperature: F(1,17) = 0.57, p = 0.46).
Figure 3
Figure 3
Learning, memory, and adaptative behavior in VMAT2DBHcre mice. (A) Mean escape latency (s) in the spatial hidden-platform version of the Morris water maze in VMAT2DBHcre WT and KO (n = 10 per group, left) (genotype: F(1,18) = 0.012, p = 0.91; session: F(6,108) = 10.86, p < 0.001; genotype × session: F(6,108) = 1.25, p = 0.29). Percentage of time spent in the active quadrant during the probe test of the MWM in each genotype (WT vs. KO: t18 = −0.34, p = 0.74 (ns); difference to 25%: WT t9 = 2.45, * p = 0.037; KO t9 = 2.17, * p = 0.05). (B) Escape latency (s) to retrieve the hidden platform during 4 sessions per day for 3 days in the rapid place learning version of the Morris water maze for working memory test in VMAT2DBHcre WT (n = 10) and KO (n = 10) mice (day 1: genotype F(1,18) = 0.36, p = 0.56; session F(3,54) = 2.02, p = 0.12; genotype × session F(3,54) = 0.55, p = 0.65; day 2: genotype F(1,18) = 0.53, p = 0.47; session F(3,54) = 2.75, p = 0.051; genotype × session F(3,54) = 0.90, p = 0.45; day 3: genotype F(1,18) = 1.24, p = 0.28; session F(3,54) = 4.33, p = 0.008; genotype × session F(3,54) = 0.67, p = 0.57). (C) Mean escape latency (s) in the reversal training of the spatial hidden-platform version of the Morris water maze in VMAT2DBHcre WT and KO (n = 10 per group, left) (genotype: F(1,18) = 1.96, p = 0.18; sessions: F(5,90) = 5.69, p = 0.0001; genotype × session: F(5,90) = 0.35, p = 0.88). Percentage of time spent in the active quadrant during the probe test in each genotype (WT vs. KO: t18 = −2.77, ** p = 0.013; difference to 25%: WT t9 = 2.06, p = 0.069; KO t9 = 6.22, *** p = 0.00015). (D) Illustration of the attentional set shifting task (ASST) in which mediums or odors are associated with a reward during the compound discrimination test (CD), the reversal test, the intra-dimensional (ID) shift and the extra-dimensional (ED) shift. Number of trials required to found the food reward in order to reach the criteria of 6 consecutive correct trials during each test in VMAT2DBHcre WT (n = 15) and KO (n = 17) mice (genotype: F(1,30) = 18.22, p = 0.00018, test: F(3,90) = 40.76, p < 0.0001, genotype × test: F(3,90) = 3.51, p = 0.018; post-hoc test * p = 0.016, *** p < 0.001).
Figure 4
Figure 4
Addiction-like behavior in VMAT2DBHcre mice. (A) Acute locomotor response (horizontal activity) to cocaine for 2 h following i.p. injection of 5, 10, or 20 mg/kg in the WT and KO mice of the VMAT2DBHcre (n = 6 per group; genotype: F(1,30) = 0.04, p = 0.84; concentration: F(2,30) = 19.6, p < 0.001; genotype × concentration: F(2,30) = 1.01, p = 0.38). (B) Locomotor sensitization after repeated i.p., administration of 20 mg/kg cocaine over 6 days followed by 48 h of withdrawal in the WT and KO mice of the VMAT2DBHcre (n = 10 per group; genotype: F(1,18) = 0.003, p = 0.95; day: F(1,18) = 54.04, *** p < 0.001, genotype × day: F(1,18) = 0.64, p = 0.43). (C) Acute locomotor response (horizontal activity) to amphetamine for 1 h following i.p. injection of 1, 3, or 5 mg/kg in the WT (1 mg/kg n = 5, 3 mg/kg n = 9, 5 mg/kg n = 6) and KO (1 mg/kg n = 6, 3 mg/kg n = 9, 5 mg/kg n = 6) mice of the VMAT2DBHcre (genotype: F(1,35) = 6.87, * p = 0.013; concentration: F(2,35) = 19.2, p < 0.001; genotype × concentration: F(2,35) = 1.13, p = 0.33). (D) Locomotor sensitization after repeated i.p. administration of 3 mg/kg amphetamine over 6 days followed by 48 h of withdrawal in the WT and KO mice of the VMAT2DBHcre (n = 9 per group; genotype: F(1,16) = 4.11, p = 0.06; day: F(1,16) = 55.92, *** p < 0.001, genotype × day: F(1,16) = 0.0081, p = 0.93).
Figure 5
Figure 5
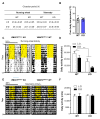
Circadian rhythmicity in VMAT2DBHcre mice. (A) Average circadian locomotor period derived from chi-squared periodogram analysis of 7-day time-spans during light/dark (L:D) cycles and constant darkness (D:D) derived from home cage running wheel activity (genotype: F(1,16) = 0.77, p = 0.39, cycle: F(1,16) = 0.01, p = 0.91, genotype × cycle: F(1,16) = 0.22, p = 0.64) or telemetry implants (genotype: F(1,10) = 0.0, p = 1, cycle: F(1,10) = 11.6, ** p = 0.006, genotype × cycle: F(1,10) = 0.0, p = 1). (B) Average core body temperature (°C) in WT (n = 6) and KO (n = 6) VMAT2DBHcre mice measured by telemetry over 7 days (t10 = −0.18, p = 0.86). (C) Representative double-plotted actograms of running wheel activity in VMAT2DBHcre WT (right) and KO (left) mice. The yellow shadows indicate the light phases over the 24 h cycle. (D) Mean running wheel activity over 7 days during L:D and D:D in VMAT2DBHcre WT (n = 9) and KO (n = 9) mice (genotype: F(1,16) = 11.39, ** p = 0.0039; cycle: F(1,16) = 17.43, p < 0.001; genotype × cycle: F(1,16) = 0.32, p = 0.58). (E) Representative double-plotted actograms of telemetric activity in VMAT2DBHcre WT (right) and KO (left) mice. The yellow shadows indicate the light phases over the 24 h cycle. (F) Mean telemetric activity over 7 days of L:D and D:D in VMAT2DBHcre WT (n = 6) and KO (n = 6) mice (genotype: F(1,10) = 0.055, p = 0.82; cycle: F(1,0) = 0.00, p = 0.99; genotype × cycle: F(1,10) = 0.0071, p = 0.93).
Figure 6
Figure 6
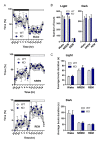
Sleep architecture analysis in VMAT2DBHcre mice. (A) Hourly percentage of time over a 24 h period during the dark (grey) and the light cycle (white) spent in wake (top; genotype: F(1,138) = 0.46, p = 0.52; hour: F(23,138) = 7.03, p < 0.001; genotype × hour: F(23,138) = 1.73, p = 0.028; post-hoc test * p < 0,036, ** p < 0,003), non-rapid eye movement (NREM, middle; genotype: F(1,138) = 0.35, p = 0.57; hour: F(23,138) = 6.34, p < 0.001; genotype × hour: F(23,138) = 1.62, p = 0.047; post-hoc test * p < 0.043, ** p < 0.0037) and REM (bottom; genotype: F(1,138) = 2.1, p = 0.2; hour: F(23,138) = 7.01, p < 0.001; genotype × hour: F(23,138) = 1.56, p = 0.062) in WT (n = 6) and KO (n = 5) VMAT2DBHcre mice. (B) Number of bouts spent in wake, NREM and REM during the light (left; genotype: F(1,27) = 1.33, p = 0.26; state: F(2,27) = 99.72, p < 0.001; genotype x state: F(2,27) = 0.39, p = 0.68) and the dark cycle (right; genotype: F(1,27) = 0.26, p = 0.61; state: F(2,27) = 34.03, p < 0.001; genotype × state: F(1,10) = 0.042, p = 0.96) in WT (n = 6) and KO (n = 5) VMAT2DBHcre mice. (C) Average bouts duration in wake, NREM and REM during the light (top; genotype: F(1,27) = 1.33, p = 0.26; state: F(2,27) = 99.72, p < 0.001; genotype × state: F(2,27) = 0.40, p = 0.68) and the dark cycle (bottom; genotype: F(1,27) = 0.27, p = 0.61; state: F(2,27) = 34.03, p < 0.001; genotype × state: F(2,27) = 0.043, p = 0.96) in WT (n = 6) and KO (n = 5) VMAT2DBHcre mice.
Figure 7
Figure 7
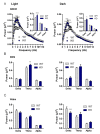
Sleep recording analysis in VMAT2DBHcre mice: power spectrum frequency. (A) Average spectral distribution of cortical EEG power spectrum during NREM in WT (n = 6) and KO (n = 4) VMAT2DBHcre mice during the light cycle (left; genotype: F(1,384) = 13.59, p = 0.006; frequency: F(48,384) = 37.49, p < 0.001; genotype × frequency: F(48,384) = 2.50, p < 0.001; post-hoc test * p < 0.05, ** p < 0.01, *** p < 0.001) and the dark cycle (right; genotype: F(1,384) = 8.15, p = 0.021; state: F(48,384) = 77.11, p < 0.001; genotype × state: F(48,384) = 3.64, p < 0.001; post-hoc test * p < 0.05, ** p < 0.01, *** p < 0.001). The power analysis by frequency ranges (delta: 0.5–4.5 Hz; theta: 5–9 Hz; alpha: 9–12 Hz) is shown in the top right corner of each NREM power spectrum distribution curve during the light cycle (top; genotype: F(1,24) = 1.39, p = 0.25; state: F(2,24) = 360.19, p < 0.001; genotype × state: F(2,24) = 9.31, p = 0.001; post-hoc test *** p < 0.00032) and the dark cycle (bottom; genotype: F(1,24) = 0.052, p = 0.82; state: F(2,24) = 280.88, p < 0.001; genotype × state: F(2,24) = 4.70, p = 0.019; post-hoc test * p < 0.015). (B) Wake period power spectrum analysis by frequency ranges (delta: 0.5–4.5 Hz; theta: 5–9 Hz; alpha: 9–12 Hz) in WT (n = 6) and KO (n = 4) VMAT2DBHcre mice during the light cycle (left; genotype: F(1,24) = 0.091, p = 0.76; frequency: F(2,24) = 67.79, p < 0.001; genotype × frequency: F(2,24) = 1.28, p = 0.30) and the dark cycle (right; genotype: F(1,24) = 0.74, p = 0.40; frequency: F(2,24) = 57.88, p < 0.001; genotype × frequency: F(2,24) = 9.20, p = 0.0011; post-hoc test *** p = 0.00055). (C) REM period power spectrum analysis by frequency ranges (delta: 0.5–4.5 Hz; theta: 5–9 Hz; alpha: 9–12 Hz) in WT (n = 6) and KO (n = 4) VMAT2DBHcre mice during the light cycle (left; genotype: F(1,24) = 0.75, p = 0.39; frequency: F(2,24) = 239.31, p < 0.001; genotype × frequency: F(2,24) = 4.37, p = 0.024; post-hoc test ** p = 0,086) and the dark cycle (right; genotype: F(1,24) = 0.207, p = 0.65; frequency: F(2,24) = 144.02, p < 0.001; genotype × frequency: F(2,24) = 2.15, p = 0.14).
Figure 8
Figure 8
Heatmaps of differentially expressed gene in six brain areas in VMAT2DBHcre mice. Columns represent the differentially expressed genes (i.e., adjusted p-value ≥ 0.05 and |log fold| ≥ 1), with gene symbol on top, and rows represent the samples with the four rows corresponding to WT samples rows color-coded in black and the four rows corresponding to VMAT2DBHCre KO in grey. The color temperature varying from blue (low) to red (high) indicates the intensity of expression. As indication, below each heatmap, a single line heatmap displays log fold information with shades of pink for positive values (i.e., genes up-regulated in the KO) and shades of green for negative values (i.e., genes down-regulated in KO). The log fold heat map is not scaled with one another and numbers below each extremity (positive and negative) indicates the range of values for each region.
Figure 9
Figure 9
Enriched gene sets across individual brain regions. Enriched (over-represented) gene Scheme 2. DBHCre KO are shown in red; enriched gene sets with down-regulated genes in VMAT2DBHCre KO are shown in blue.
Figure 10
Figure 10
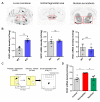
SV2c in situ hybridization. (A) Illustration of SV2c mRNA radioactive in situ labeling in the locus coeruleus (Left), ventral tegmental area (center), and nucleus accumbens (right). (B) Density (nCi/mg) of SV2c mRNA expression in the locus coeruleus (left), ventral tegmental area (center), and nucleus accumbens (right), measured by radioactive in situ hybridization, in WT (n = 4) and KO (n = 4) VMAT2BDHcre mice (t6 = −4.25, ** p = 0.0054). (C) Schematic representation of the chronic social defeat stress paradigm. (D) Density (nCi/mg) of SV2c mRNA expression in the locus coeruleus, measured by radioactive in situ hybridization, in control (n = 5), susceptible (n = 4), and resilient (n = 4) mice to the chronic social defeat stress paradigm (F(2,10) = 5.41, p = 0.026; Post hoc test: CTL vs. SUSC: * p = 0.012, SUSC vs. RES: * p = 0.025, CTL vs. RES: p = 0.79, ns).

References

    1. Robbins T.W. Opinion on monoaminergic contributions to traits and temperament. Philos. Trans. R. Soc. B: Biol. Sci. 2018;373:20170153. doi: 10.1098/rstb.2017.0153. - DOI - PMC - PubMed
    1. Peter D., Liu Y., Sternini C., de Giorgio R., Brecha N., Edwards R.H. Differential expression of two vesicular monoamine transporters. J. Neurosci. 1995;15:6179–6188. doi: 10.1523/JNEUROSCI.15-09-06179.1995. - DOI - PMC - PubMed
    1. Reimer R.J., A Fon E., Edwards R.H. Vesicular neurotransmitter transport and the presynaptic regulation of quantal size. Curr. Opin. Neurobiol. 1998;8:405–412. doi: 10.1016/S0959-4388(98)80068-8. - DOI - PubMed
    1. Weihe E., Schäfer M.K.H., Erickson J.D., Eiden L.E. Localization of vesicular monoamine transporter isoforms (VMAT1 and VMAT2) to endocrine cells and neurons in rat. J. Mol. Neurosci. 1994;5:149–164. doi: 10.1007/BF02736730. - DOI - PubMed
    1. Blakely R.D., Edwards R.H. Vesicular and Plasma Membrane Transporters for Neurotransmitters. Cold Spring Harb. Perspect. Biol. 2012;4:a005595. doi: 10.1101/cshperspect.a005595. - DOI - PMC - PubMed

Publication types